

Risk, Diet and Health Data is the part of Topic 1, Lifestyle, Health and Risk, of the Edexcel A level Biology A (Salters-Nuffield) specification about who develops cardiovascular disease and why. You need to know how genetics, diet, age, gender, high blood pressure, smoking and inactivity increase the risk of CVD, analyse data on illness and mortality, evaluate the design of health studies, explain why perceived risk differs from actual risk, and interpret data on energy balance, blood cholesterol and obesity indicators. It also covers the ethics of using invertebrates in research. This topic is examined on AS Paper 1 and on A level Papers 1, 2 and 3. Questions marked AS are from the AS papers (8BN0); the rest are from the A level papers (9BN0).
Most marks here come from data, and the examiners' reports warn against simply repeating figures. Describe the trend, then add the detail that earns the extra mark, such as a non-linear increase or a fall at the highest values, and use ratios, not subtraction, to determine an effect. 'Comment on' means judging the data, not explaining causes. When judging validity, refer to the study in the question, and name saturated fat or cholesterol, not just 'fats'.
Studying Edexcel SNAB and want more help? If you'd like to arrange one-to-one Edexcel tutoring, or to register your interest in an Edexcel group class, message Tom on WhatsApp using the link at the bottom of this page.
What you need from GCSE
Each question on this page assumes you're secure on these ideas. If any of them feels shaky, look it up before you start.
- A risk factor is something that increases the chance of developing a disease.
- A correlation between two variables does not prove that one causes the other.
- Body mass index is calculated from a person's mass and height.
- If energy taken in is greater than energy used, the extra is stored and body mass increases.
Key terms
These words come up in the questions and mark schemes. Examiners expect you to use them exactly.
- Risk factor: something that increases the probability of developing a disease, such as smoking or high blood pressure.
- Correlation: a relationship between two variables; it does not show that one causes the other.
- Causation: a change in one variable directly brings about a change in another.
- Validity: how far a study measures what it claims to, with a suitable sample and other variables controlled.
- Body mass index (BMI): mass (kg) divided by height squared (m²); a BMI above 30 indicates obesity.
- Waist-to-hip ratio: waist measurement divided by hip measurement; an obesity indicator that reflects fat stored around the abdomen.
- Energy budget: the balance between energy taken in as food and energy used; a surplus is stored as fat.
- LDL and HDL: low-density and high-density lipoproteins that carry cholesterol in the blood; high LDL raises the risk of CVD.
What these questions cover (Edexcel SNAB Topic 1: Lifestyle, Health and Risk)
The questions test these statements from Topic 1 of the Pearson Edexcel A level Biology A (Salters-Nuffield) specification (9BN0).
- 1.7 Know how factors such as genetics, diet, age, gender, high blood pressure, smoking and inactivity increase the risk of cardiovascular disease (CVD).
- 1.8 Be able to analyse and interpret quantitative data on illness and mortality rates to determine health risks, including distinguishing between correlation and causation an
- 1.9 Be able to evaluate the design of studies used to determine health risk factors, including sample selection and sample size used to collect data that is both valid and re
- 1.10 Understand why people’s perceptions of risks are often different from the actual risks, including underestimating and overestimating the risks due to diet and other lifes
- 1.11 ii Understand the consequences of energy imbalance, including weight loss, weight gain, and development of obesity.
- 1.15 i Be able to analyse and interpret data on the possible significance for health of blood cholesterol levels and levels of high-density lipoproteins (HDLs) and low-density l
- 1.16 Understand how people use scientific knowledge about the effects of diet, including obesity indicators, body mass index and waist-to-hip ratio, exercise and smoking to re
- 1.17 Be able discuss the potential ethical issues regarding the use of invertebrates in research.
How to use this page
Write your answer on paper before you open the mark scheme. Allow about 1.2 minutes per mark: the 20 questions are worth 56 marks, so about 67 minutes in total. Then mark your answer strictly against the mark scheme and read the examiners' tip underneath it. If you'd rather print the questions, download the PDF pack.
Risk factors for CVD (1.7)
Question 1
AS Paper 1 · November 2021 · Q2(b) · 4 marks
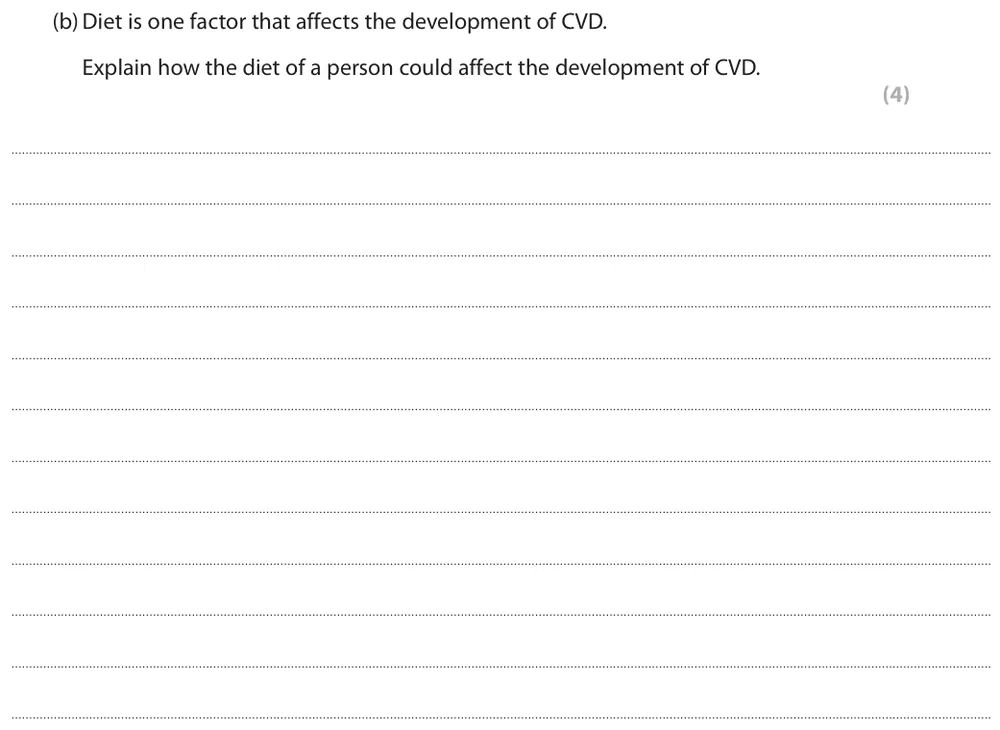
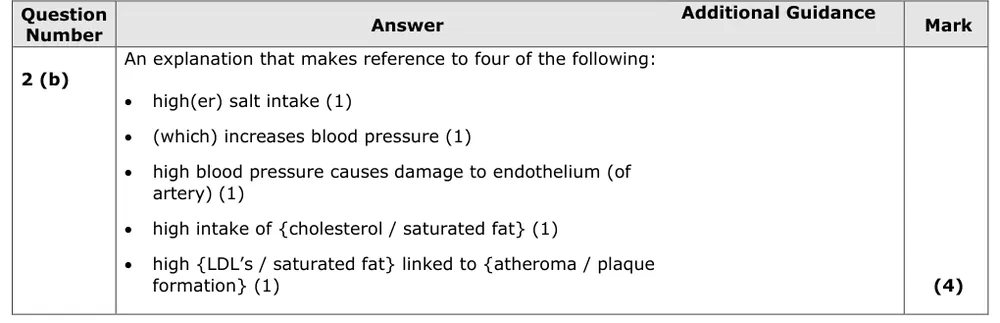
Explain how a person's diet could affect the development of CVD.
Show the mark scheme
Tap an image to open it full size.
From the examiners' report: Dietary risk factors were well known, but 'high intake of fats' unqualified was not enough: say cholesterol or saturated fat. Few explained how salt causes harm: it raises blood pressure, which damages the endothelium of the artery.
Question 2
A level Paper 3 · June 2023 · Q5(b)(ii) · 3 marks · Easy
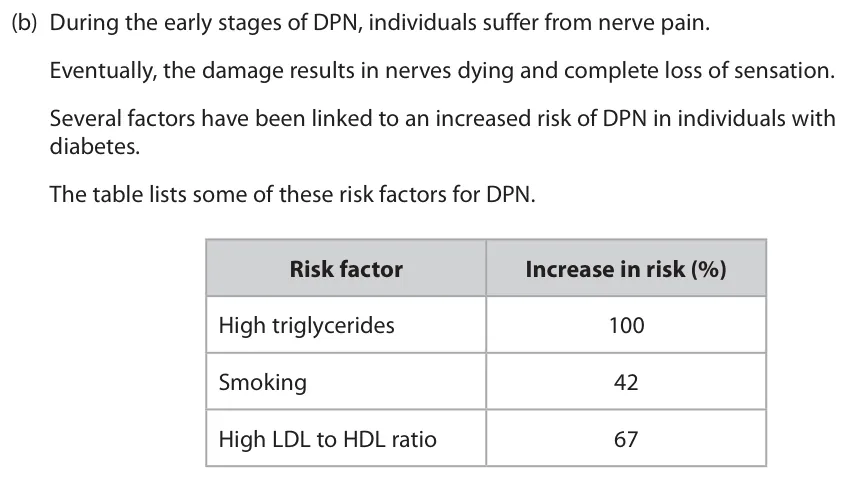
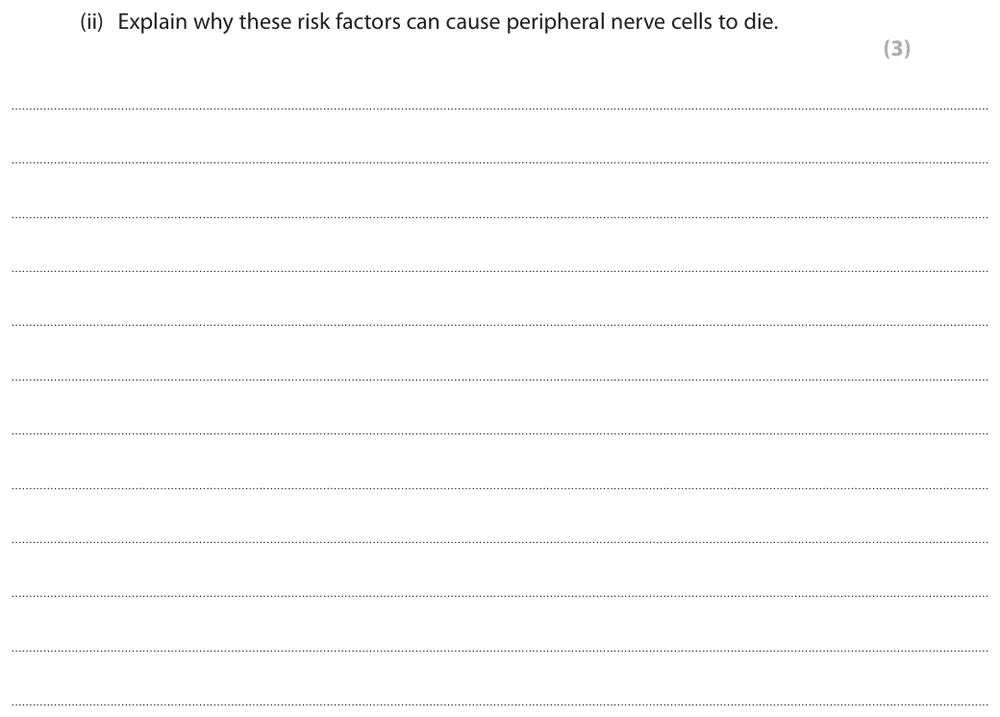
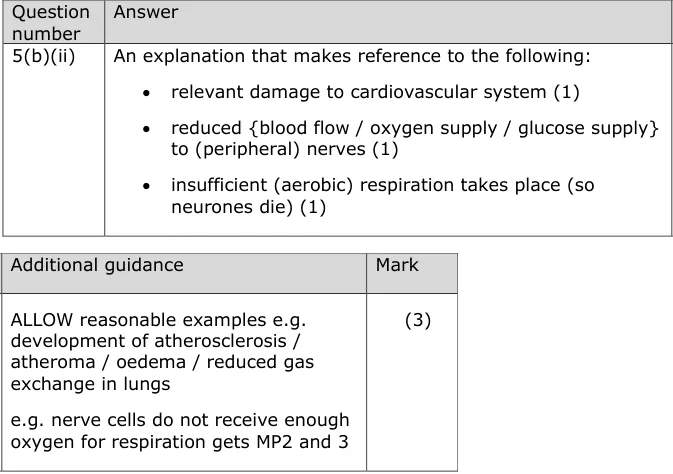
Explain why the risk factors can cause peripheral nerve cells to die.
Information from earlier in this question:
Show the mark scheme
Tap an image to open it full size.
From the examiners' report: Answered well by many. For the first mark, describe damage to the cardiovascular system that directly reduces blood flow, such as atherosclerosis.
Analysing health and mortality data (1.8)
Question 3
AS Paper 1 · June 2024 · Q7(b)(i) · 2 marks
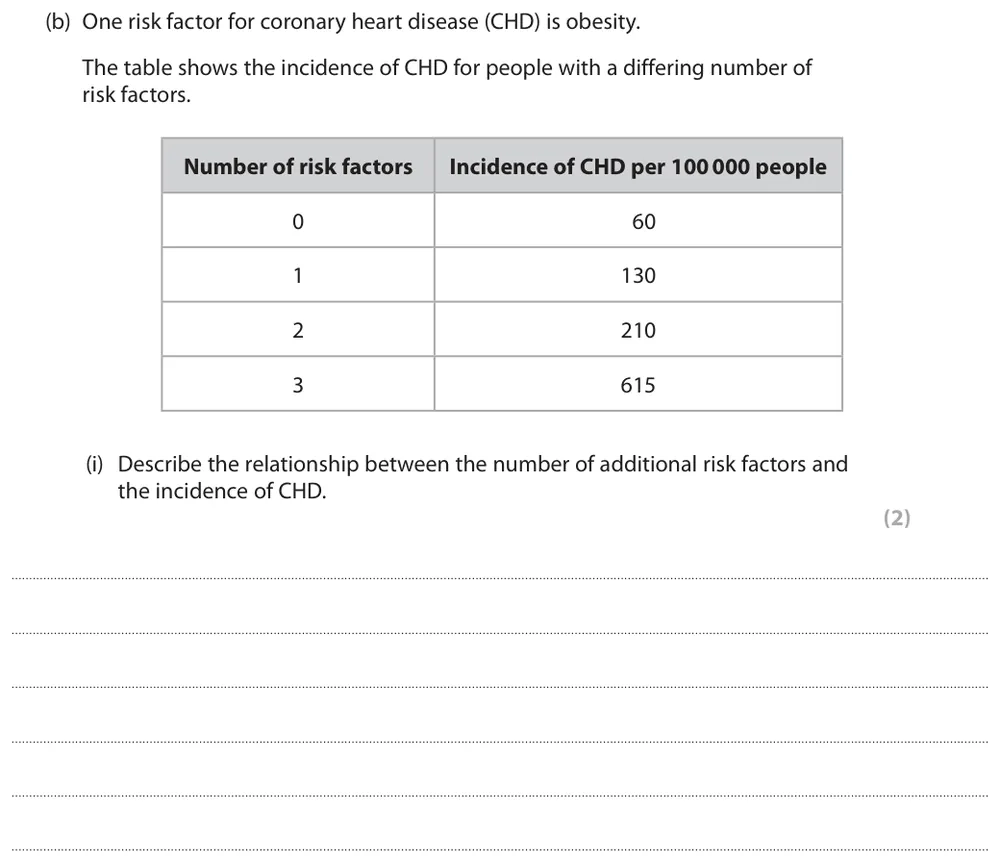
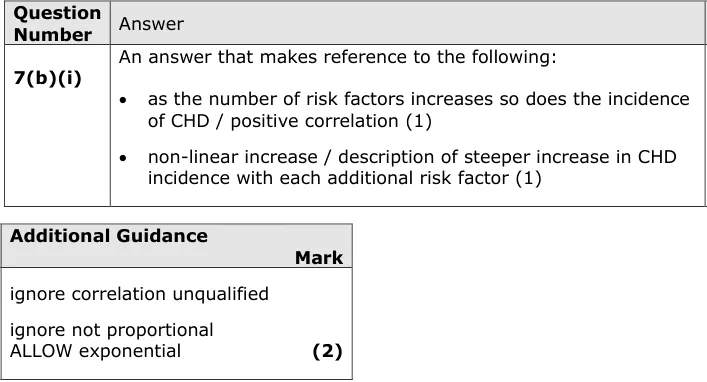
Describe the relationship between the number of risk factors and the incidence of CHD.
Show the mark scheme
Tap an image to open it full size.
From the examiners' report: Nearly all described the positive correlation, but fewer went on to describe the non-linear increase. Look at the number of marks and tailor your description to it.
Question 4
AS Paper 1 · June 2025 · Q4(c) · 1 mark · Easy
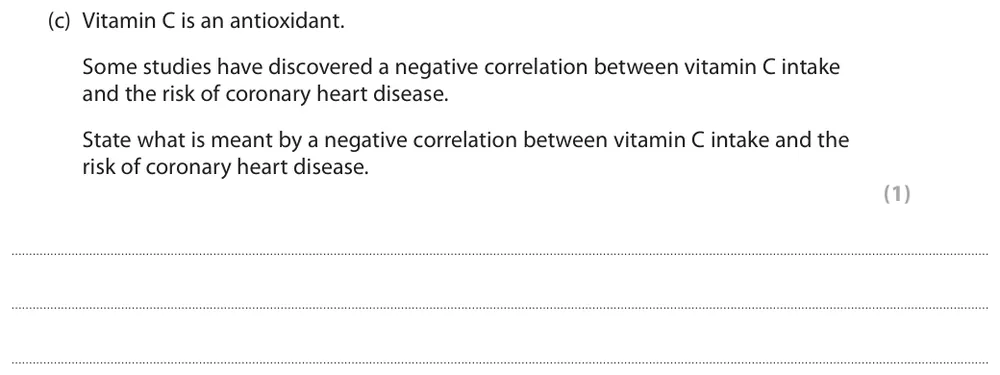
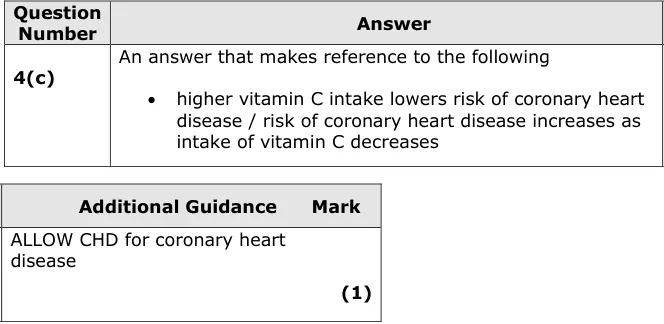
State what is meant by a negative correlation between vitamin C intake and the risk of CHD.
Show the mark scheme
Tap an image to open it full size.
From the examiners' report: Most could do this. Some thought a negative correlation means vitamin C has no effect on the risk.
Question 5
A level Paper 2 · June 2024 · Q5(b)(i) · 1 mark
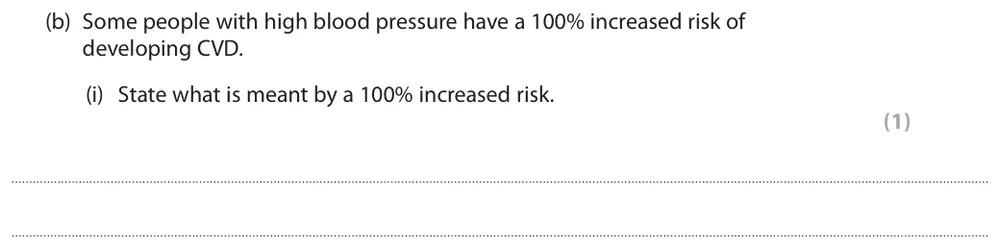
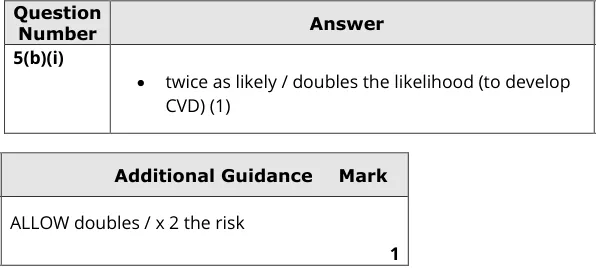
State what is meant by a 100% increased risk.
Show the mark scheme
Tap an image to open it full size.
From the examiners' report: Many did not fully grasp this idea. A 100% increase means twice as likely, or double the risk.
Question 6
A level Paper 1 · June 2017 · Q6(b)(i) · 3 marks
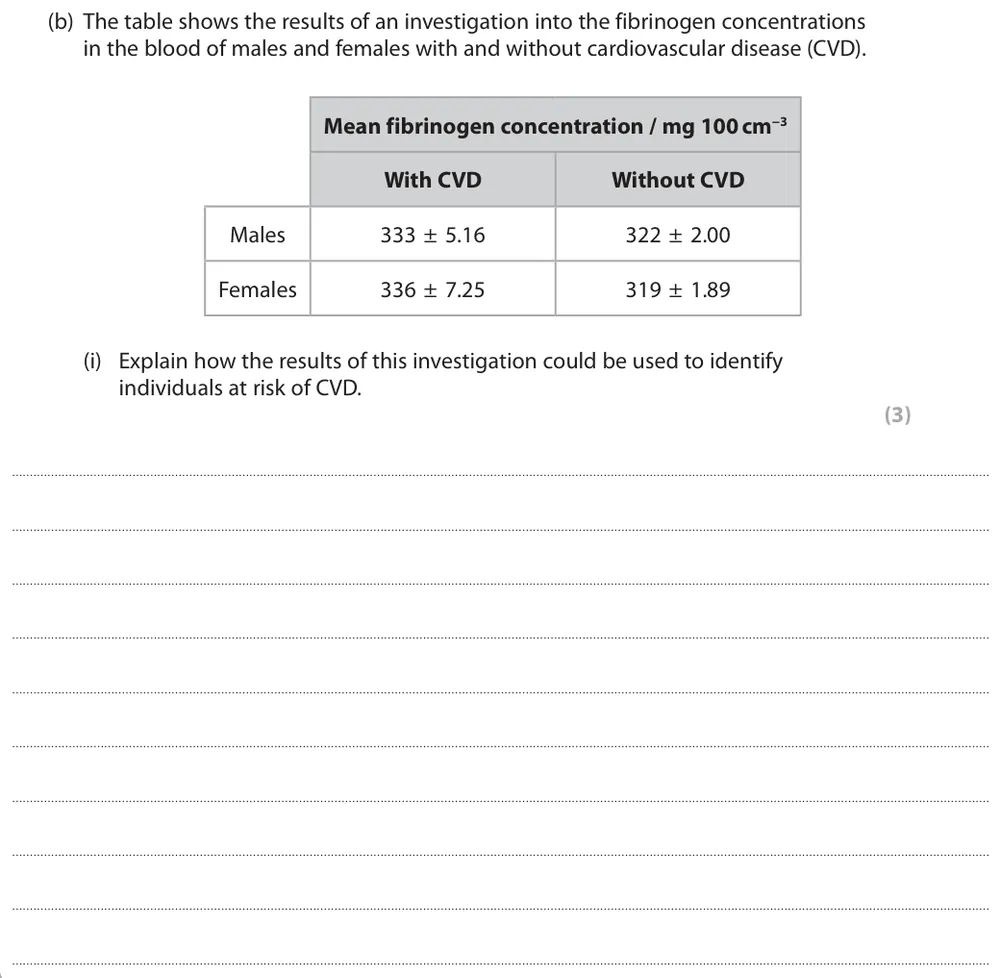
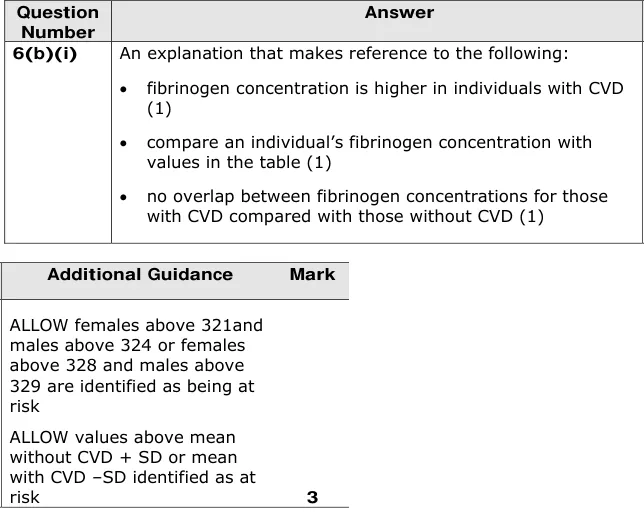
Explain how fibrinogen data could be used to identify individuals at risk of CVD.
Show the mark scheme
Tap an image to open it full size.
From the examiners' report: Most said fibrinogen is higher in people with CVD. For more marks, compare an individual's value with the values in the table, and say that the ranges for people with and without CVD do not overlap.
Question 7
A level Paper 1 · June 2019 · Q8(b) · 4 marks
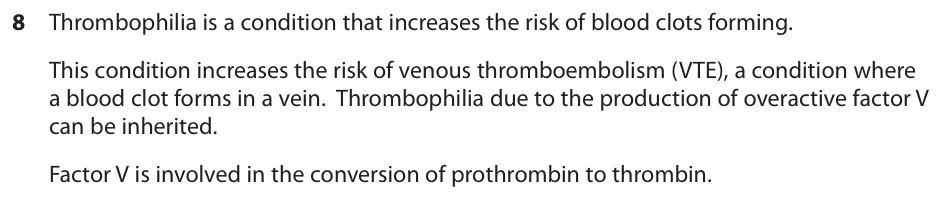
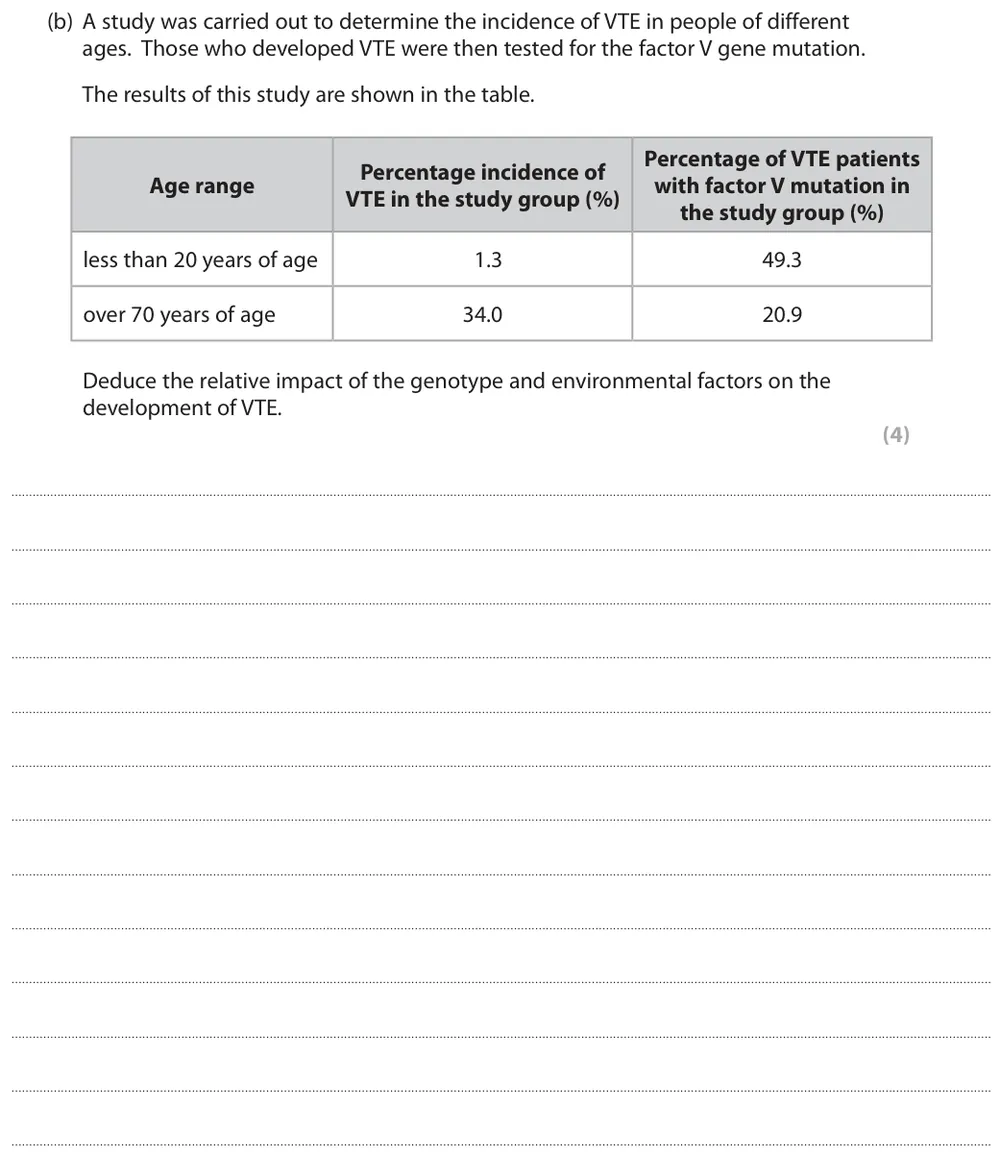
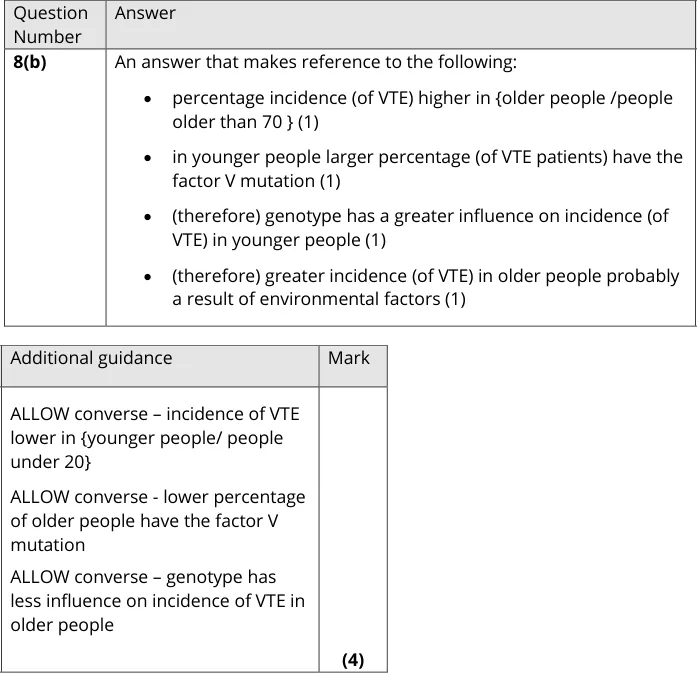
Deduce the relative impact of genotype and environmental factors on the development of VTE.
Information from earlier in this question:
Show the mark scheme
Tap an image to open it full size.
From the examiners' report: Most saw that VTE rises with age and that more young patients had the factor V mutation, but very few went on to compare genotype and environment in each age group. Age itself is not an environmental factor.
Question 8
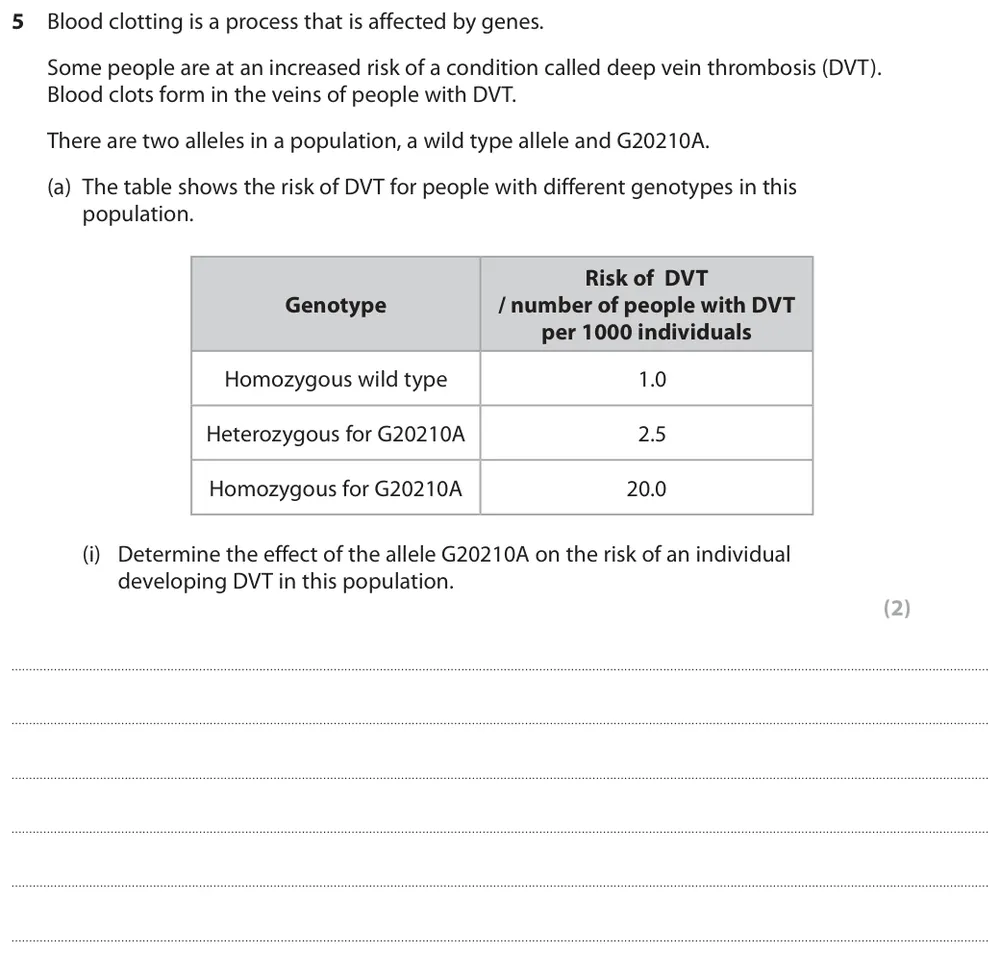
A level Paper 3 · October 2020 · Q5(a)(i) · 2 marks
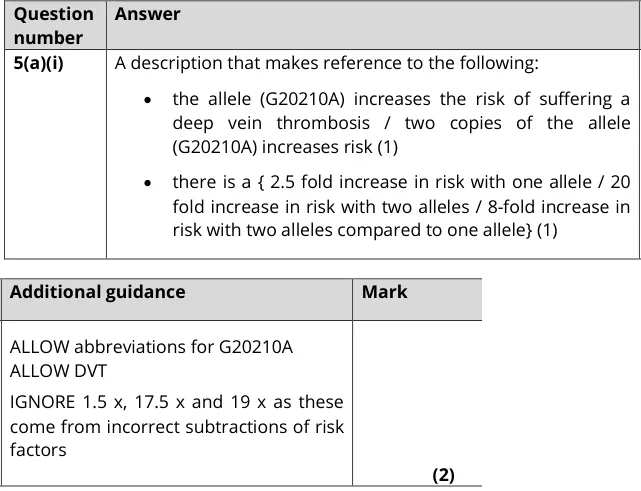
Determine the effect of the G20210A allele on the risk of developing DVT.
Show the mark scheme
Tap an image to open it full size.
From the examiners' report: 'Determine' needs a quantitative answer, but few quantified the increase. Use how many times greater the risk is; subtracting one risk from another, such as 20 − 1 = 19, is not appropriate.
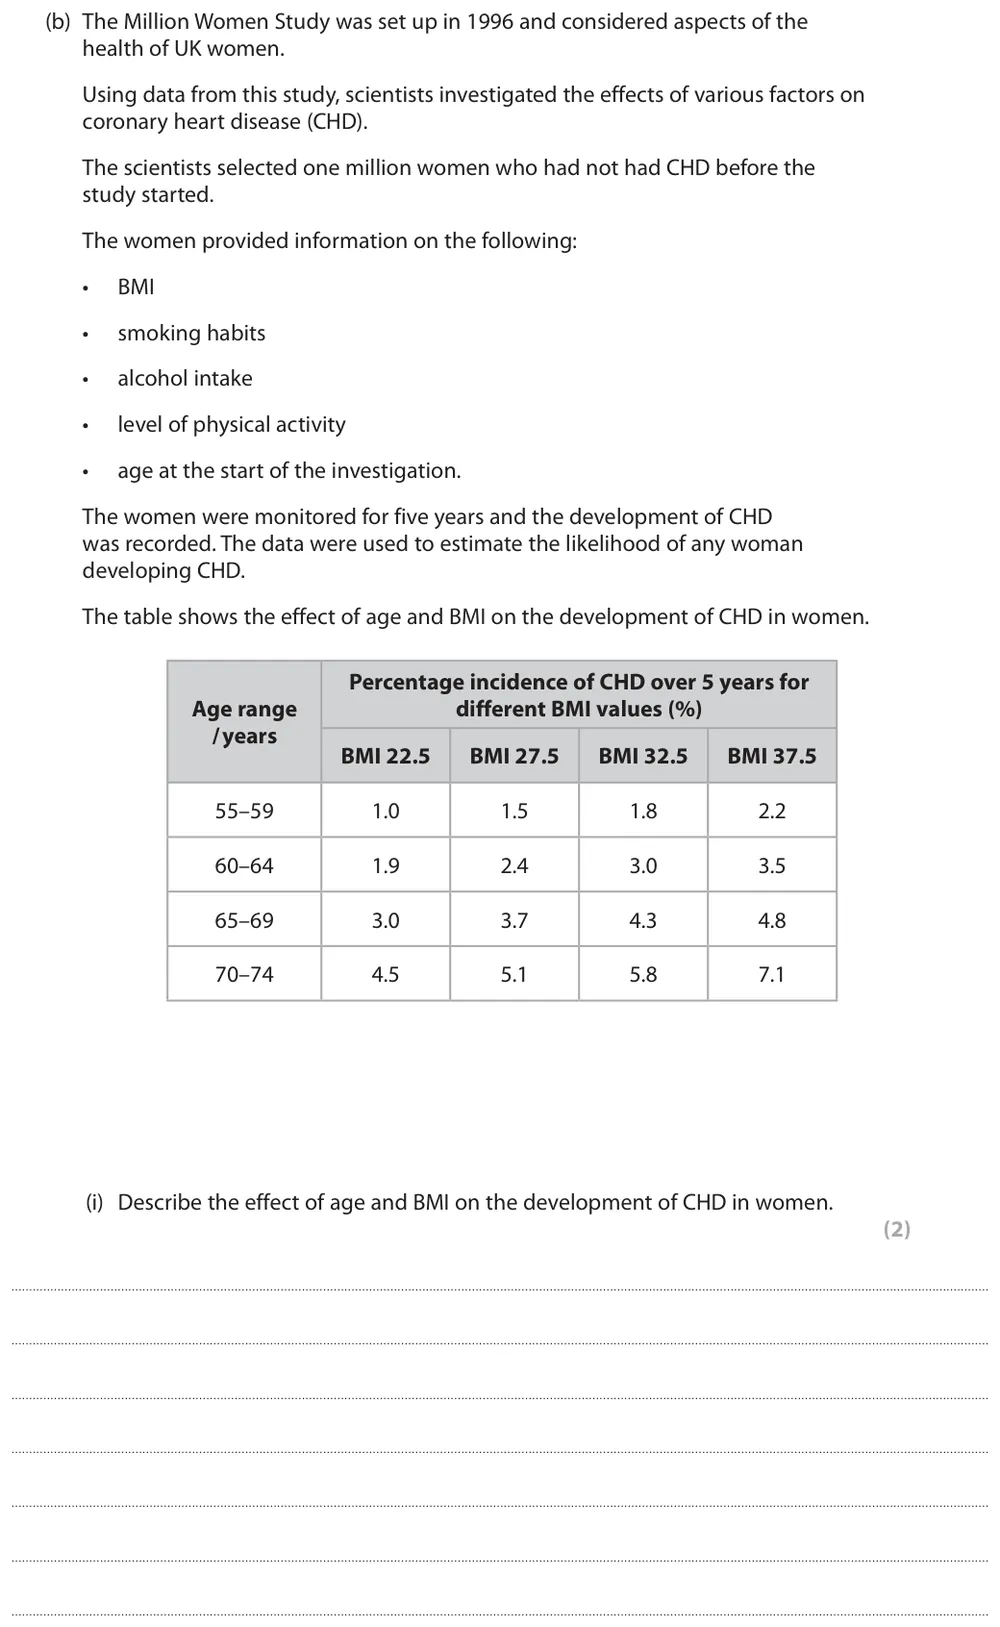
Question 9
A level Paper 2 · June 2023 · Q10(b)(i) · 2 marks
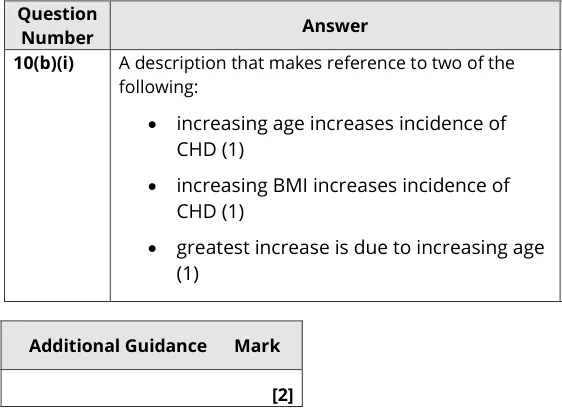
Describe the effect of age and BMI on the development of CHD in women.
Show the mark scheme
Tap an image to open it full size.
From the examiners' report: Most did this clearly. Some described only BMI; say how both age and BMI affect the incidence of CHD, rather than repeating the data.
Question 10
A level Paper 3 · June 2017 · Q3(a)(i) · 5 marks
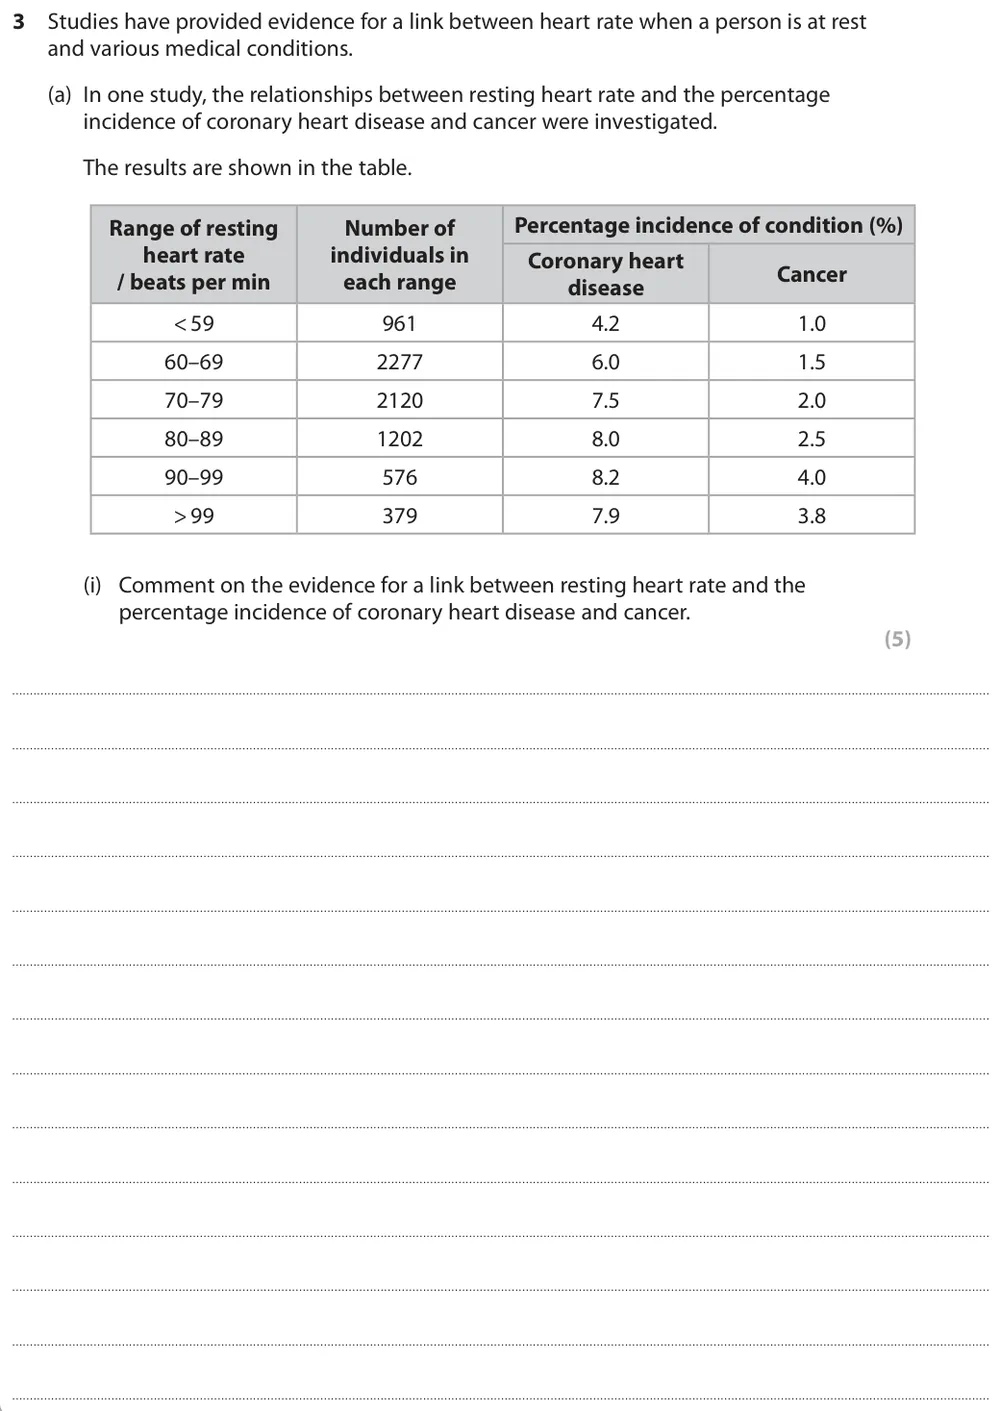
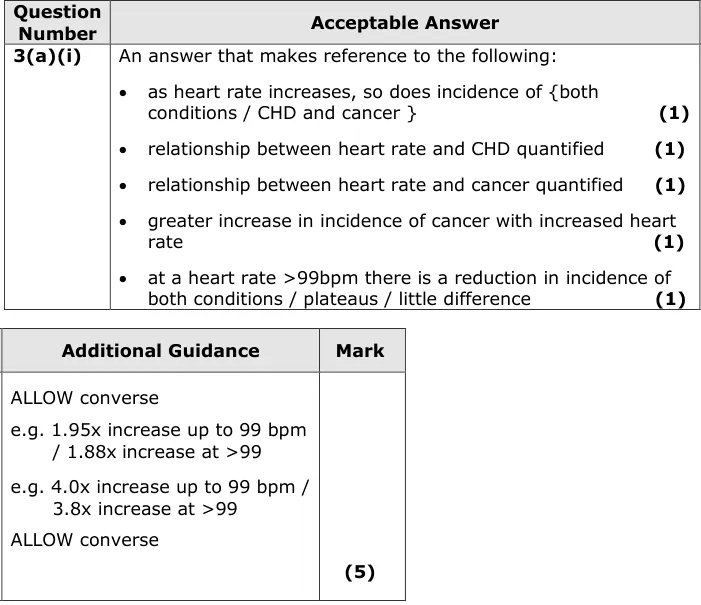
Comment on the evidence for a link between resting heart rate and the incidence of CHD and cancer.
Show the mark scheme
Tap an image to open it full size.
From the examiners' report: 'Comment on' means using the data to form a judgement; most only described the trends. Don't explain causes or discuss sample size. Manipulate the data to show the increase for cancer is greater than for CHD.
Evaluating the design of health studies (1.9)
Question 11
A level Paper 3 · June 2017 · Q3(a)(iii) · 2 marks
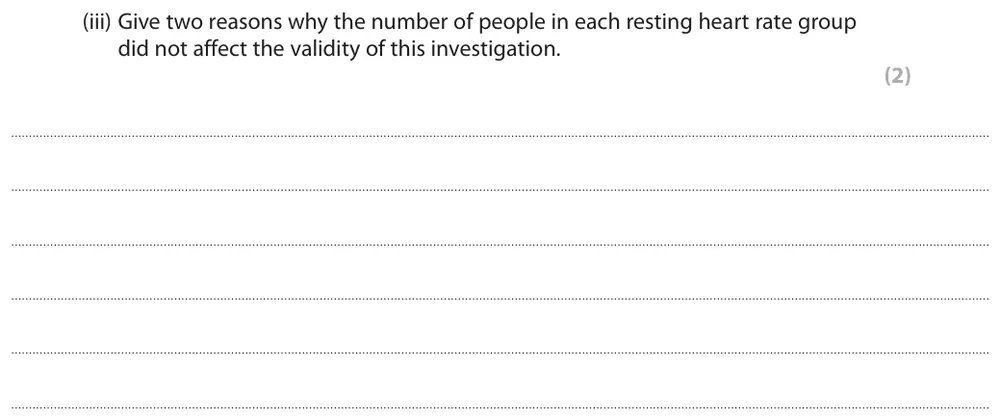
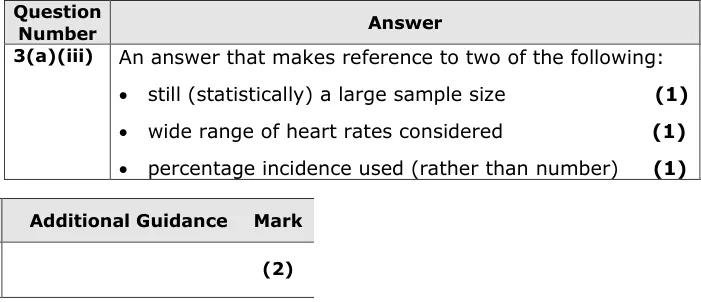
Give two reasons why the different group sizes did not affect the validity of the investigation.
Show the mark scheme
Tap an image to open it full size.
From the examiners' report: Many said percentages were used and that the sample sizes were large. Fewer mentioned the wide range of heart rates.
Question 12
AS Paper 1 · June 2018 · Q7(b) · 3 marks
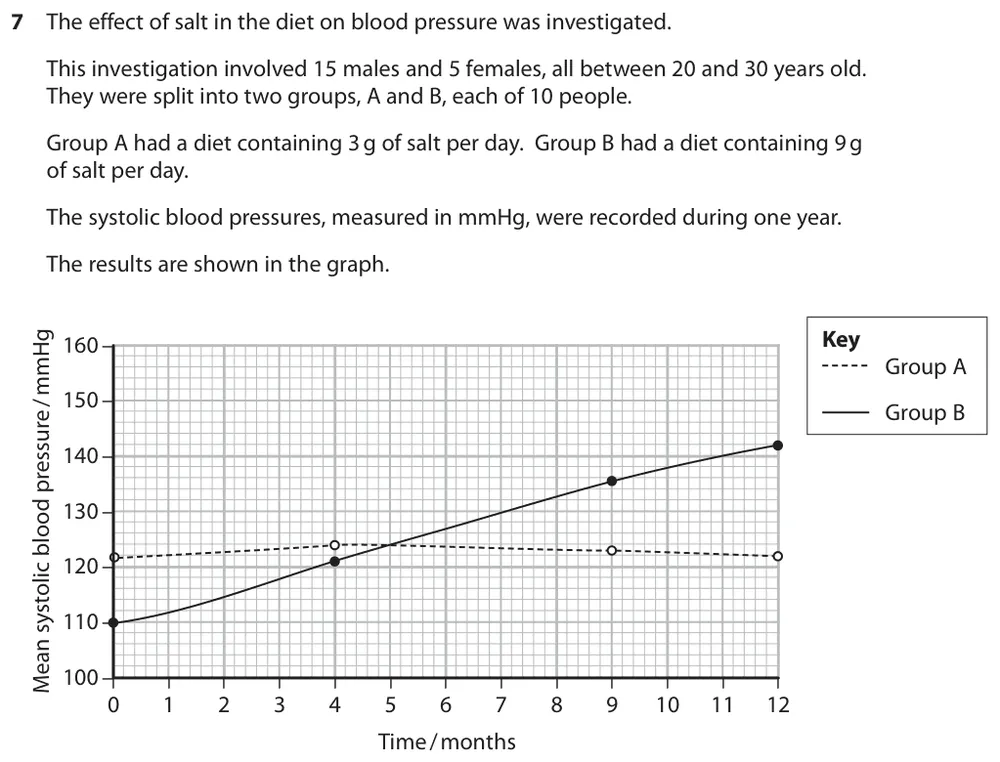
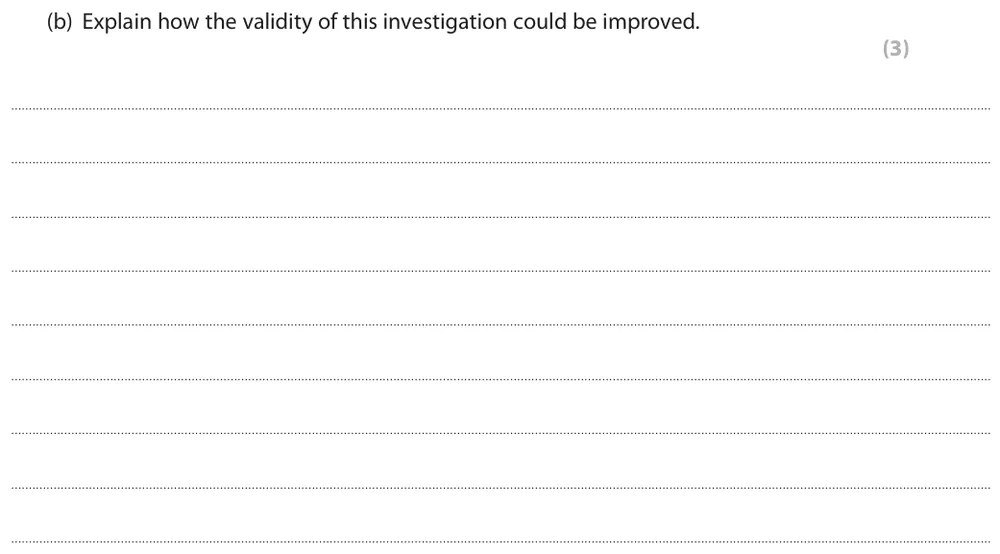
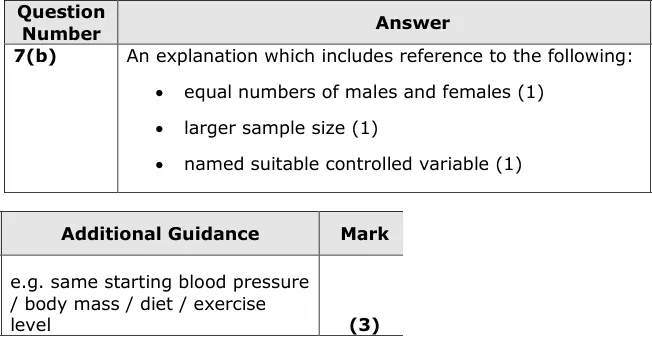
Explain how the validity of a salt and blood pressure investigation could be improved.
Information from earlier in this question:
Show the mark scheme
Tap an image to open it full size.
From the examiners' report: Refer back to this investigation: equal numbers of males and females and a larger sample were the commonest marks. Improvements for a different investigation did not score. About 10% gained full marks.
Question 13
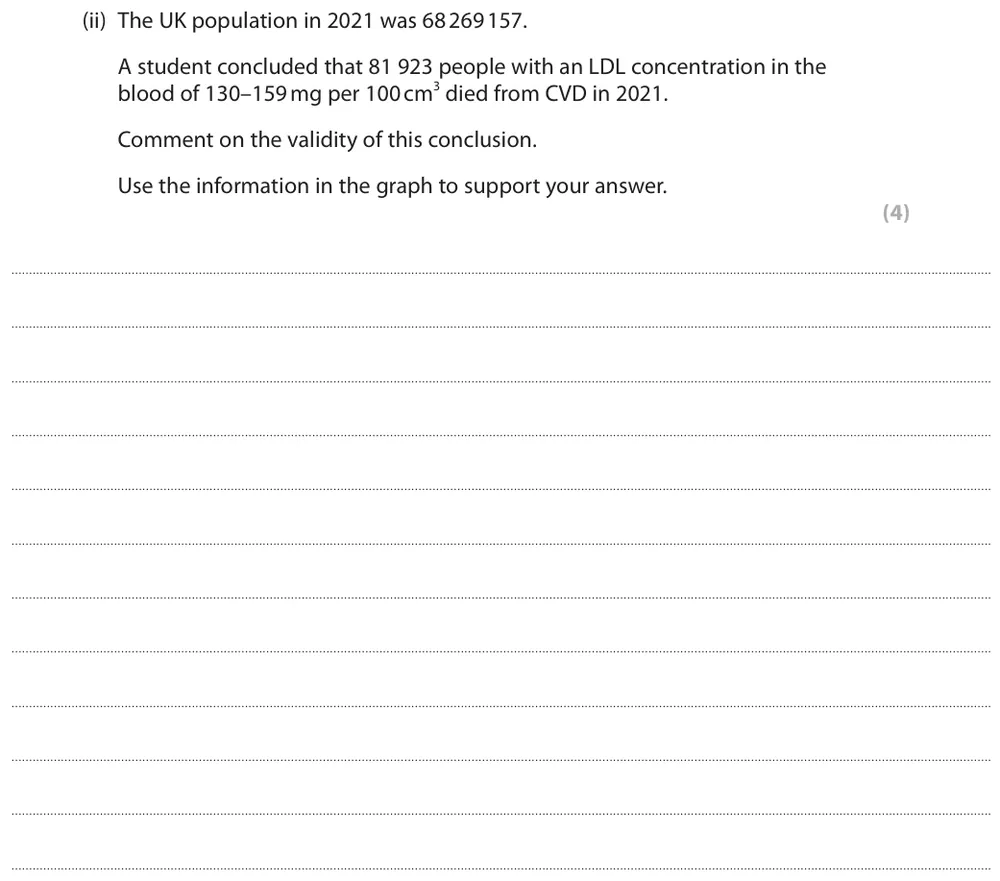
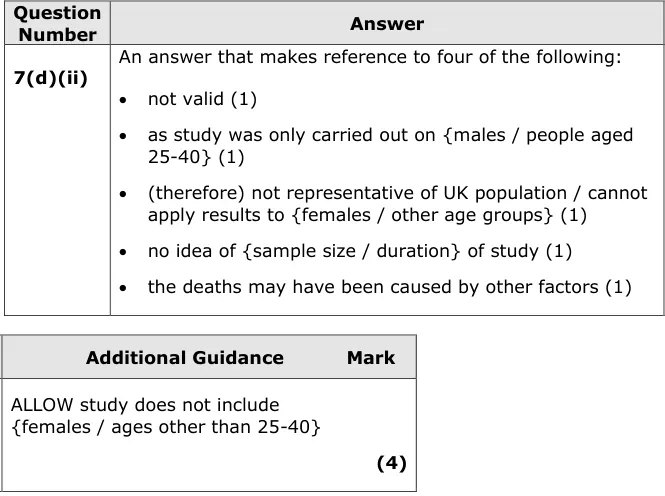
AS Paper 1 · June 2023 · Q7(d)(ii) · 4 marks
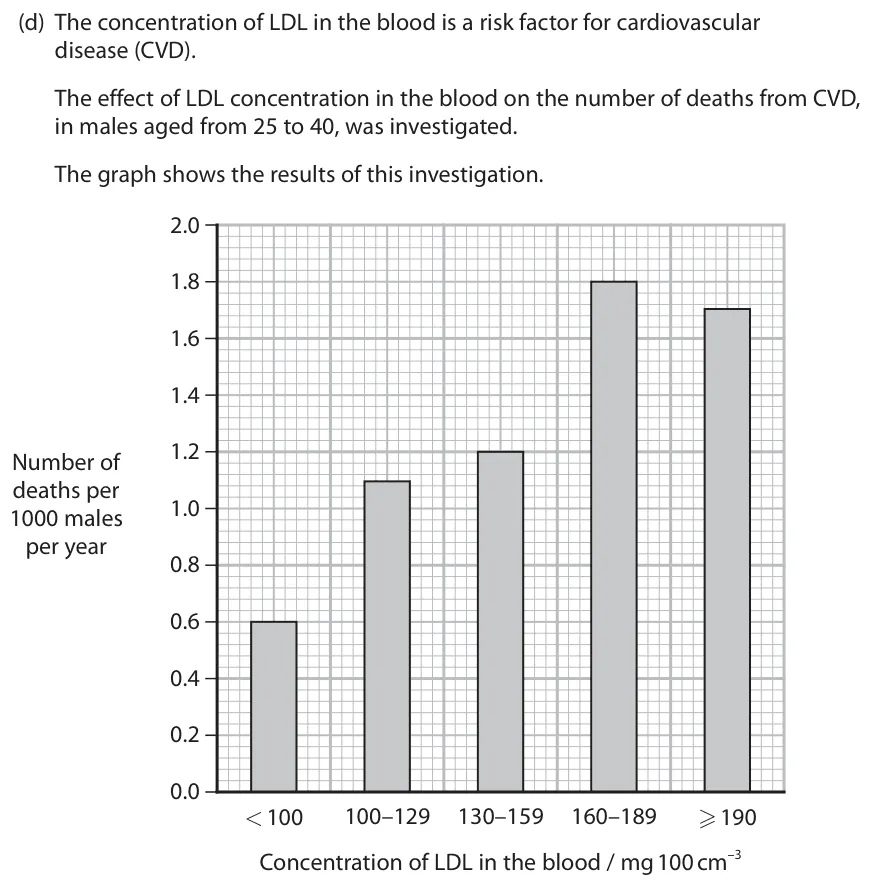
Comment on the validity of a student's conclusion about LDL and deaths from CVD in the UK.
Information from earlier in this question:
Show the mark scheme
Tap an image to open it full size.
From the examiners' report: Most saw the conclusion is not valid because the study only used males aged 25 to 40, so it does not represent the UK population. The best answers added that the deaths could have had other causes.
Perceived and actual risk (1.10)
Question 14
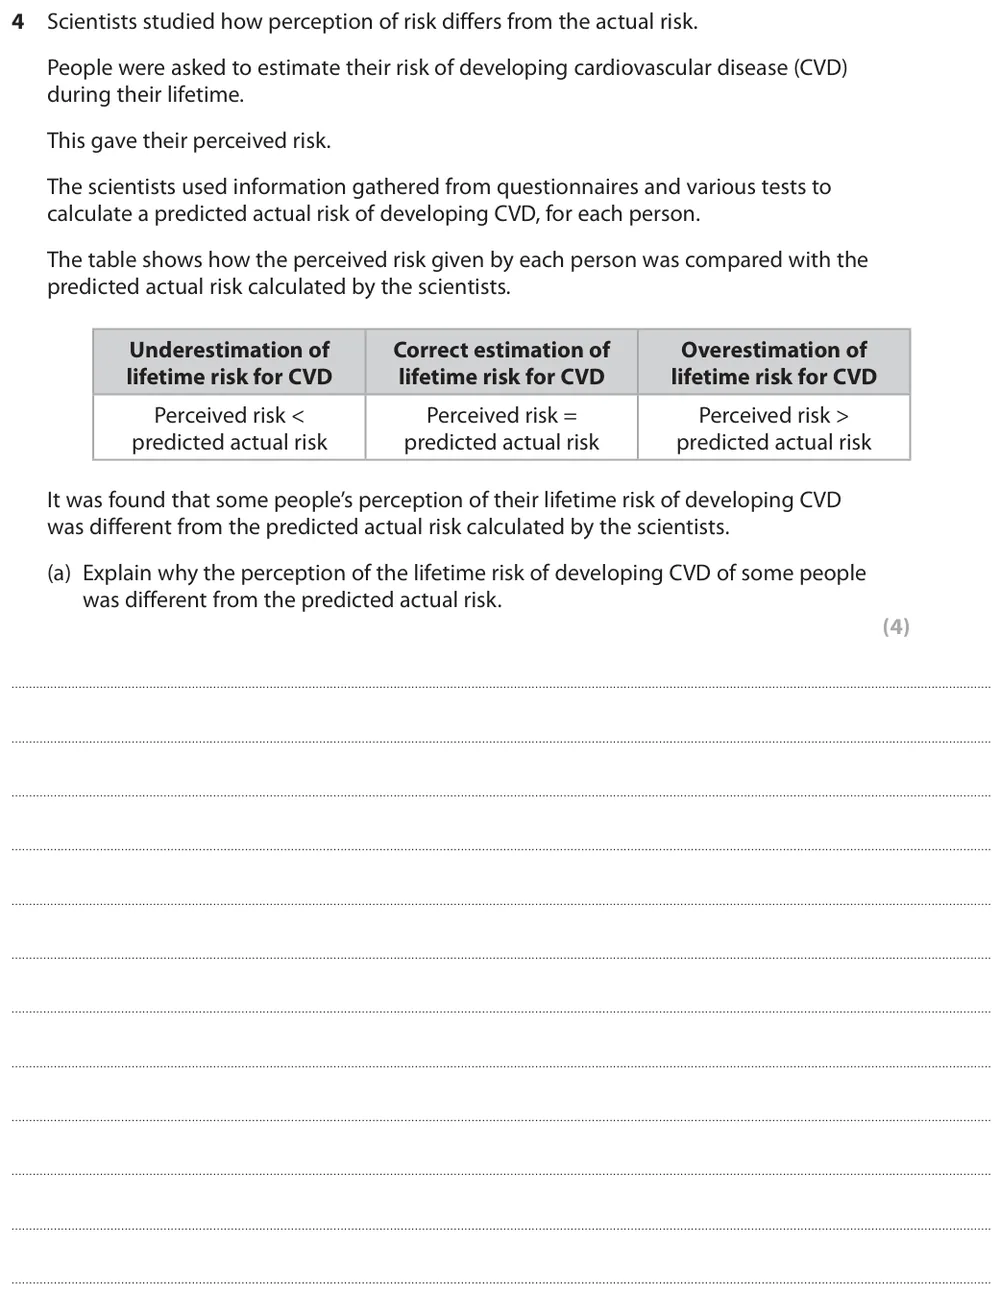
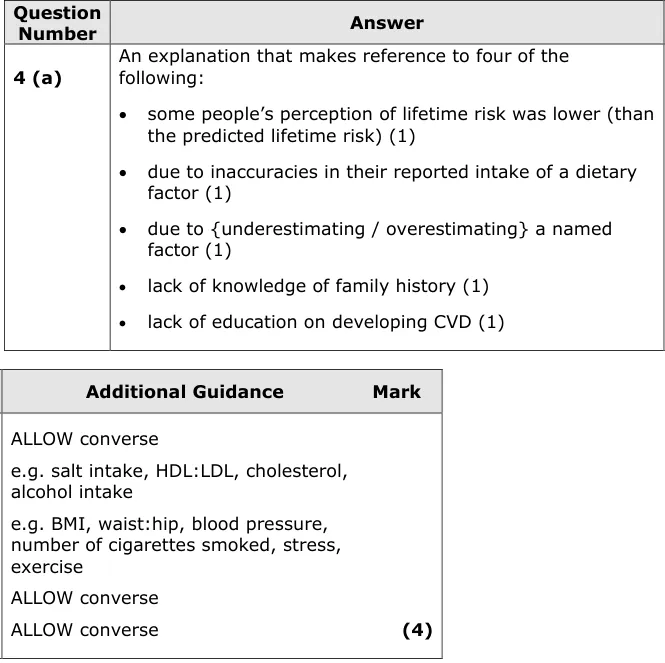
AS Paper 1 · November 2021 · Q4(a) · 4 marks
Explain why people's perceived lifetime risk of CVD differed from the predicted actual risk.
Show the mark scheme
Tap an image to open it full size.
From the examiners' report: Many described how perceived risk differed instead of explaining why. 'Lack of knowledge' alone was not enough: say which risk factors people underestimate or overestimate.
Energy imbalance and obesity (1.11 ii)
Question 15
AS Paper 1 · June 2019 · Q2(b) · 3 marks
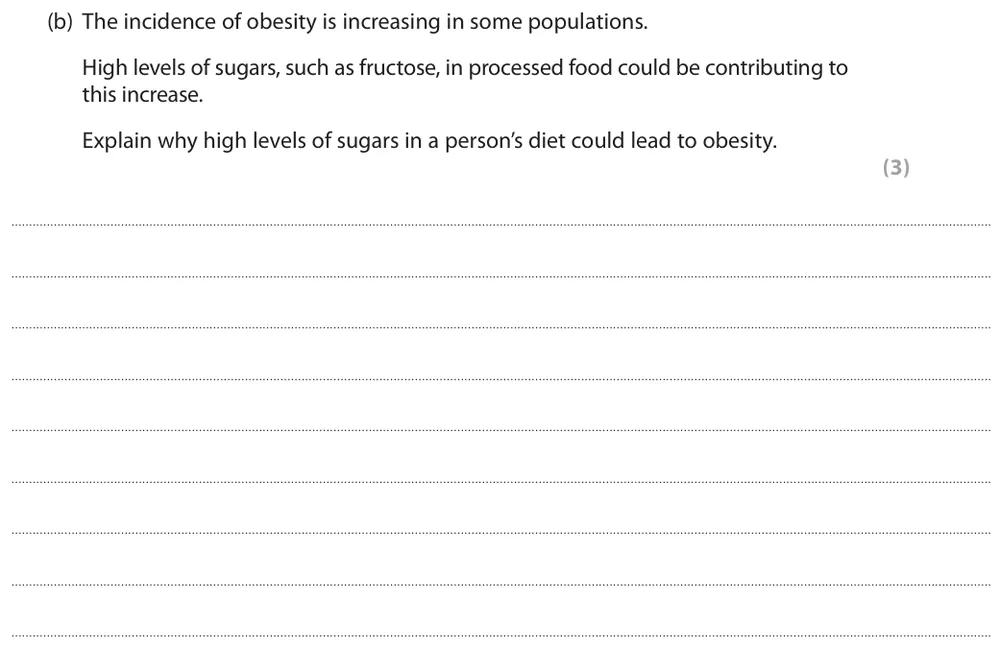
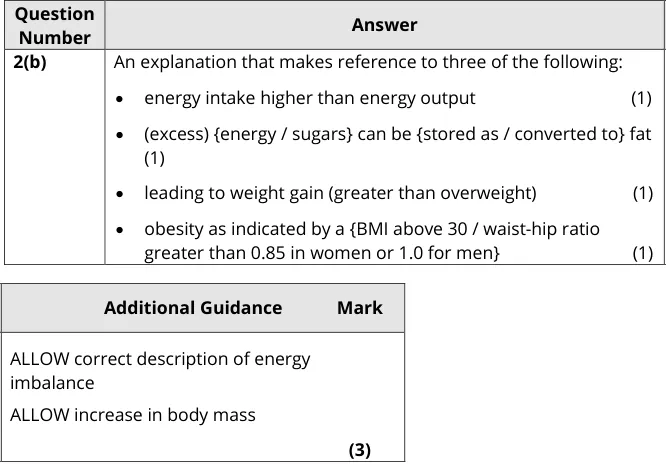
Explain why high levels of sugars in a person's diet could lead to obesity.
Show the mark scheme
Tap an image to open it full size.
From the examiners' report: Saying excess sugar is stored as fat was not enough, and many descriptions of energy imbalance were too vague. Link energy intake above energy output to weight gain and obesity; the best answers gave a BMI above 30.
Question 16
AS Paper 1 · June 2022 · Q3(c)(ii) · 2 marks
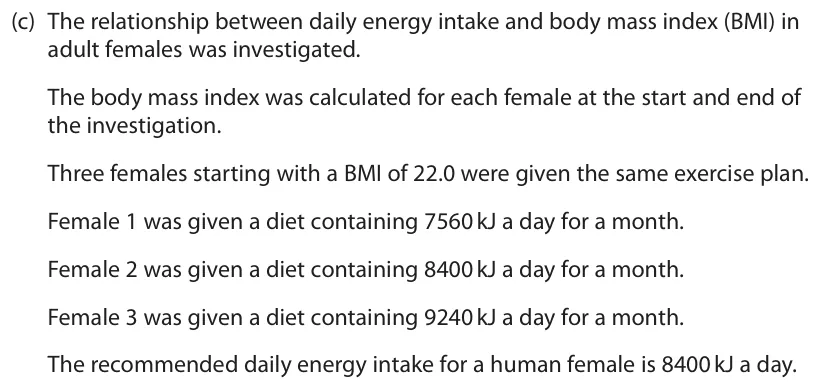
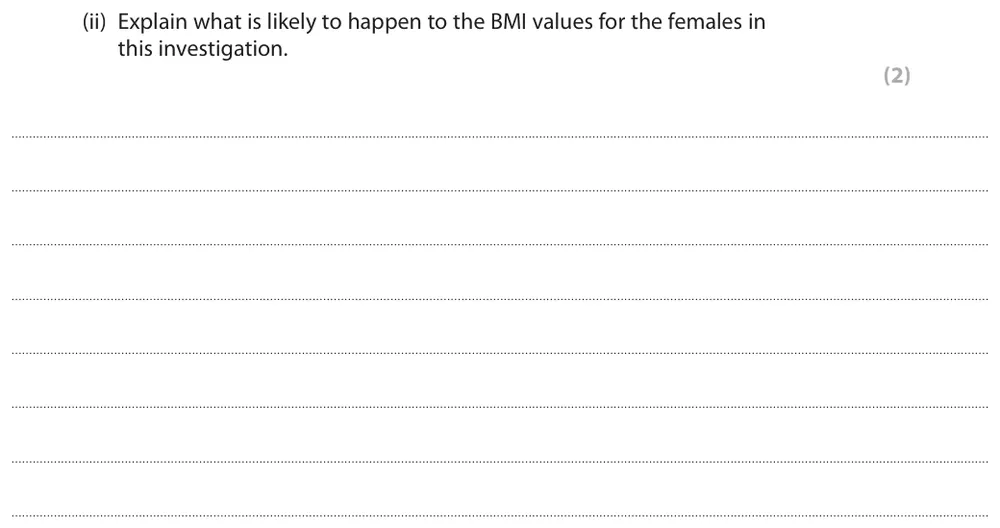
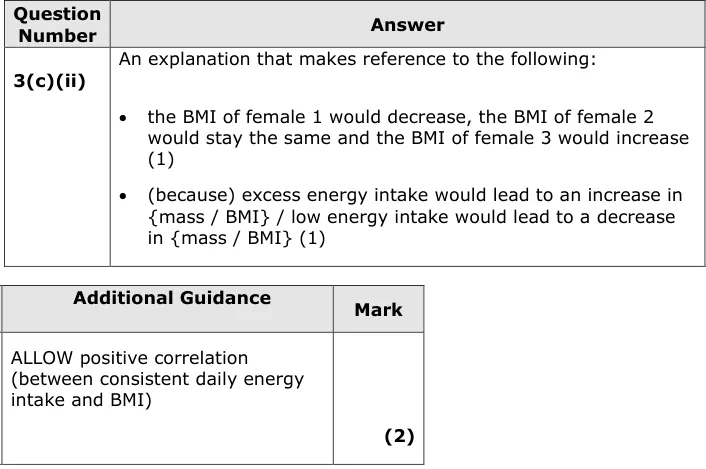
Explain what is likely to happen to the BMI values of three females.
Information from earlier in this question:
Show the mark scheme
Tap an image to open it full size.
From the examiners' report: The best answers gave the effect on each female's BMI and explained it using the differences in energy intake.
Blood cholesterol, HDLs and LDLs (1.15 i)
Question 17
AS Paper 1 · June 2016 · Q6(b) · 4 marks
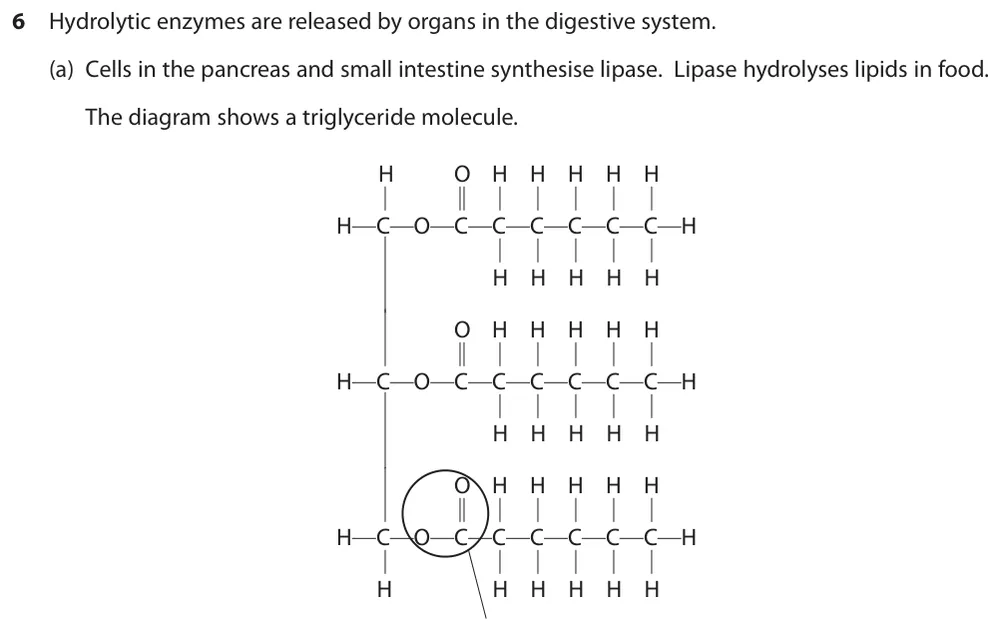
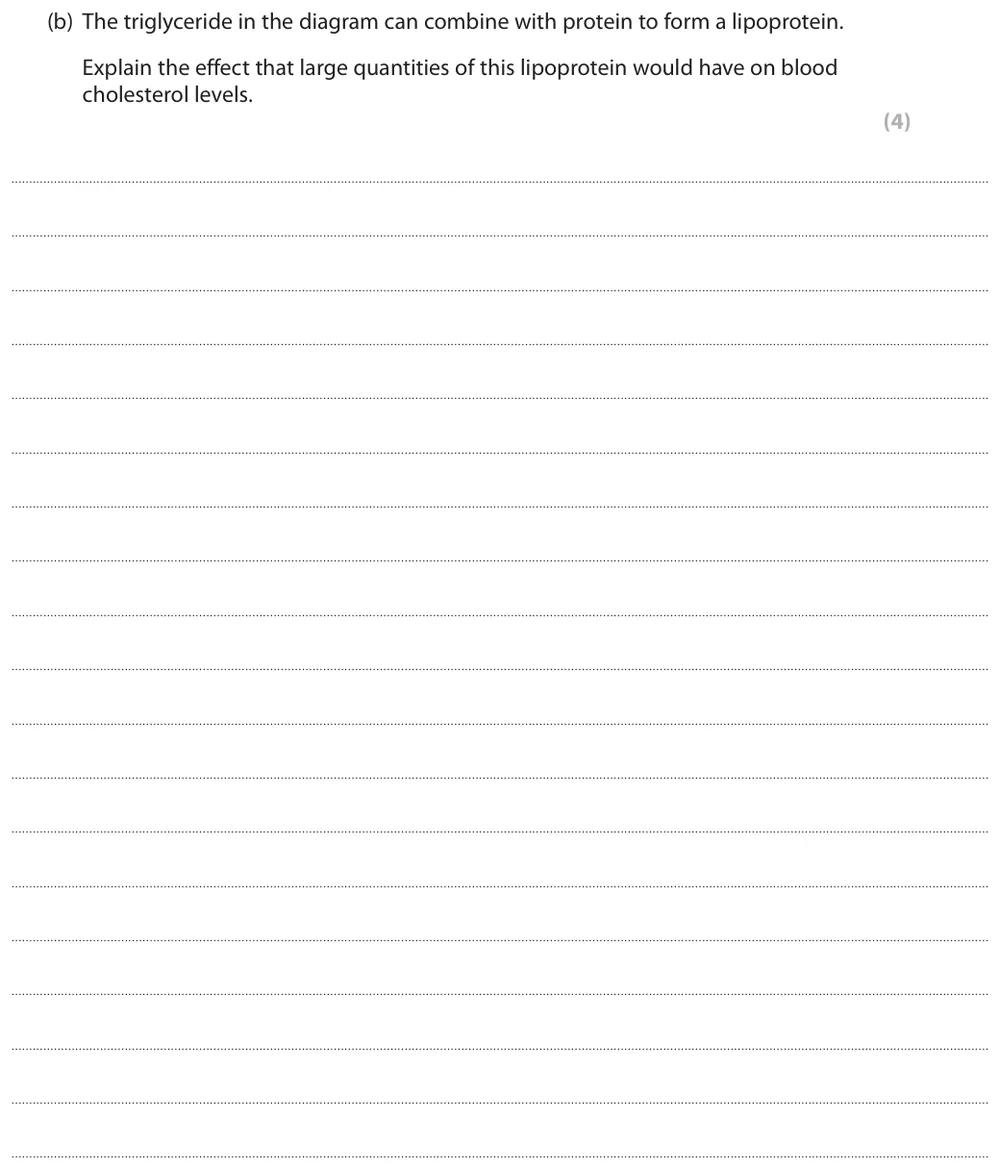
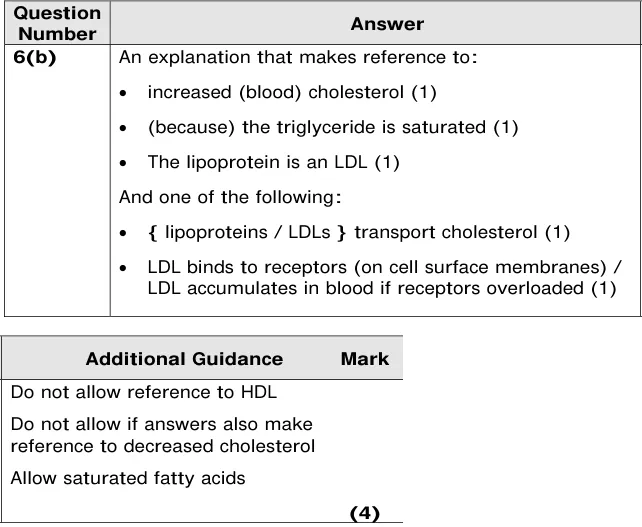
Explain the effect of large quantities of a lipoprotein made from this triglyceride on blood cholesterol.
Information from earlier in this question:
Show the mark scheme
Tap an image to open it full size.
From the examiners' report: Many did not use the diagram from (a). The triglyceride is saturated, so the lipoprotein is an LDL and blood cholesterol rises. General accounts of HDLs and LDLs scored only 1 mark.
Question 18
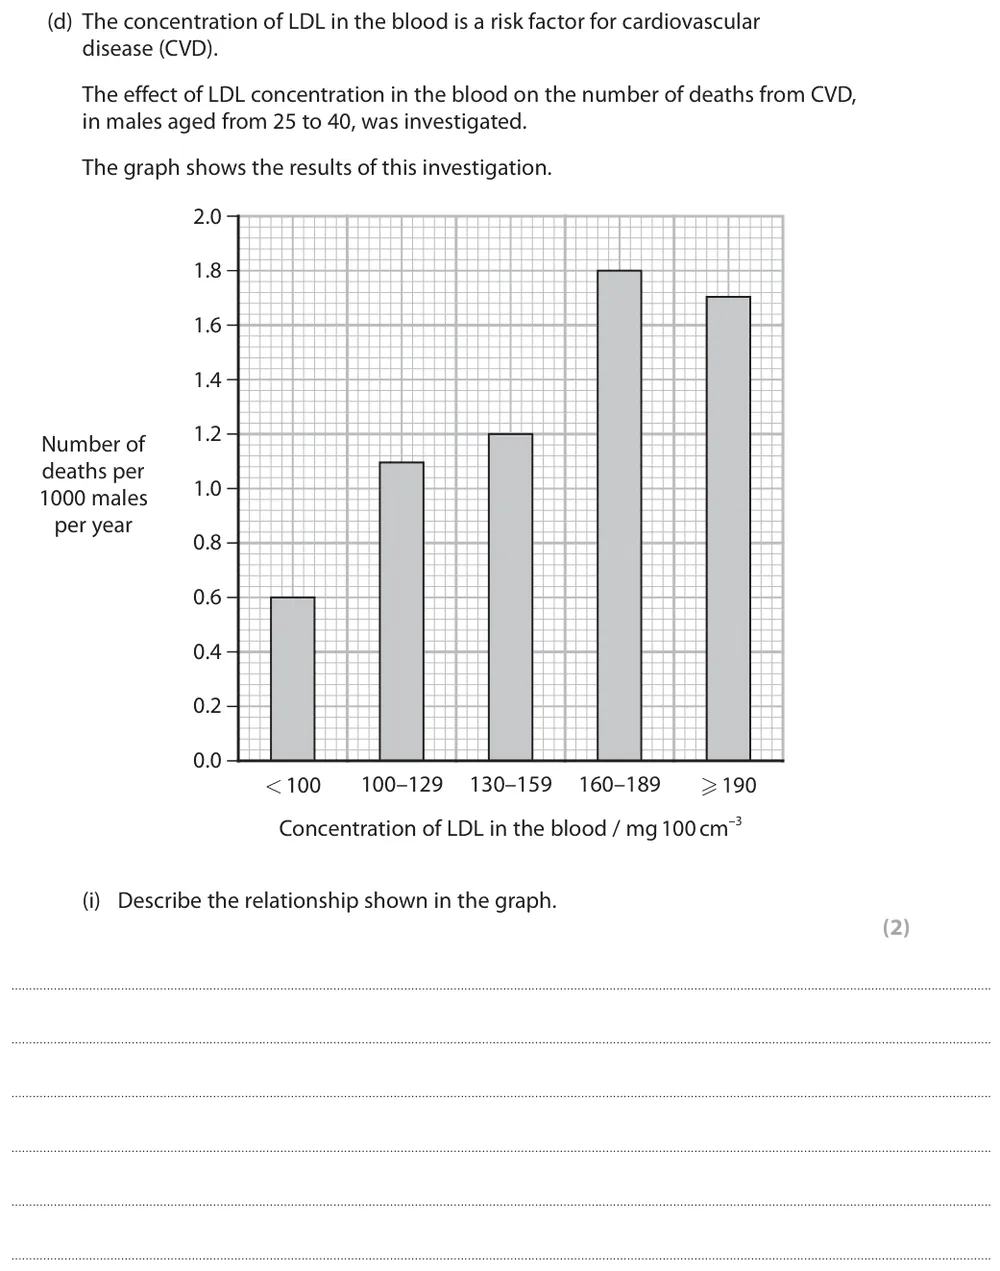
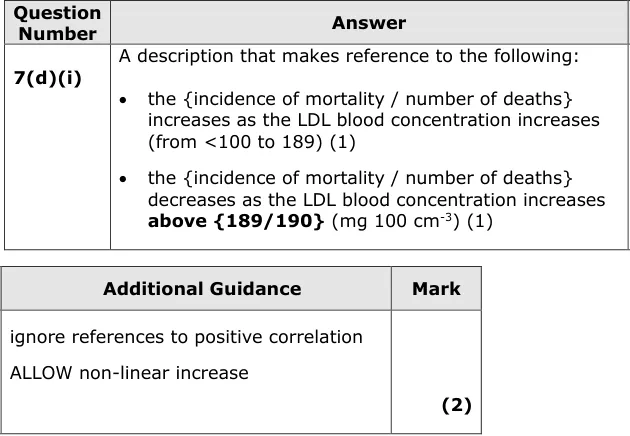
AS Paper 1 · June 2023 · Q7(d)(i) · 2 marks
Describe the relationship between LDL concentration and deaths from CVD.
Show the mark scheme
Tap an image to open it full size.
From the examiners' report: Nearly all described the rise in deaths as LDL concentration increases; fewer described the fall at 190 mg per 100 cm³ and above.
Obesity indicators and reducing risk (1.16)
Question 19
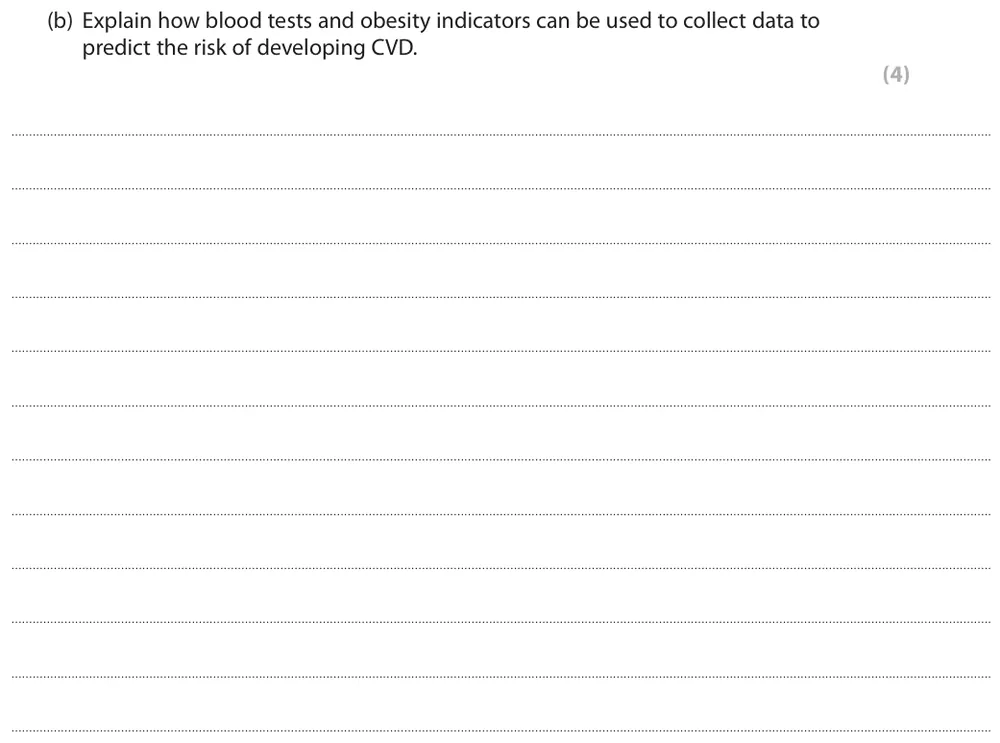
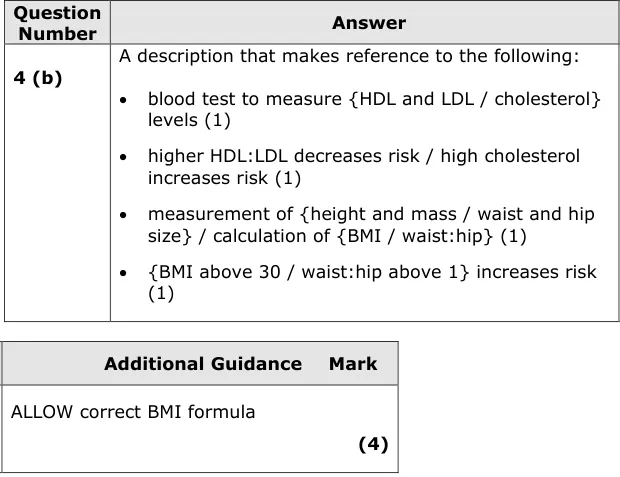
AS Paper 1 · November 2021 · Q4(b) · 4 marks
Explain how blood tests and obesity indicators can be used to predict the risk of CVD.
Show the mark scheme
Tap an image to open it full size.
From the examiners' report: Most said a blood test measures cholesterol, but few said how the result affects risk. Name an obesity indicator such as BMI or waist-to-hip ratio; repeating 'obesity indicator' did not score.
Ethics of using invertebrates (1.17)
Question 20
AS Paper 1 · June 2017 · Q1(a)(iv) · 1 mark · Hard
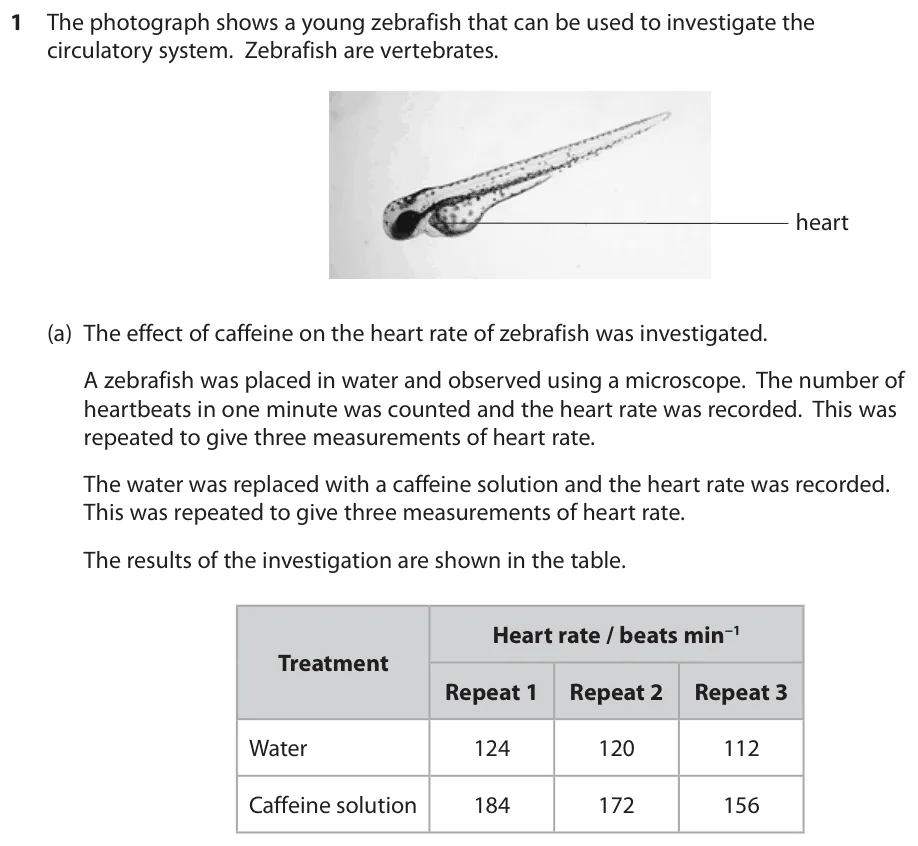
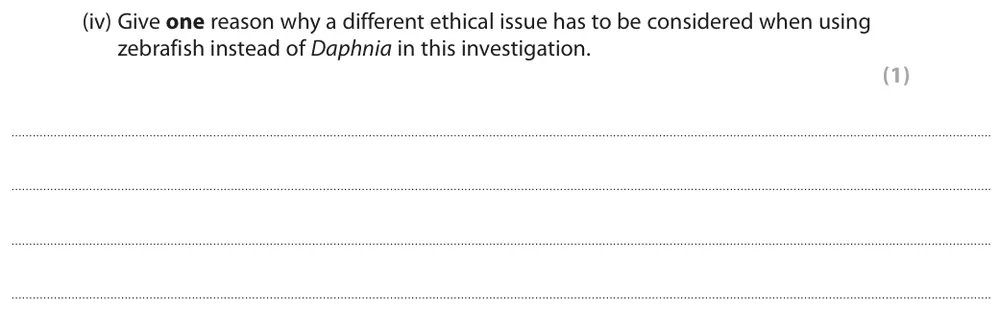
Give a reason why a different ethical issue applies when using zebrafish instead of Daphnia.
Information from earlier in this question:
Show the mark scheme

Tap an image to open it full size.
From the examiners' report: Surprisingly poorly answered. Many missed that zebrafish are vertebrates, despite the diagram's labels, or did not say why that matters. 'Daphnia are bred as fish food' or 'are more abundant' did not score.
Where students lose marks (from Pearson examiners' reports and mark schemes)
Each point below comes from the examiners' reports and mark schemes, and is followed by wording that gained marks.
Fats is too vague. Some lost marks by writing 'high intake of fats' without saying which.
✔ Gains credit: 'High intake of cholesterol or saturated fat; high LDLs are linked to atheroma or plaque formation.'
100% more means double. Many did not grasp what a 100% increased risk means.
✔ Gains credit: 'Twice as likely to develop CVD.'
Divide risks, don't subtract them. Some subtracted one risk from another, such as 20 − 1 = 19, and few quantified the increase at all.
✔ Gains credit: 'There is a 2.5-fold increase in risk with one allele and a 20-fold increase in risk with two alleles.'
Age is not an environmental factor. Many gave age as an environmental factor and made general statements about genotype and environment.
✔ Gains credit: 'Genotype has a greater influence on incidence of VTE in younger people; the greater incidence in older people is probably a result of environmental factors.'
Compare the size of each increase. Some cited figures without manipulating them, so missed that the increase for cancer was greater than for CHD.
✔ Gains credit: 'There is a greater increase in incidence of cancer with increased heart rate.'
Stored as fat is only the start. Some just said excess sugars are stored as fat, without linking this to weight gain or obesity.
✔ Gains credit: 'Energy intake is higher than energy output; excess sugars are converted to fat, leading to weight gain and obesity, as shown by a BMI above 30.'
Saturated triglyceride, so LDL. Many did not use the diagram to see that the triglyceride was saturated.
✔ Gains credit: 'The triglyceride is saturated, so the lipoprotein is an LDL, which increases blood cholesterol.'
Vertebrates are more likely to feel pain. Many did not recognise zebrafish as vertebrates, or did not say why this raises a different ethical issue.
✔ Gains credit: 'Zebrafish are vertebrates, therefore they are more likely to feel pain.'
Download the questions
Download the PDF pack (20 questions, mark schemes at the end)
Keep practising
- Heart and Circulation (Topic 1): Edexcel SNAB exam questions by topic
- Atherosclerosis, Blood Clotting and CVD Treatment (Topic 1): Edexcel SNAB exam questions by topic
- Carbohydrates and Lipids (Topic 1): Edexcel SNAB exam questions by topic
- Vitamin C and Membrane Permeability (Core Practicals 2 and 3): Edexcel SNAB core practical questions
- Topic 1 multiple-choice quiz (50 questions, marked as you tap)
- Edexcel SNAB A level Biology resources hub (every topic, practical and paper)
- Caffeine and Daphnia Heart Rate (Core Practical 1): Edexcel SNAB A Level Biology Exam Questions
- Extended Response Questions (Topics 1 and 2): Edexcel SNAB A Level Biology Exam Questions
- Edexcel SNAB A level Biology past papers, mark schemes and examiners' reports
- Edexcel SNAB A level Biology grade boundaries
- Message Tom on WhatsApp about one-to-one Edexcel SNAB tutoring or an Edexcel group class
Questions, mark schemes and examiners' report extracts © Pearson Education Ltd.