

Populations and ecosystems is the largest topic in Component 1. You need population growth curves and carrying capacity, density-dependent and density-independent factors, sampling techniques, energy transfer and productivity (GPP, NPP and R), succession, the carbon and nitrogen cycles, and the human impacts of deforestation, ploughing and eutrophication. Every question on this page is from the A level papers, mostly Component 1, with a few from Component 2 and one AS question.
Recall is usually good: the stages of a growth curve, the bacteria in the nitrogen cycle and the definition of a climax community. Marks are lost when you describe a graph instead of explaining it, use loose words such as bacteria "giving birth", name products when the question asks for processes, or choose a sampling method that doesn't suit the habitat in the question. The examiners' reports keep asking you to apply what you know to the context you're given.
I don't teach the Eduqas specification myself, so for one-to-one help I recommend Sam. He teaches Eduqas A level Biology at a top-rated sixth form college and is very popular with his students. You can ask about lessons with Sam on WhatsApp using the link at the bottom of this page.
What you need from GCSE and Year 12
Each question on this page assumes you're secure on these ideas. If any of them feels shaky, look it up before you start.
- A population is all the organisms of one species living in one place at the same time.
- Producers make food by photosynthesis; consumers get energy by eating other organisms.
- Energy is lost at each step of a food chain, mostly through respiration as heat.
- Decomposers (bacteria and fungi) break down dead material and return nutrients to the soil.
Key terms
These words come up in the questions and mark schemes. Examiners expect you to use them exactly.
- Carrying capacity: the largest population an environment can support over time.
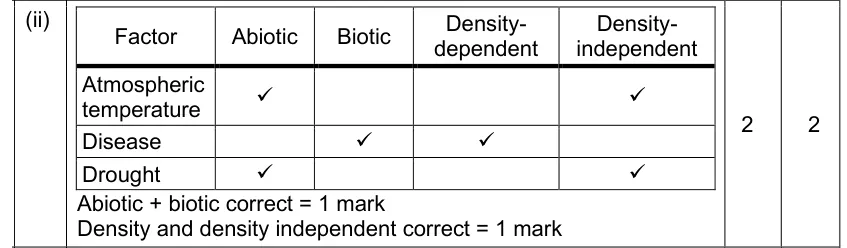
- Density-dependent factor: a factor whose effect gets stronger as population density rises, such as competition, predation or disease.
- Density-independent factor: a factor that affects a population whatever its density, such as drought, temperature or hunting.
- Mark-release-recapture: estimating population size from the proportion of marked animals in a second sample.
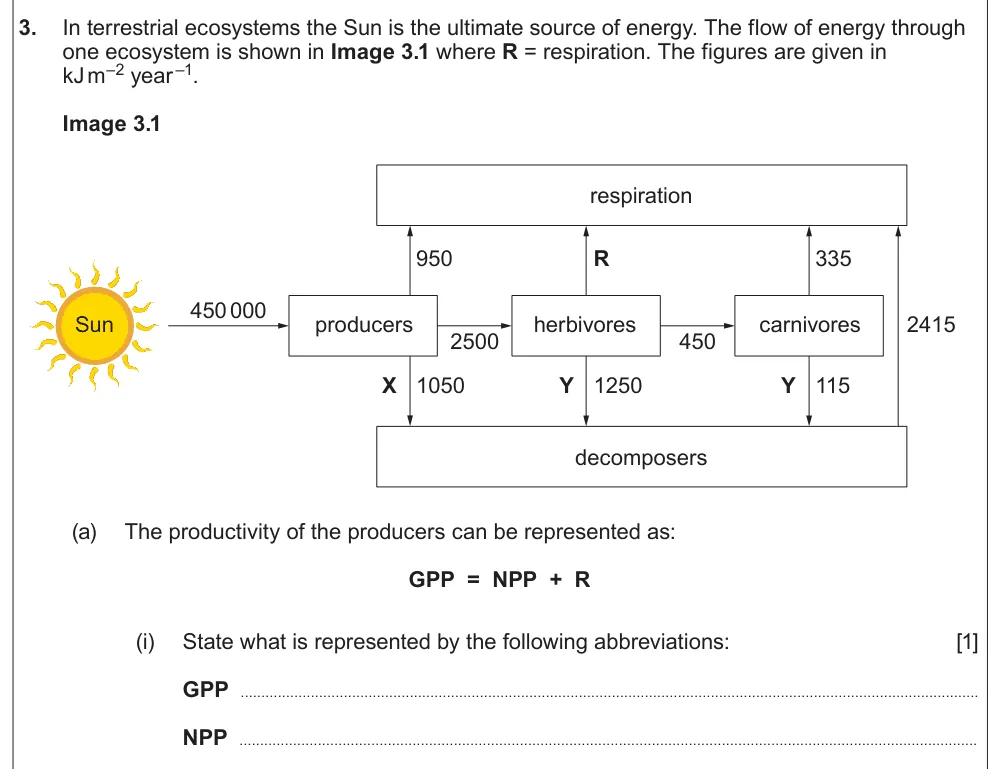
- Gross primary productivity (GPP): the rate at which producers store energy in organic compounds by photosynthesis.
- Net primary productivity (NPP): GPP minus the energy producers lose in respiration (R): the energy available to consumers.
- Climax community: the final, stable stage of succession.
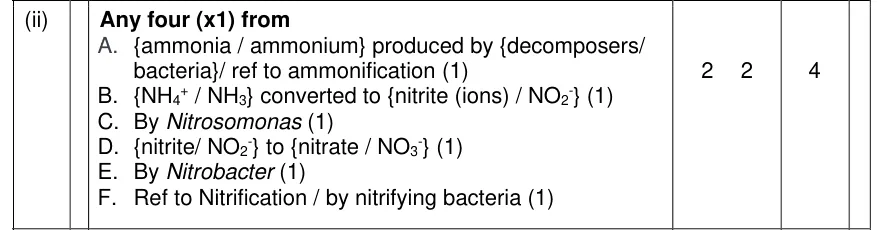
- Nitrification: ammonium to nitrite (Nitrosomonas) and nitrite to nitrate (Nitrobacter), which needs aerobic conditions.
- Eutrophication: nutrient enrichment of water, causing algal blooms, decay and oxygen loss.
What these questions cover (Eduqas 1.5)
The questions test these statements from Component 1 (Energy for Life) of the Eduqas A level Biology specification (A400). Component 1 content is examined in A level Component 1.
- (a) populations and the way in which they grow - a simple quantitative treatment including immigration, emigration, birth and death rates
- (b) graphs showing population growth and factors affecting population growth
- (c) the regulation of populations by density dependent and density independent factors
- (d) the sampling techniques used to assess abundance and distribution of organisms in a habitat
- (h) the transfer of biomass from plants to animals including trophic levels, efficiency of transfer
- (i) the principles of succession as illustrated by the colonisation of bare rock to form woodland
- (j) the terms primary and secondary succession, pioneers, sere and climax community
- (k) the importance of organic breakdown in recycling nutrients
- (l) the carbon cycle
- (m) the effects of human activities on the carbon cycle including that climate change affects the distribution of species and is a possible cause of extinction
- (n) the role of bacteria in the nitrogen cycle and the significance of nitrates in producing proteins and nucleic acids
- (o) the importance of human activities such as ploughing and drainage in producing the aerobic conditions needed for nitrification and the economic importance of the nitrogen
- (p) the process of eutrophication and algal blooms and that drainage has adverse effects on habitats
How to use this page
Write your answer on paper before you open the mark scheme. Allow about 1.2 minutes per mark: the 27 questions are worth 69 marks, so about 83 minutes in total. Then mark your answer strictly against the mark scheme and read the examiners' tip underneath it. If you'd rather print the questions, download the PDF pack.
Population growth
Question 1
A level Component 1 · June 2024 · Q2(a)(iii) · 1 mark
Explain what is meant by exponential growth.

Show the mark scheme

Tap an image to open it full size.
Question 2
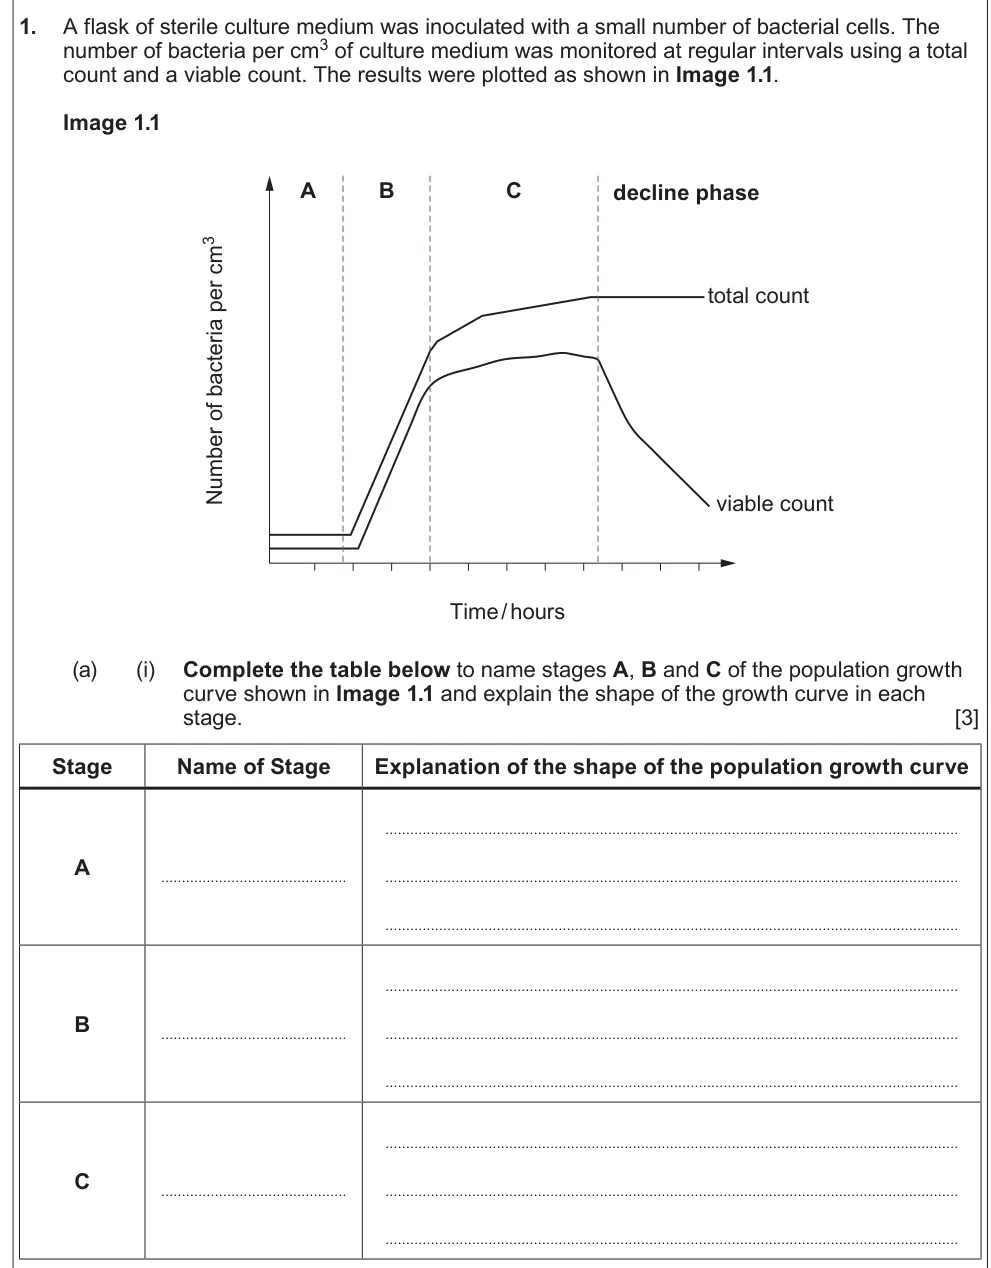
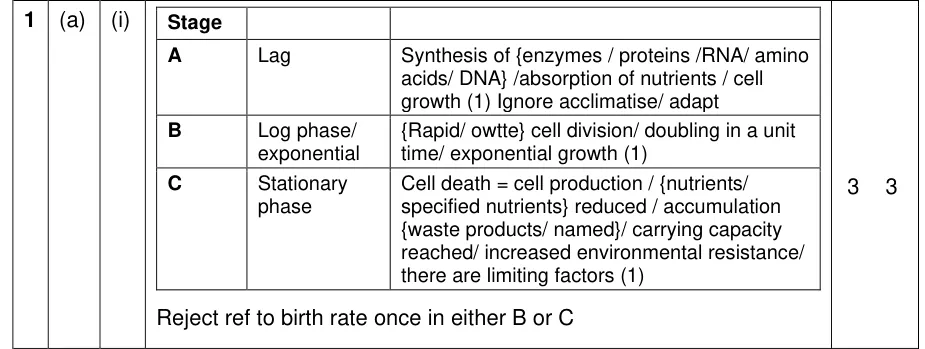
A level Component 1 · June 2022 · Q1(a)(i) · 3 marks
Name and explain the stages of a bacterial population growth curve.
Show the mark scheme
Tap an image to open it full size.
From the examiners' report: Explain the shape, don't just describe it. Bacteria don't have a "birth rate": they divide.
Question 3
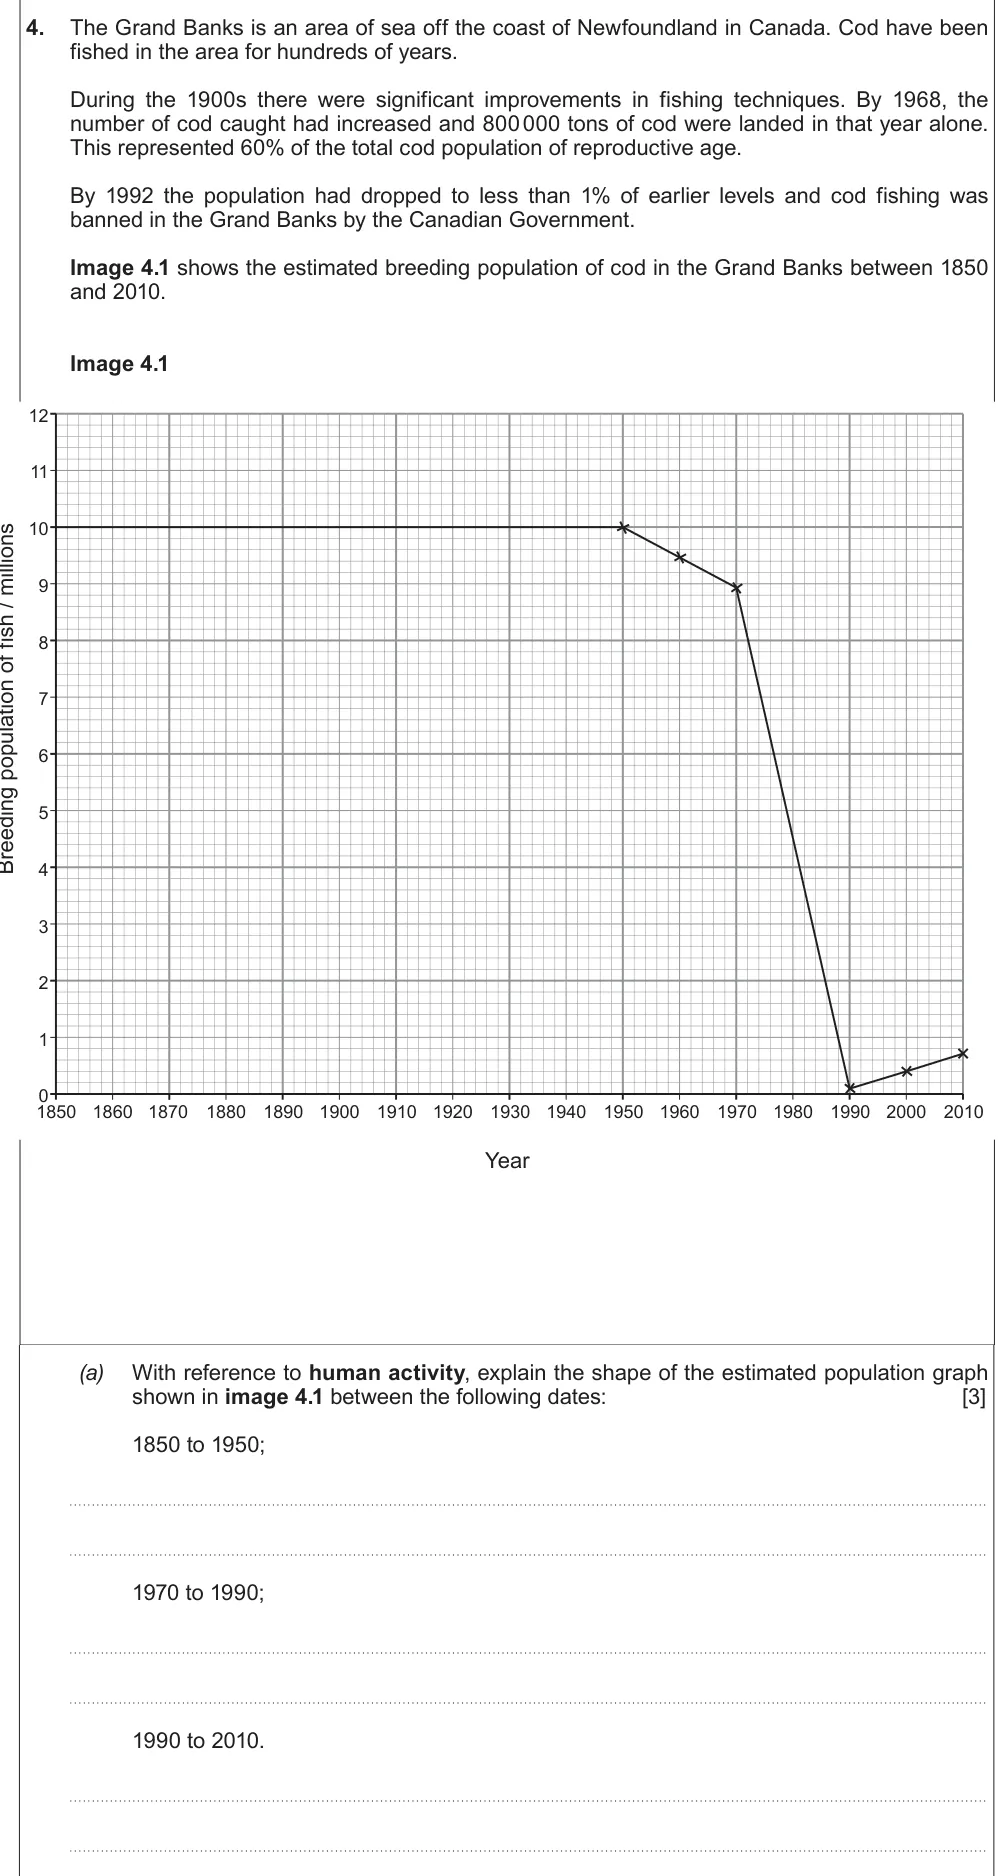
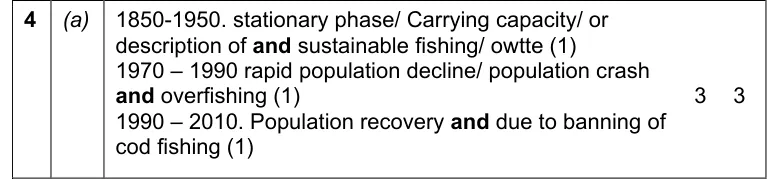
A level Component 1 · Autumn 2020 · Q4(a) · 3 marks
Explain the shape of a cod population graph with reference to human activity.
Show the mark scheme
Tap an image to open it full size.
From the examiners' report: Marks were lost for describing without explaining, and the examiner was surprised nobody used the term carrying capacity.
Question 4
A level Component 1 · June 2019 · Q6(b) · 3 marks
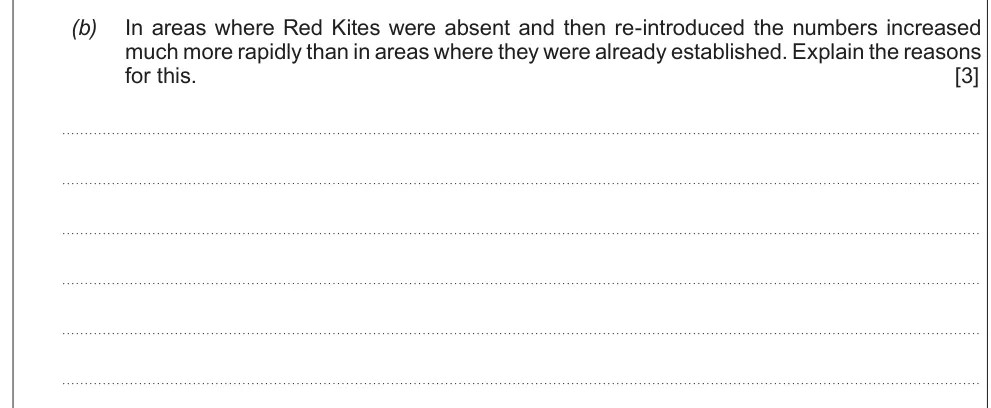
Explain why reintroduced red kites increased faster than established ones.
Show the mark scheme

Tap an image to open it full size.
From the examiners' report: This question is about intraspecific competition and a lack of predators: use those exact terms.
Regulating populations
Question 5
A level Component 2 · June 2018 · Q5(a) · 4 marks · Easy
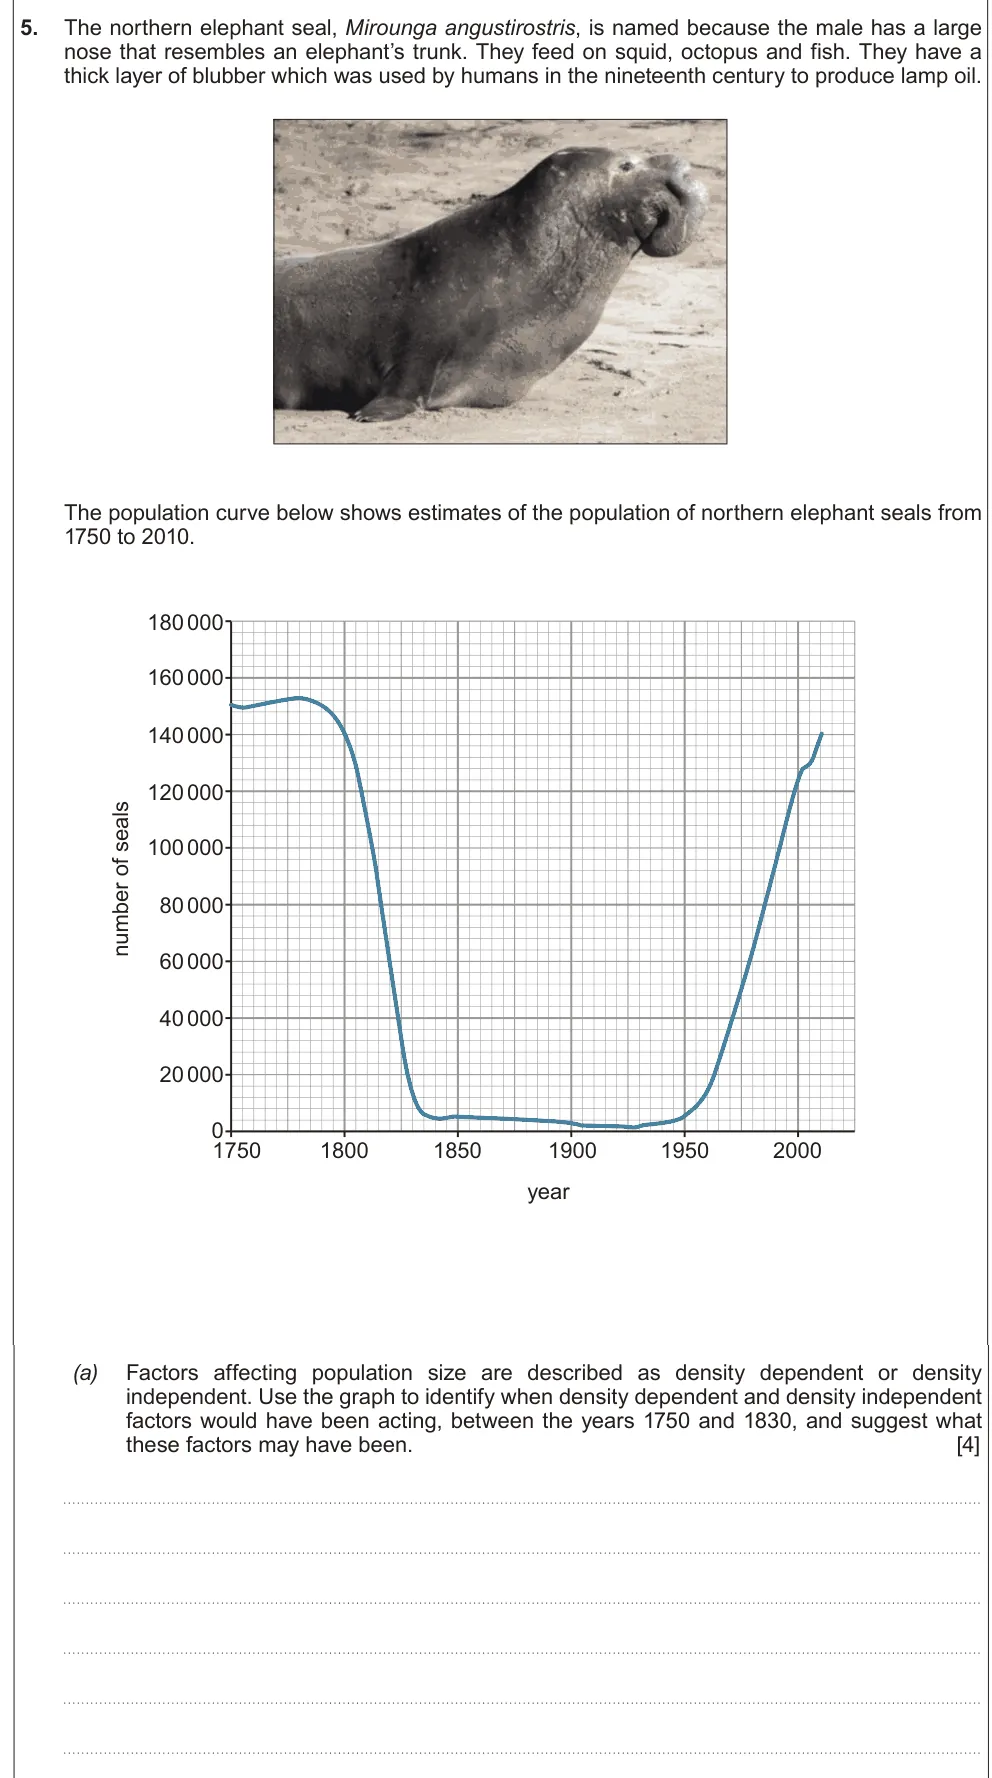
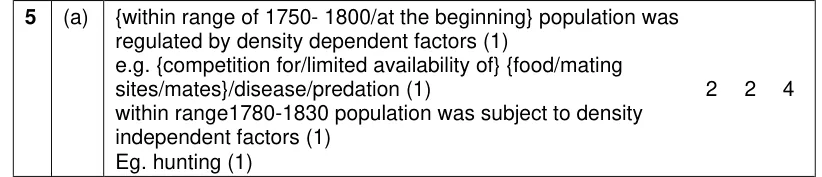
Use a seal population graph to identify when density-dependent and density-independent factors acted.
Show the mark scheme
Tap an image to open it full size.
From the examiners' report: Many missed hunting as the obvious density-independent factor, and matched factors to the wrong dates.
Question 6
A level Component 1 · June 2025 · Q6(a)(ii) · 2 marks
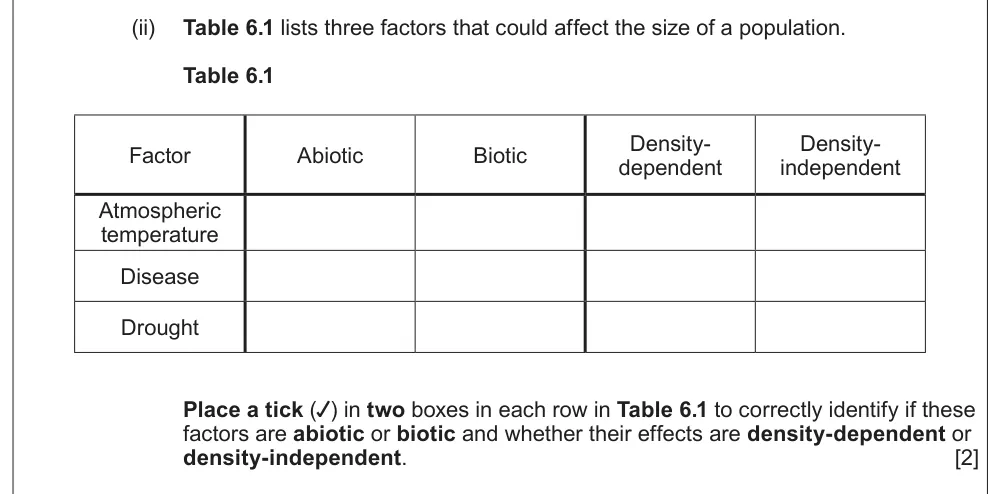
Classify temperature, disease and drought as abiotic or biotic and density-dependent or independent.
Show the mark scheme
Tap an image to open it full size.
Sampling techniques
Question 7
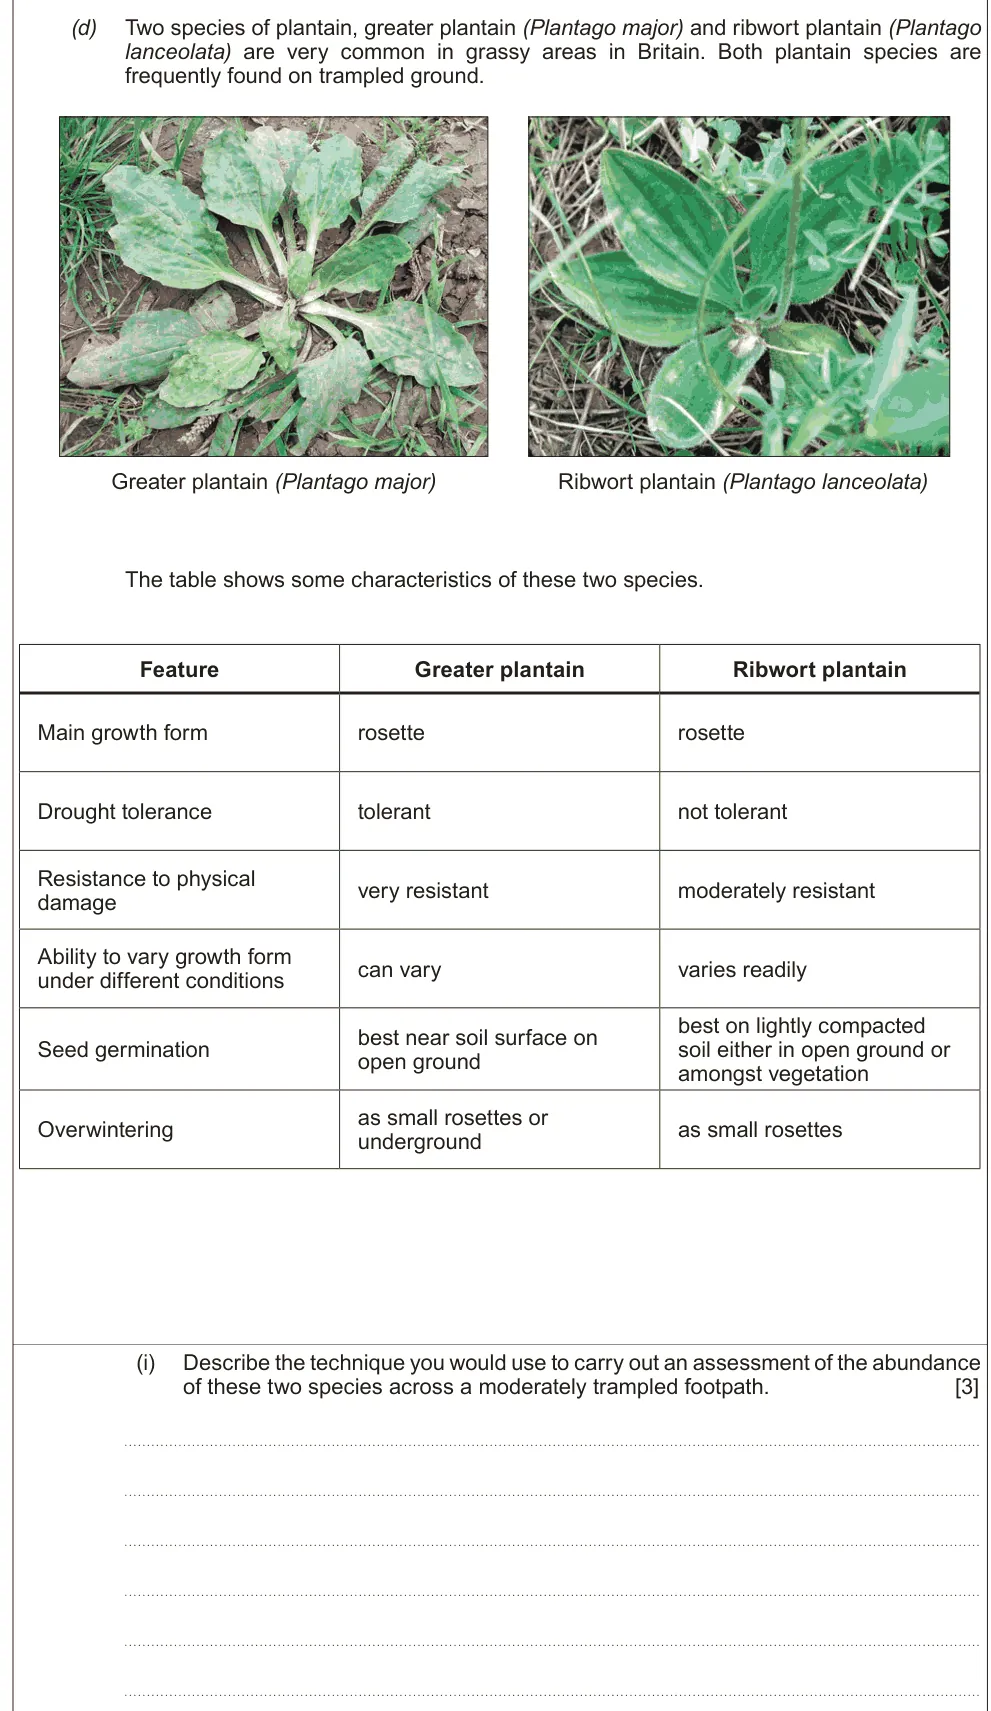
A level Component 1 · June 2018 · Q3(d)(i) · 3 marks
Describe how to assess the abundance of two plant species across a trampled footpath.
Show the mark scheme

Tap an image to open it full size.
From the examiners' report: A footpath is narrow: don't put quadrats every 5 m or use a random grid. Use a transect across the path with quadrats along it.
Question 8
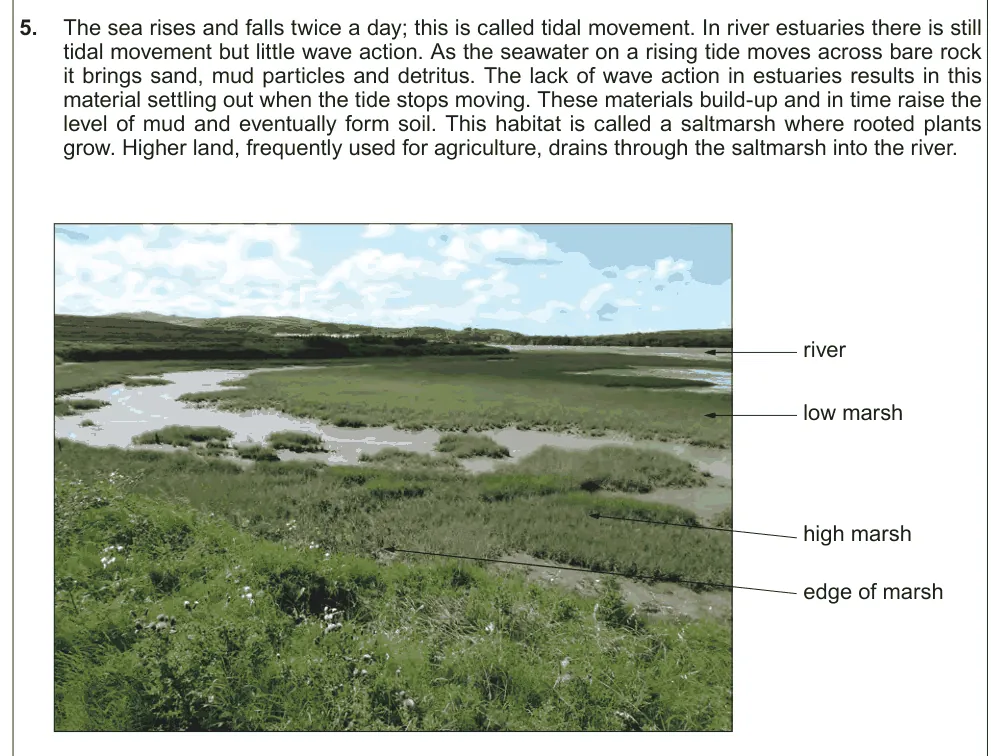
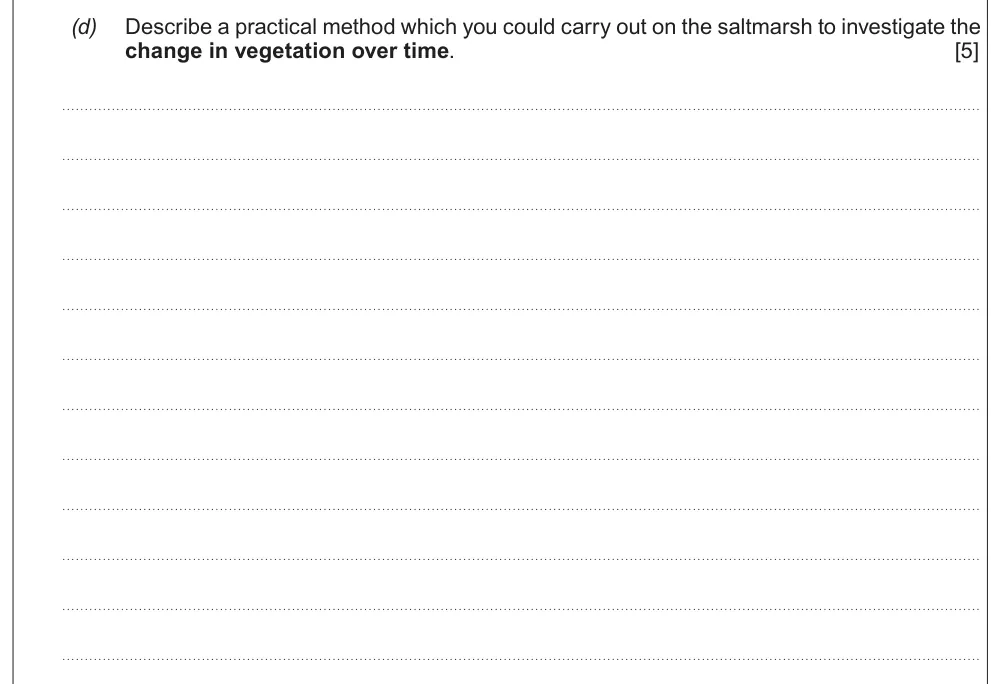
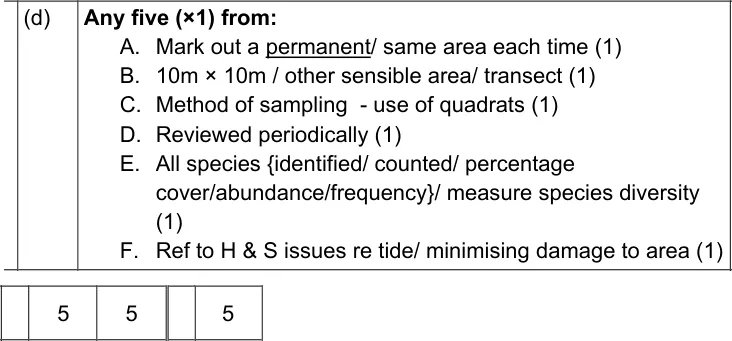
A level Component 1 · June 2019 · Q5(d) · 5 marks
Describe a practical method to investigate the change in saltmarsh vegetation over time.
Information from earlier in this question:
Show the mark scheme
Tap an image to open it full size.
From the examiners' report: Many forgot to sample the same area each time, and at sensible intervals: daily is far too often.
Question 9
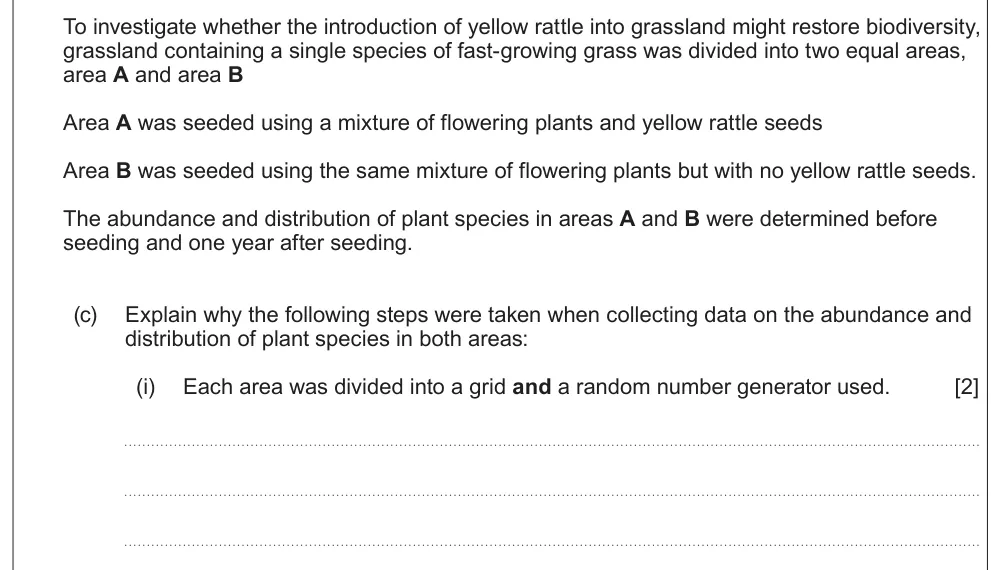
A level Component 1 · June 2022 · Q5(c)(i) · 2 marks · Hard
Explain why each area was divided into a grid and a random number generator used.
Show the mark scheme

Tap an image to open it full size.
From the examiners' report: Students struggled here. The grid gives coordinates, so quadrats are placed at random, which reduces bias.
Question 10
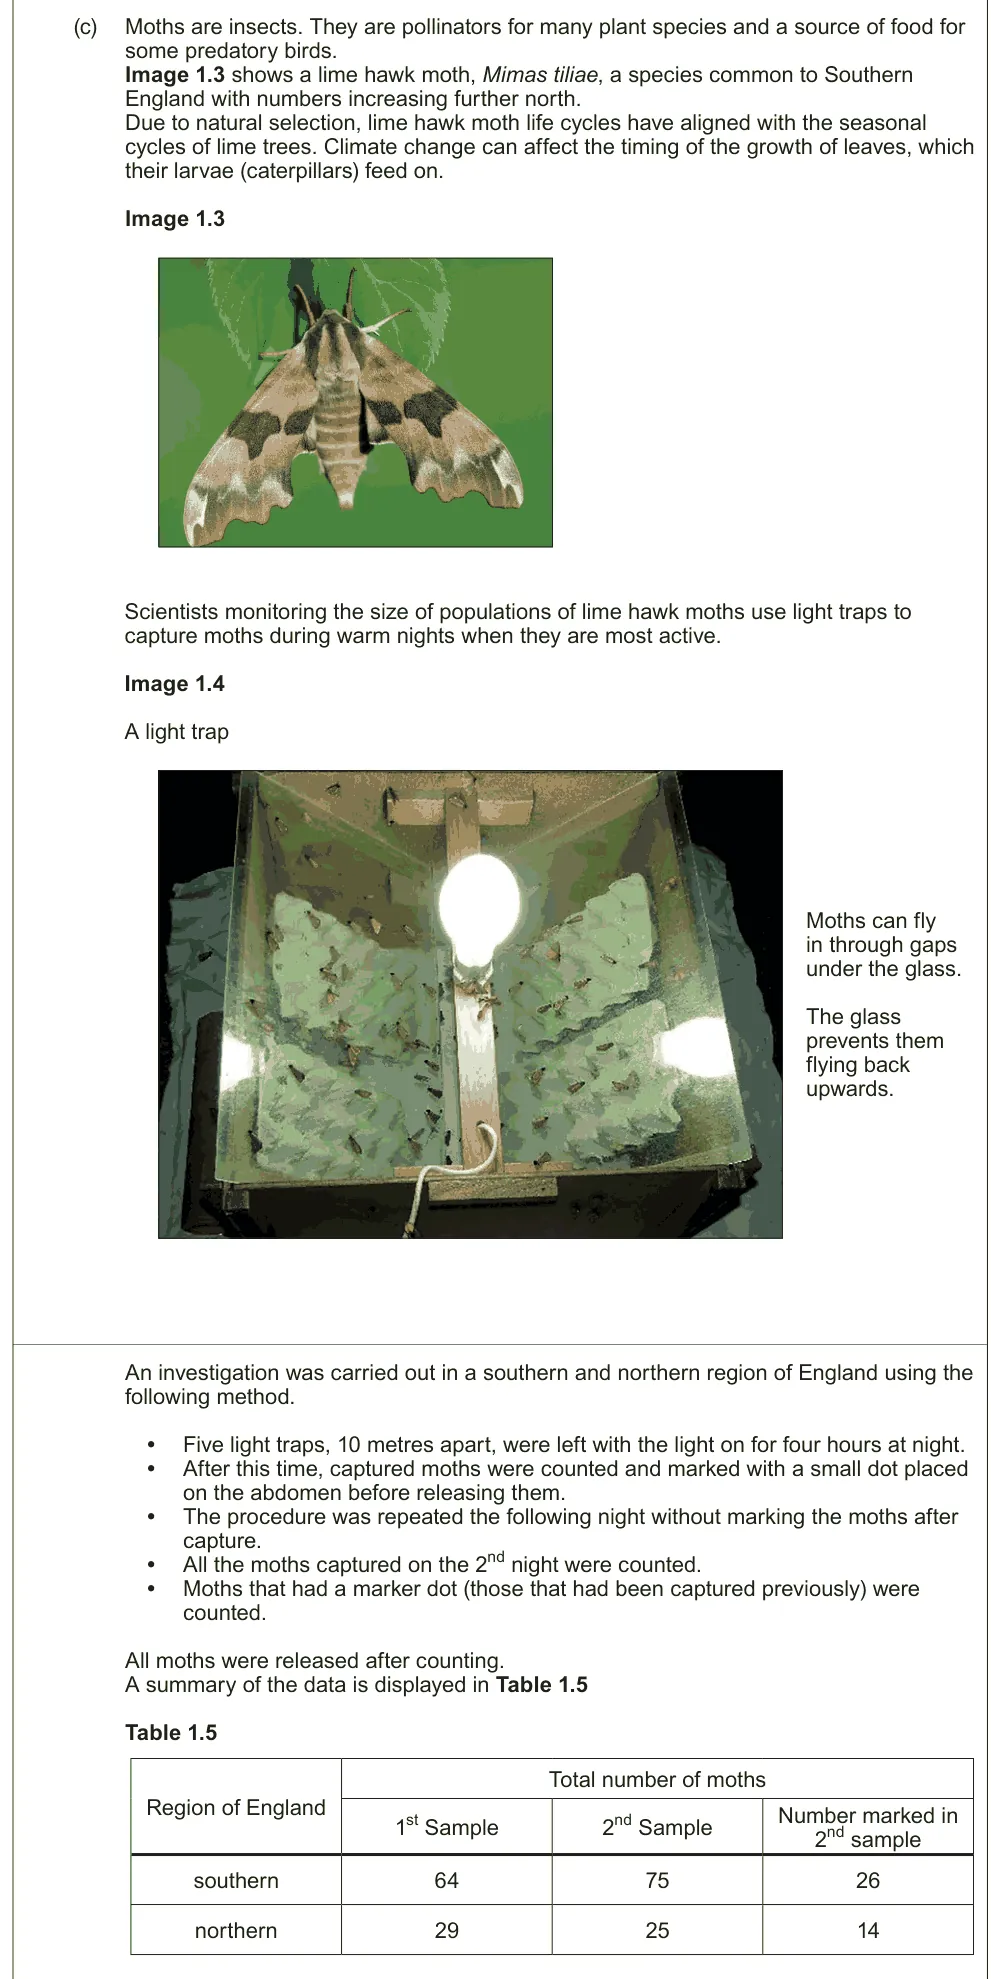
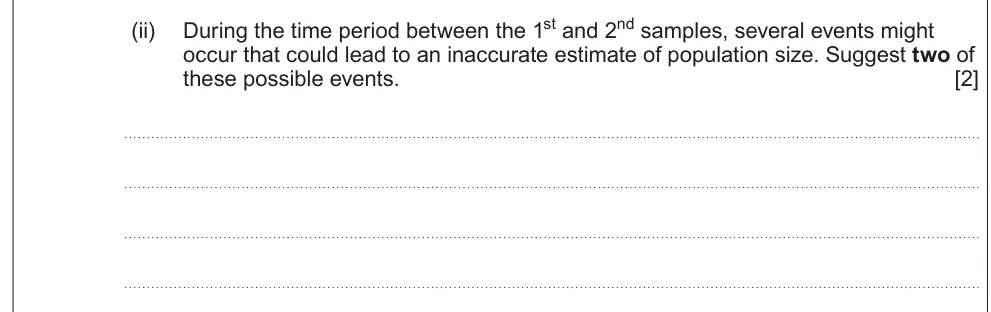
AS Component 2 · June 2023 · Q1(c)(ii) · 2 marks
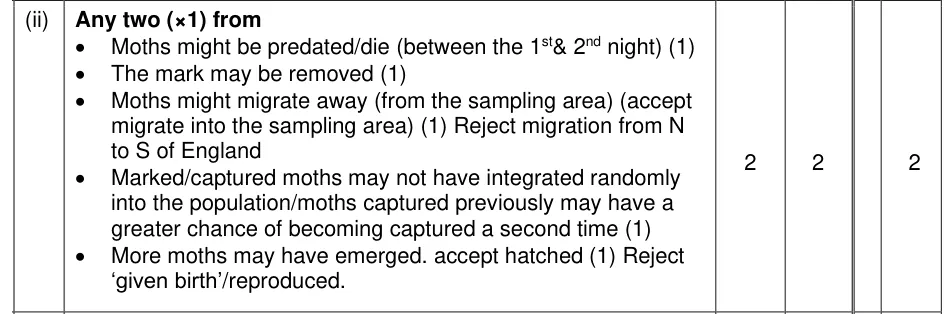
Suggest two events that could make a mark-release-recapture estimate of moths inaccurate.
Information from earlier in this question:
Show the mark scheme
Tap an image to open it full size.
From the examiners' report: Moths "giving birth" was rejected. Think about death, marks being lost and migration.
Energy flow and productivity
Question 11
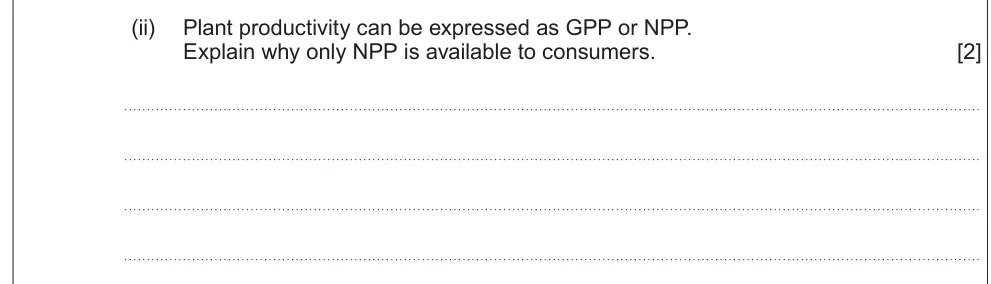
A level Component 1 · June 2024 · Q2(a)(ii) · 2 marks
Explain why only NPP is available to consumers.
Show the mark scheme

Tap an image to open it full size.
Question 12
A level Component 1 · June 2022 · Q3(a)(i) · 1 mark
Give the full names of GPP and NPP.
Show the mark scheme

Tap an image to open it full size.
Question 13
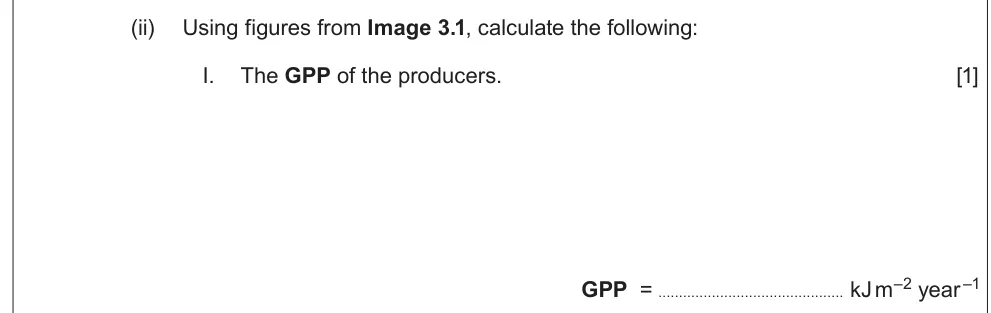
A level Component 1 · June 2022 · Q3(a)(ii)I · 1 mark
Calculate the GPP of the producers from an energy flow diagram.
Show the mark scheme

Tap an image to open it full size.
From the examiners' report: Students found GPP harder to calculate than NPP. Remember that GPP includes the energy lost in respiration.
Question 14
A level Component 1 · June 2022 · Q3(a)(ii)II · 1 mark
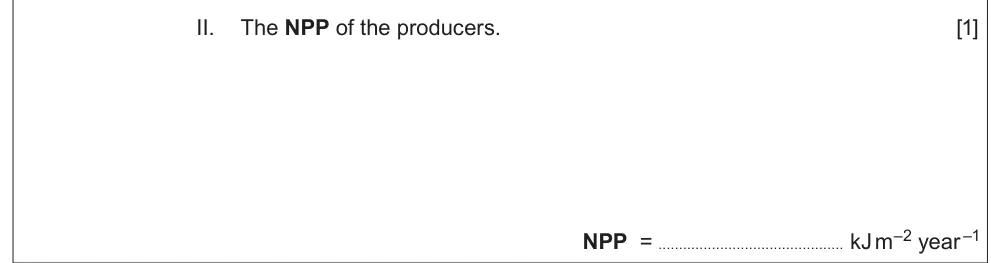
Calculate the NPP of the producers.
Show the mark scheme

Tap an image to open it full size.
Question 15
A level Component 1 · June 2022 · Q3(b)(i) · 2 marks
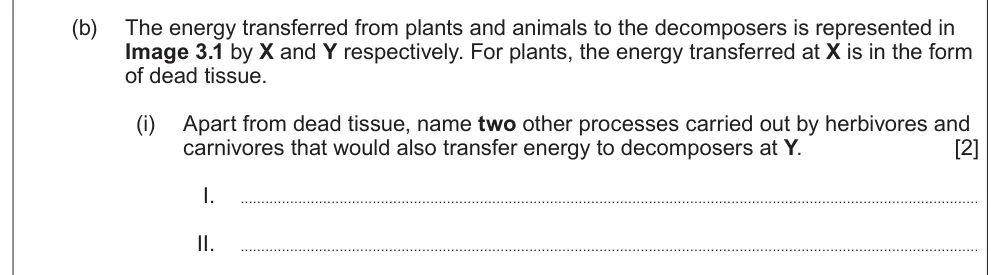
Name two processes by which energy is lost from the herbivores.
Show the mark scheme

Tap an image to open it full size.
From the examiners' report: Name the processes (egestion and excretion), not the products.
Question 16
A level Component 1 · June 2022 · Q3(b)(ii) · 2 marks
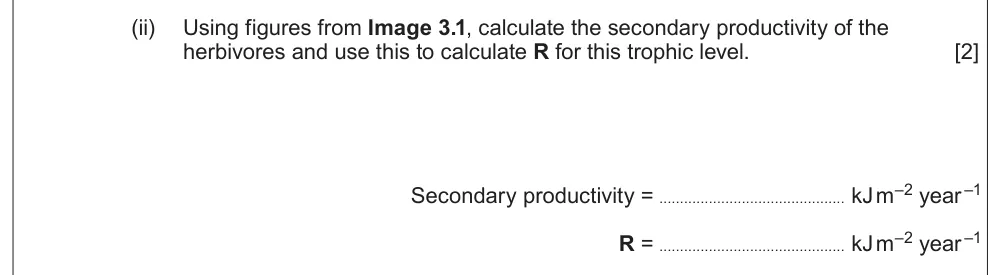
Calculate the secondary productivity and R of the herbivores.
Show the mark scheme

Tap an image to open it full size.
Succession
Question 17
A level Component 1 · June 2022 · Q3(c)(iii) · 3 marks · Hard
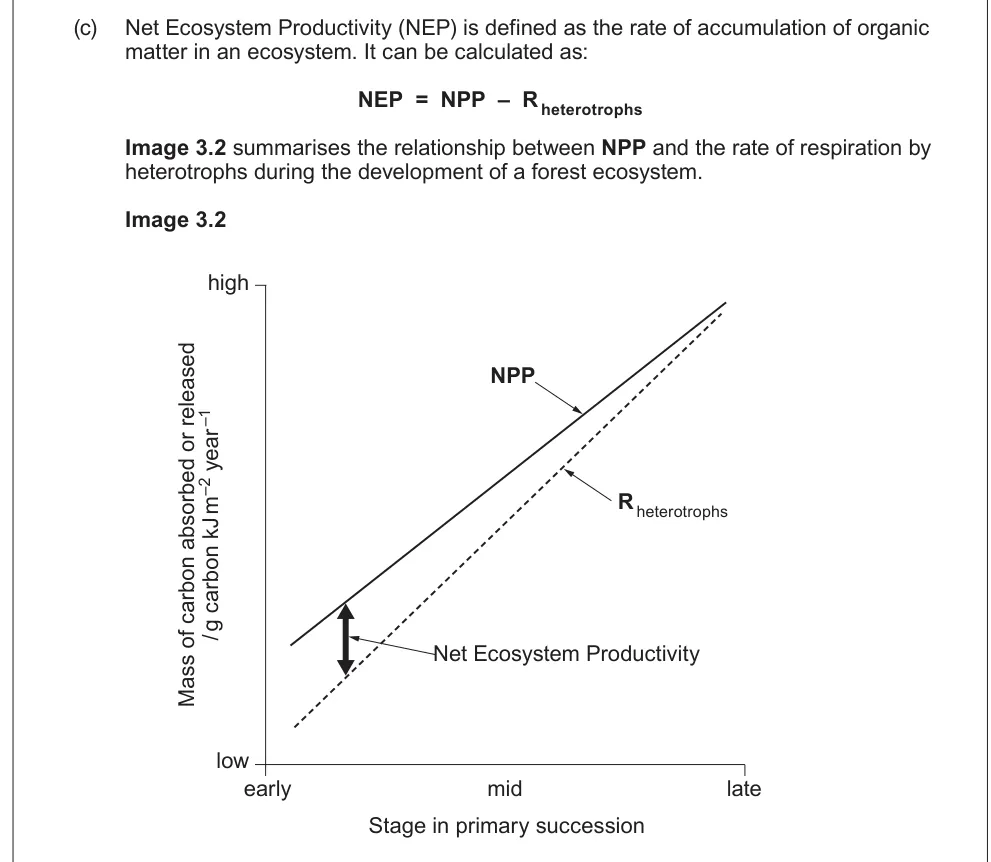
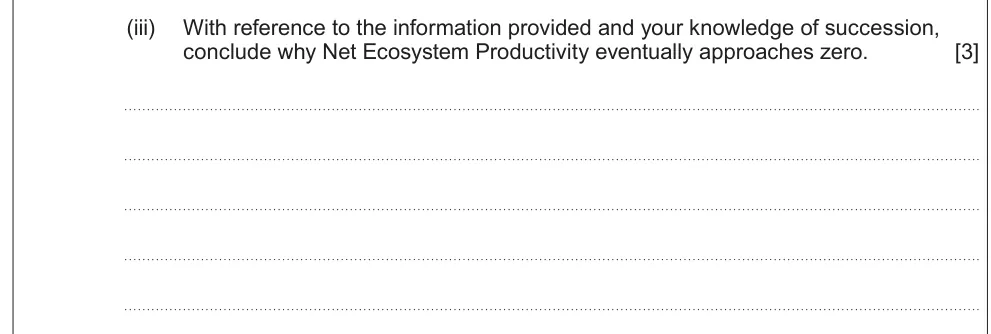
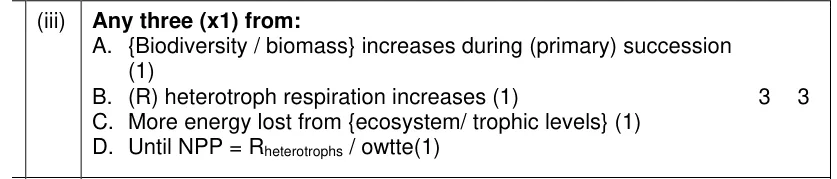
Conclude why net ecosystem productivity approaches zero during succession.
Information from earlier in this question:
Show the mark scheme
Tap an image to open it full size.
From the examiners' report: Most students found this difficult. Link the rise in biomass during succession to more respiration by heterotrophs.
Question 18
A level Component 1 · Autumn 2020 · Q4(d) · 3 marks
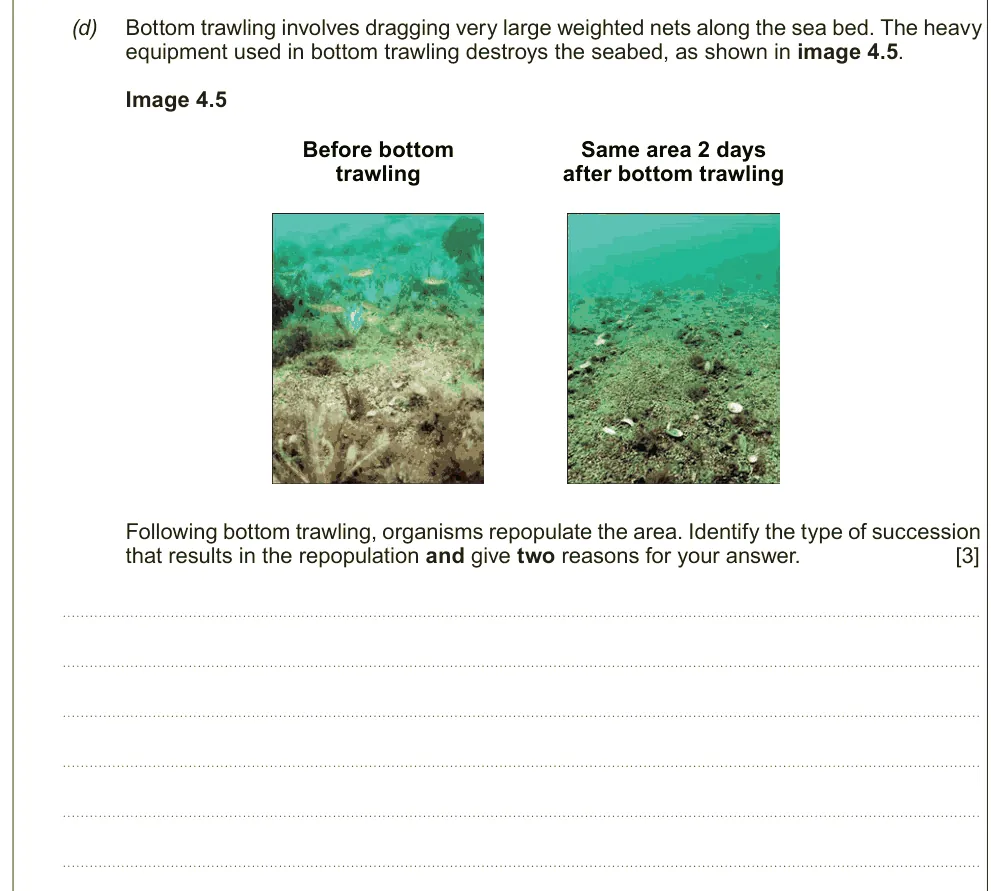
Identify the type of succession after bottom trawling and give two reasons.
Show the mark scheme

Tap an image to open it full size.
Question 19
A level Component 1 · June 2023 · Q6(a)(i) · 2 marks
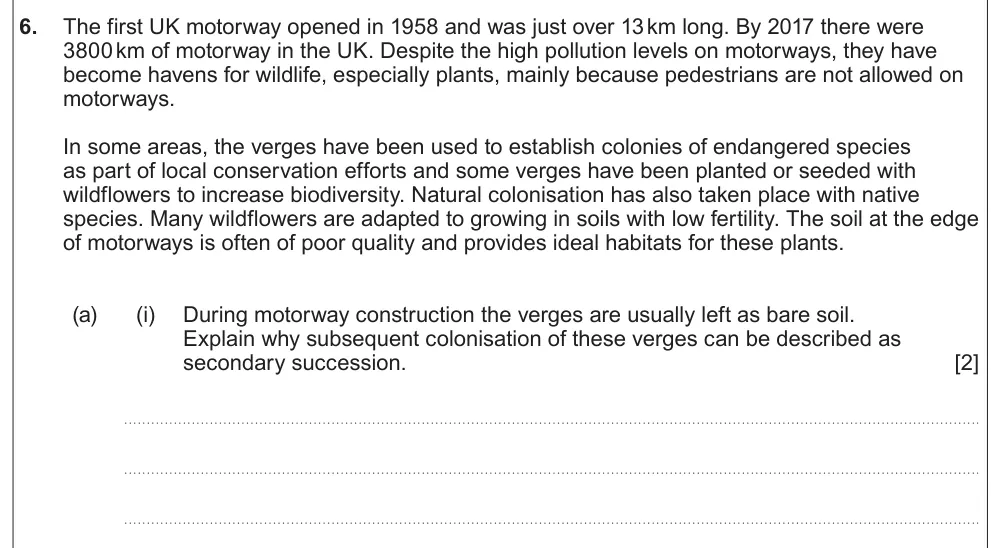
Explain why colonisation of bare motorway verges is secondary succession.
Show the mark scheme

Tap an image to open it full size.
From the examiners' report: Many couldn't apply succession to the scenario. Use the stem: the soil, seeds and roots are already there.
The nitrogen cycle
Question 20
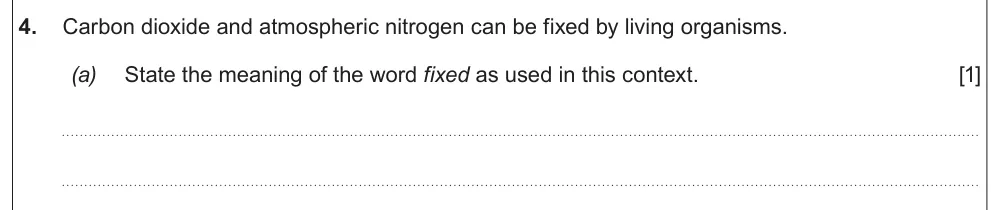
A level Component 1 · Autumn 2021 · Q4(a) · 1 mark
State what fixed means for carbon dioxide and nitrogen.
Show the mark scheme

Tap an image to open it full size.
Question 21
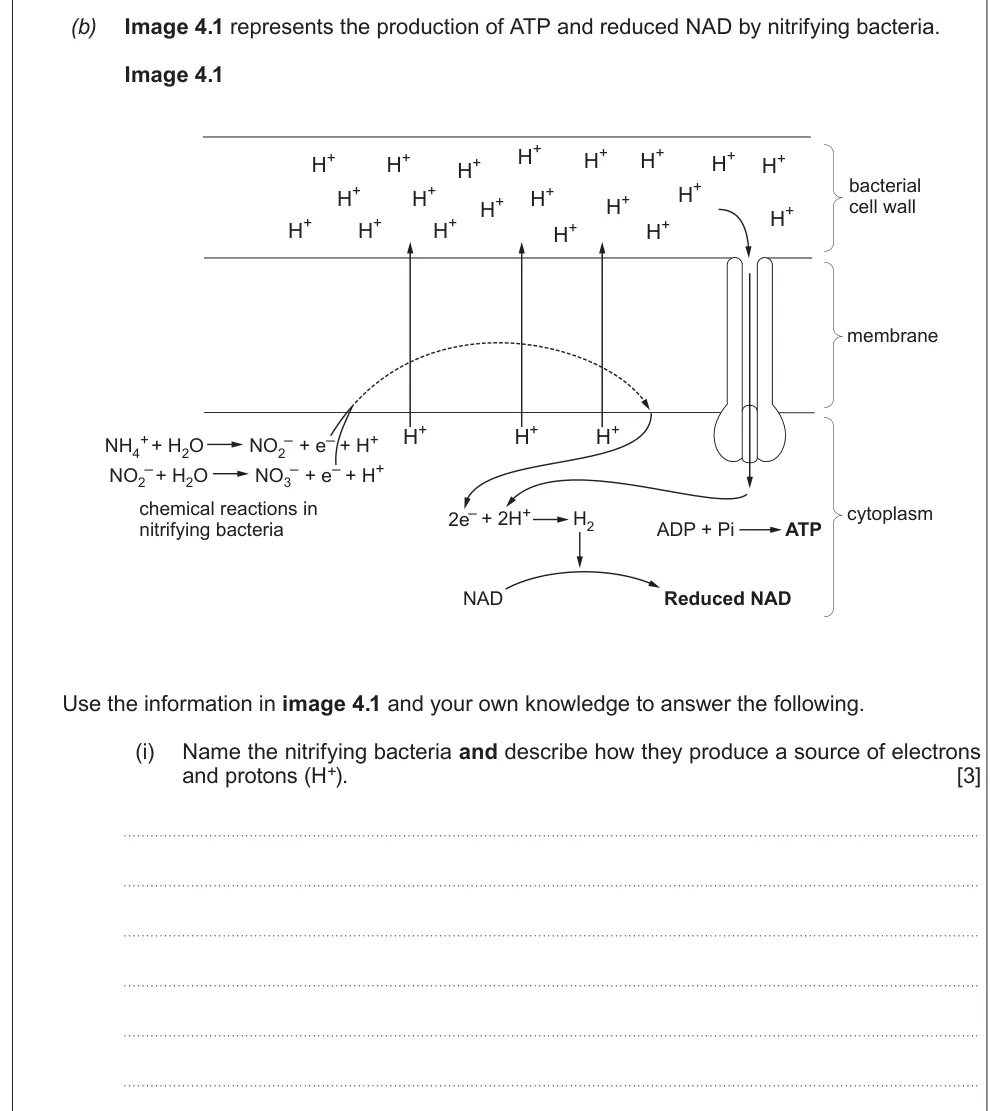
A level Component 1 · Autumn 2021 · Q4(b)(i) · 3 marks
Name the nitrifying bacteria and describe how they produce electrons and protons.
Show the mark scheme

Tap an image to open it full size.
Question 22
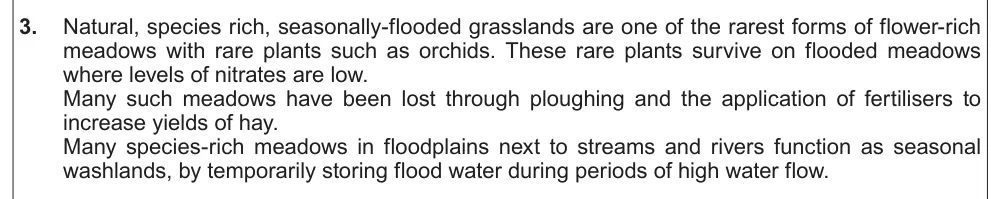
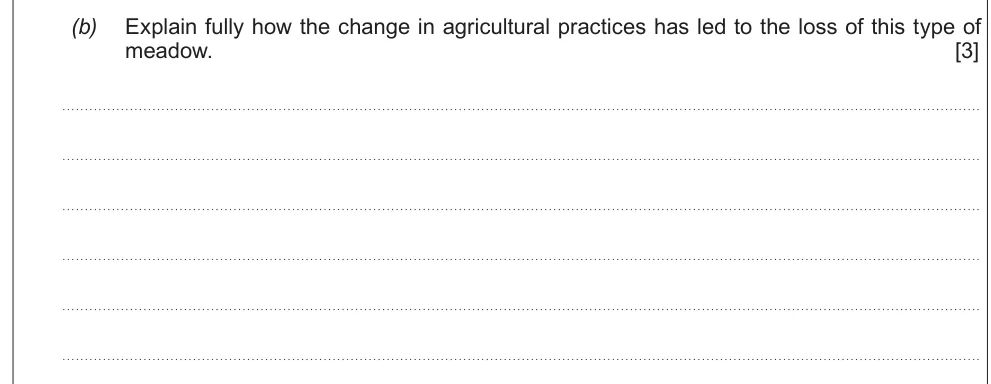
A level Component 1 · June 2018 · Q3(b) · 3 marks · Easy
Explain how changes in agricultural practice led to the loss of a type of meadow.
Information from earlier in this question:
Show the mark scheme

Tap an image to open it full size.
From the examiners' report: Read the stem and think: this part is simply the nitrogen cycle applied to a meadow.
Question 23
A level Component 1 · June 2023 · Q4(a)(ii) · 4 marks
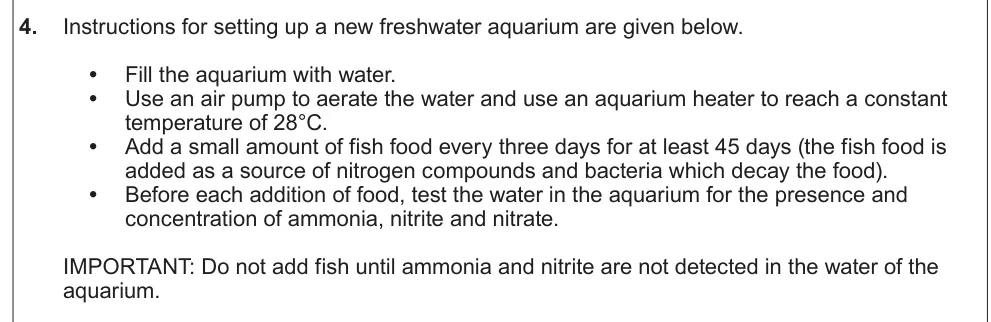
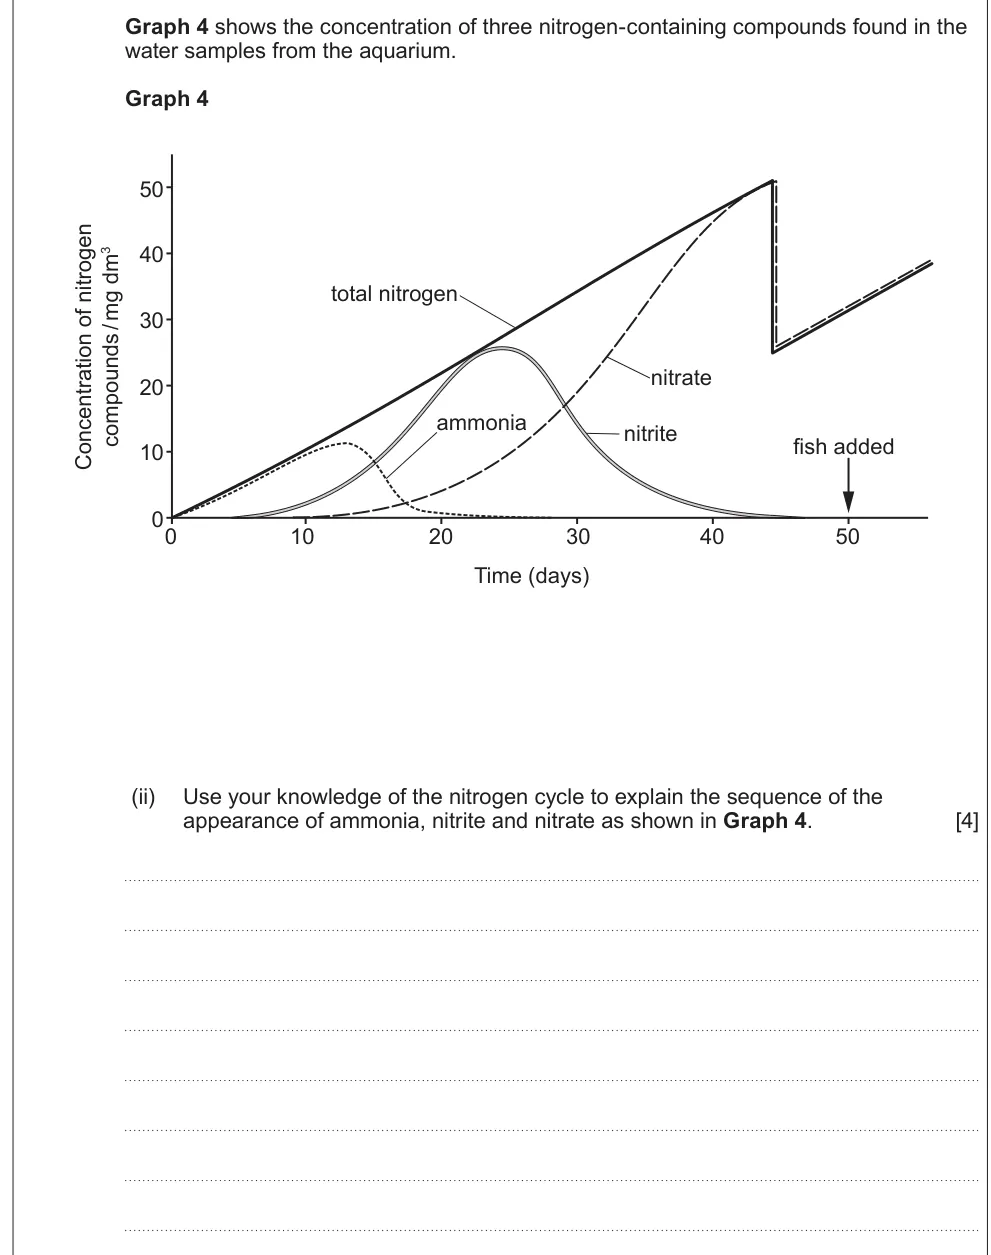
Explain the order in which ammonia, nitrite and nitrate appear in an aquarium.
Information from earlier in this question:
Show the mark scheme
Tap an image to open it full size.
Question 24
A level Component 1 · June 2023 · Q4(b)(ii) · 3 marks
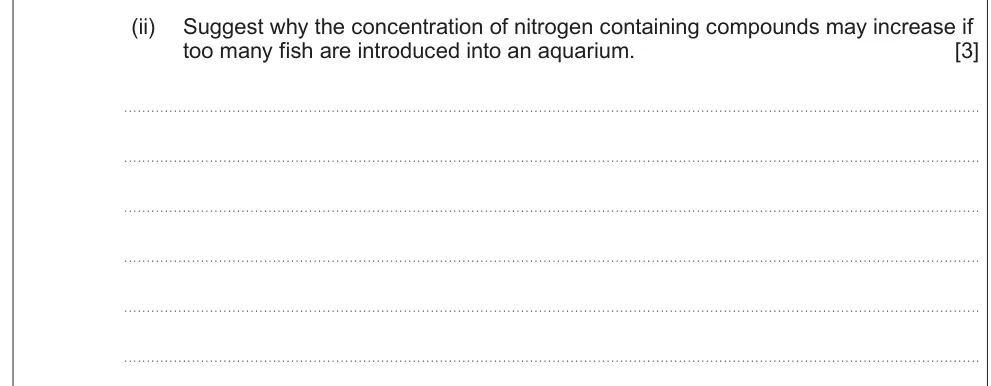
Suggest why nitrogen compounds increase if too many fish are added.
Show the mark scheme

Tap an image to open it full size.
Human impact on cycles
Question 25
A level Component 1 · June 2023 · Q4(c) · 3 marks
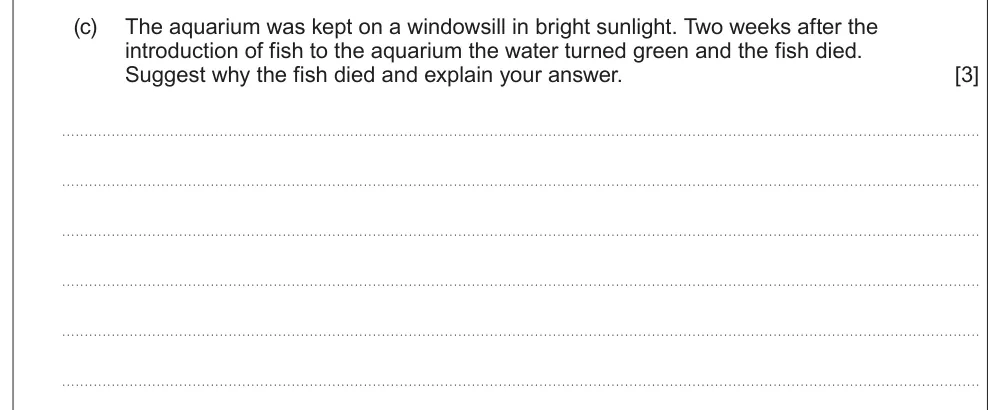
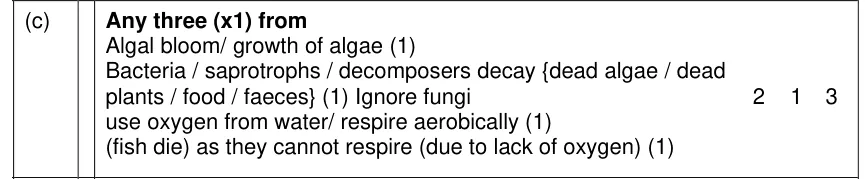
Suggest why fish died after the aquarium water turned green.
Show the mark scheme
Tap an image to open it full size.
From the examiners' report: Many couldn't apply eutrophication to the aquarium: algae grow, decomposers use the oxygen, and the fish can't respire.
Question 26
A level Component 1 · June 2017 · Q3(c) · 3 marks
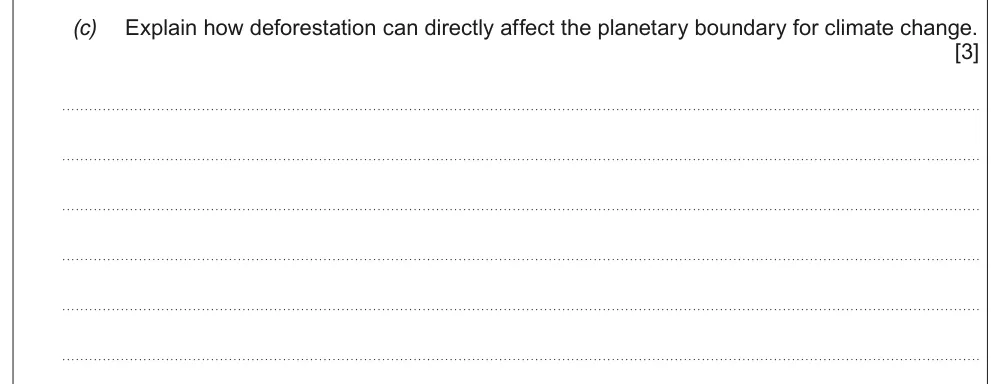
Explain how deforestation affects the planetary boundary for climate change.
Show the mark scheme

Tap an image to open it full size.
Question 27
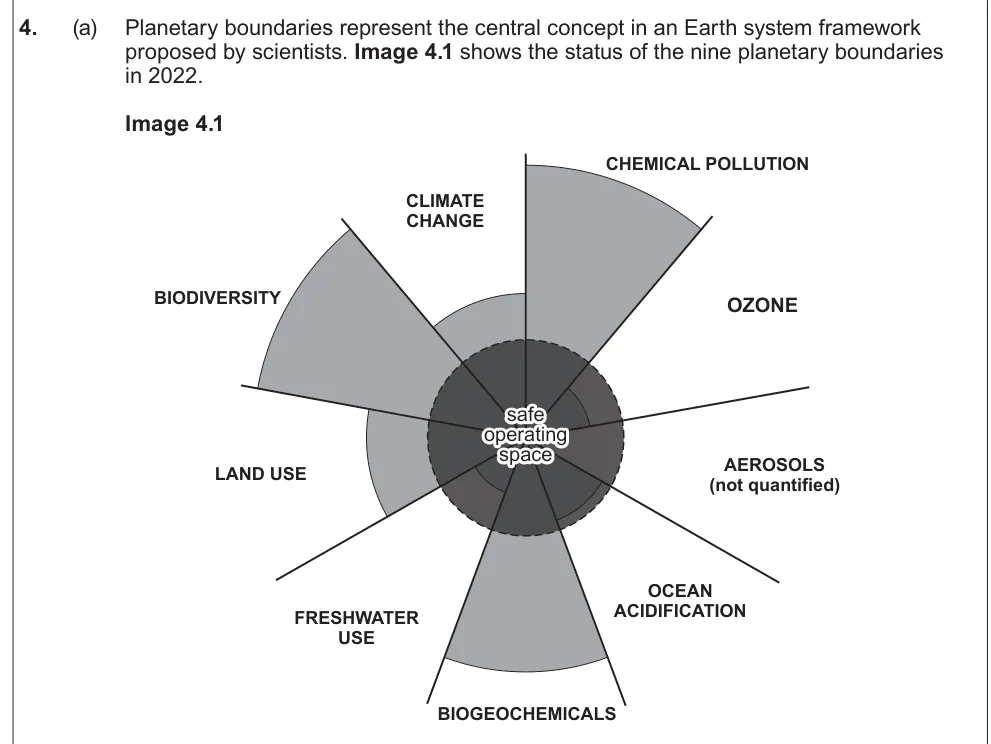
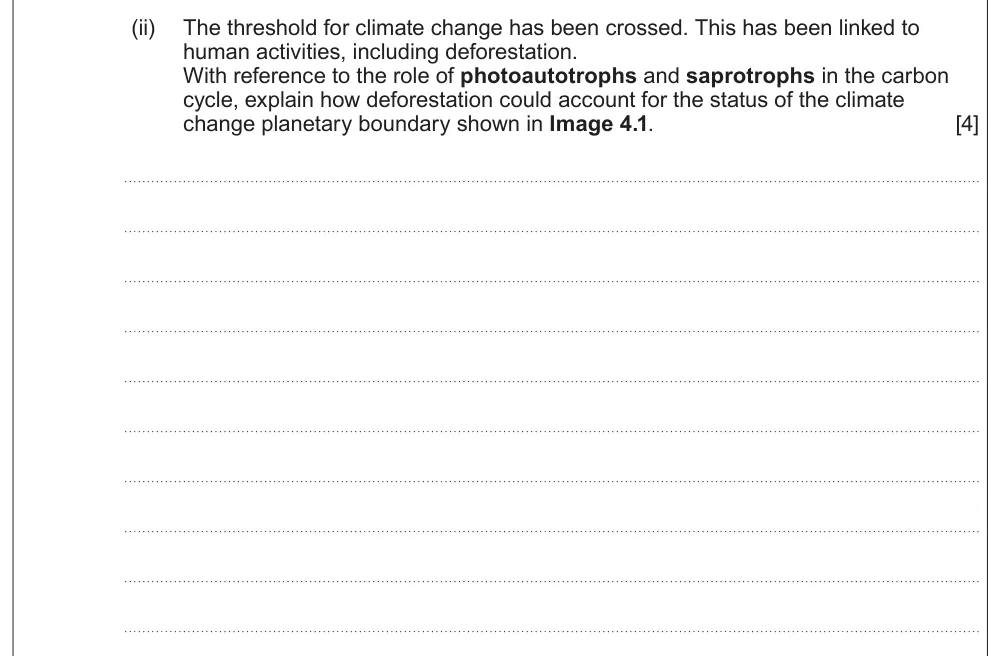
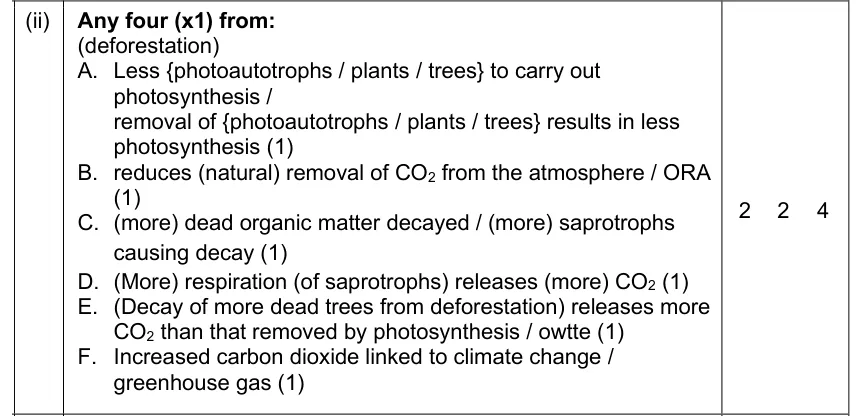
A level Component 1 · June 2025 · Q4(a)(ii) · 4 marks
Explain how deforestation affects the carbon cycle, with reference to photoautotrophs and saprotrophs.
Information from earlier in this question:
Show the mark scheme
Tap an image to open it full size.
Where students lose marks (from Eduqas examiners' reports and mark schemes)
Each point below is followed by wording that gained marks.
Explain, don't describe: Marks were lost for describing the graph rather than explaining it.
✔ Gains credit: "Rapid population decline / population crash and overfishing".
Bacteria don't give birth: "Birth rate" of bacteria was rejected.
✔ Gains credit: "Rapid cell division / doubling in a unit time / exponential growth".
Match the method to the habitat: Many put quadrats every 5 m across a narrow footpath, or used a random grid.
✔ Gains credit: "Use of transect and use of quadrats" "Repeat at points / intervals along footpath".
Processes, not products: Marks were lost by naming excretory or egested products.
✔ Gains credit: "Egestion" and "Excretion / urination".
Spot the density-independent factor: Many missed hunting as the density-independent factor.
✔ Gains credit: "Population was subject to density independent factors" "e.g. hunting".
Apply eutrophication to the context: Many couldn't apply their knowledge of eutrophication to the aquarium.
✔ Gains credit: "Decomposers decay dead algae" and "use oxygen from water".
Download the questions
Download the PDF pack (27 questions, mark schemes at the end)
Keep practising
- Importance of ATP (1.1): Eduqas A Level Biology exam questions by topic
- Photosynthesis (1.2): Eduqas A Level Biology exam questions by topic
- Respiration (1.3): Eduqas A Level Biology exam questions by topic
- Microbiology (1.4): Eduqas A Level Biology exam questions by topic
- Human Impact on the Environment (1.6): Eduqas A Level Biology exam questions by topic
- Eduqas A level Biology past papers, mark schemes and examiners' reports
- Eduqas A level Biology grade boundaries
- Ask about Eduqas A level Biology lessons with Sam on WhatsApp
Questions, mark schemes and examiners' report extracts © WJEC CBAC Ltd (Eduqas).