

Graphs and geometry (MS 3 and MS 4 in the specification) cover translating information between graphs and numbers, plotting data, using y = mx + c, calculating a rate of change from a straight-line graph or from the tangent to a curve, and calculating the areas and volumes of regular shapes. In the questions below you read values from line graphs, bar charts and heart pressure traces, plot results, extrapolate a straight line, and calculate the area of a zone of inhibition or of a blood vessel's cross-section. Maths questions appear on every paper, at AS and A level. Questions marked AS are from the AS papers (8BN0); the rest are from the A level papers (9BN0).
The examiners' most common complaint is a missing or wrong unit: a rate needs 'per minute', 'per hour' or 'per year', adapted from the axes. Read values off the graph carefully, and check you are using the right line, bar or time interval. Follow the instruction on significant figures or decimal places. Choose a line graph for numerical data that change over time. With 'determine', use the data to work something out rather than just quoting it. Lay out each stage of your working so that marks can be given if the final answer is wrong.
Studying Edexcel SNAB and want more help? If you'd like to arrange one-to-one Edexcel tutoring, or to register your interest in an Edexcel group class, message Tom on WhatsApp using the link at the bottom of this page.
What you need first
Each question on this page assumes you're secure on these ideas. If any of them feels shaky, look it up before you start.
- A rate of change is the change in the y value divided by the change in the x value, with units of y per unit of x.
- The area of a circle is πr², where r is half the diameter.
- Percentage change = (change ÷ original value) × 100.
- The independent variable goes on the x-axis and the dependent variable on the y-axis.
Key terms
These words come up in the questions and mark schemes. Examiners expect you to use them exactly.
- Gradient: the change in y divided by the change in x for a straight line; it gives the rate of change.
- Tangent: a straight line that touches a curve at one point; its gradient gives the rate of change at that point.
- y = mx + c: the equation of a straight line, where m is the gradient and c is the intercept on the y-axis.
- Extrapolation: extending a trend beyond the range of the data to predict a value.
- Ratio: a comparison of two quantities, usually written as a value to 1, such as 0.86 : 1.
- Standard form: a number written as A × 10ⁿ, where A is between 1 and 10.
- Range bars: bars on a graph showing the highest and lowest values; where they overlap, a difference may not be real.
What these questions cover
Every question on this page tests one of these mathematical skills listed in the Pearson Edexcel A level Biology A (Salters-Nuffield) specification (9BN0).
- MS3.1: Translate information between graphical, numerical and algebraic forms
- MS3.2: Plot two variables from experimental or other data
- MS3.3: Understand that y = mx + c represents a linear relationship
- MS3.5: Calculate rate of change from a graph showing a linear relationship
- MS3.6: Draw and use the slope of a tangent to a curve as a measure of rate of change
- MS4.1: Calculate the circumferences, surface areas and volumes of regular shapes
How to use this page
Write your answer on paper before you open the mark scheme. Allow about 1.2 minutes per mark: the 19 questions are worth 43 marks, so about 52 minutes in total. Then mark your answer strictly against the mark scheme and read the examiners' tip underneath it. If you'd rather print the questions, download the PDF pack.
Reading values from graphs and calculating (MS 3.1)
Question 1
AS Paper 1 · June 2018 · Q5(a)(i) · 2 marks
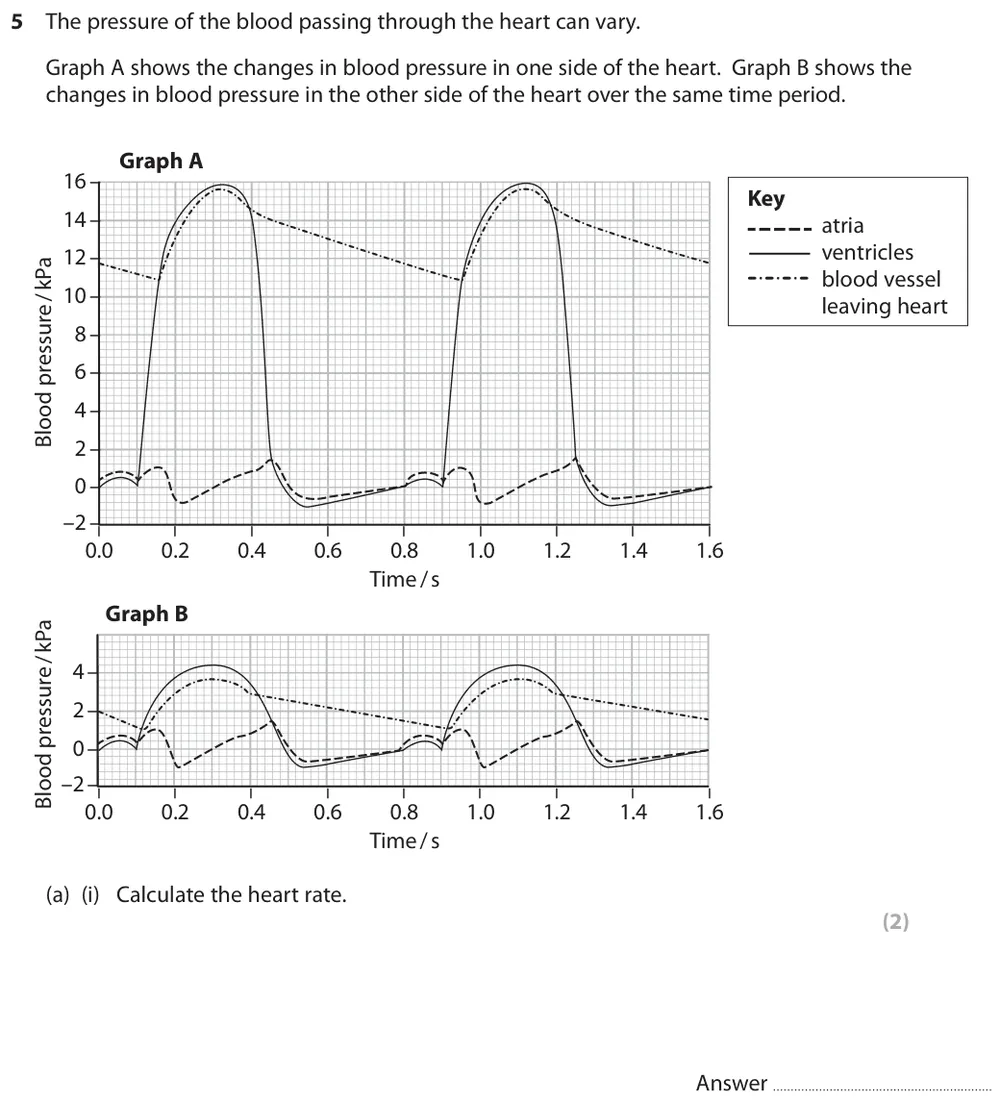
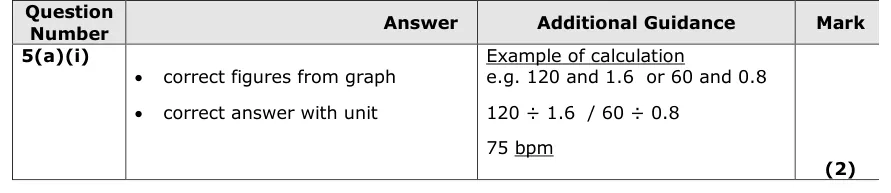
Calculate the heart rate from a graph of blood pressure changes in the heart.
Show the mark scheme
Tap an image to open it full size.
From the examiners' report: Half the candidates scored both marks. The most common reason for gaining only one mark was giving the correct heart rate without a unit. If there is no unit on the answer line, check whether one is needed.
Question 2
AS Paper 2 · June 2023 · Q7(b)(ii) · 3 marks
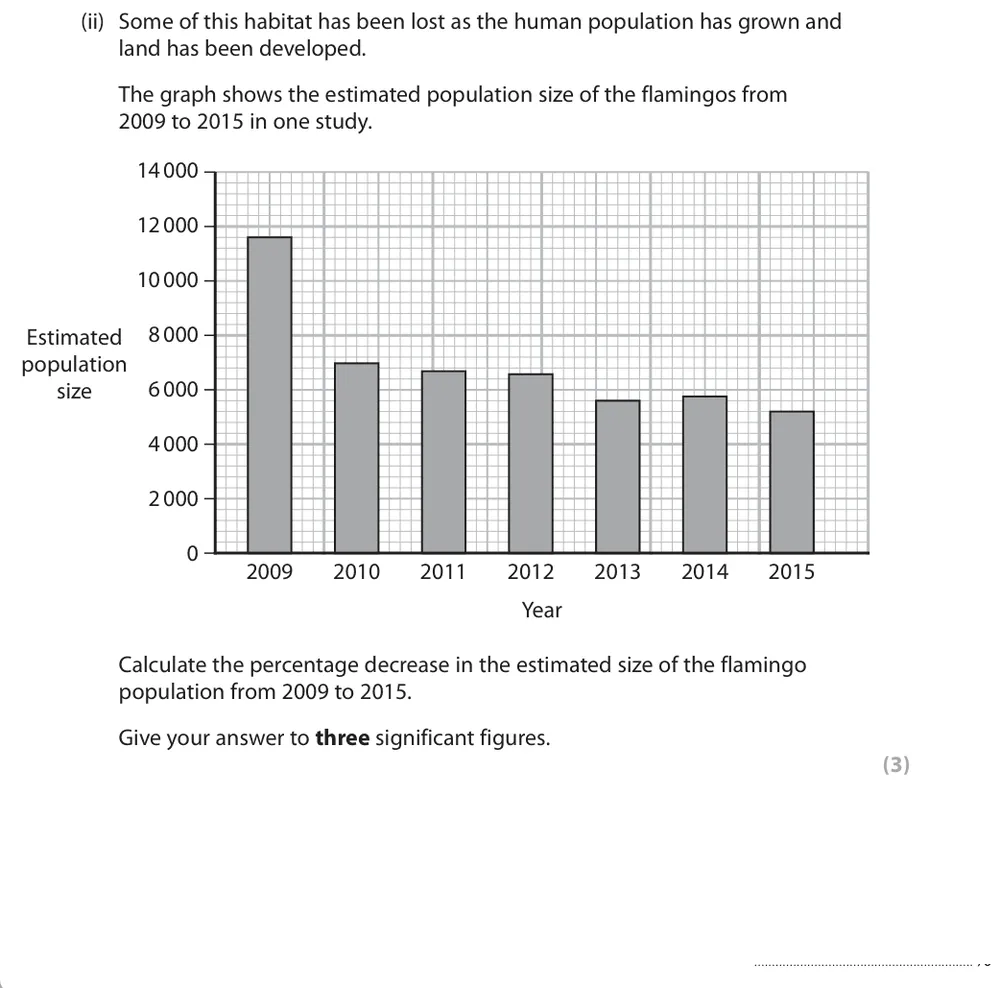
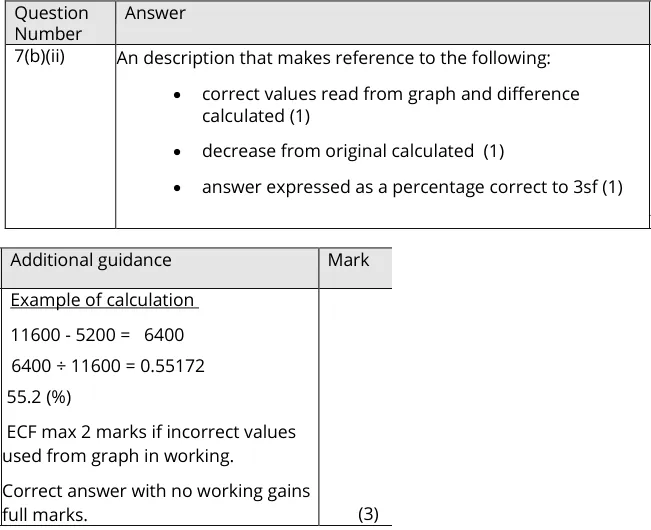
Read two values from a bar chart and calculate the percentage decrease in a flamingo population, to three significant figures.
Show the mark scheme
Tap an image to open it full size.
From the examiners' report: Many did not read the figures correctly from the graph, but could still gain the marks for their working. Divide the decrease by the original value and give three significant figures.
Question 3
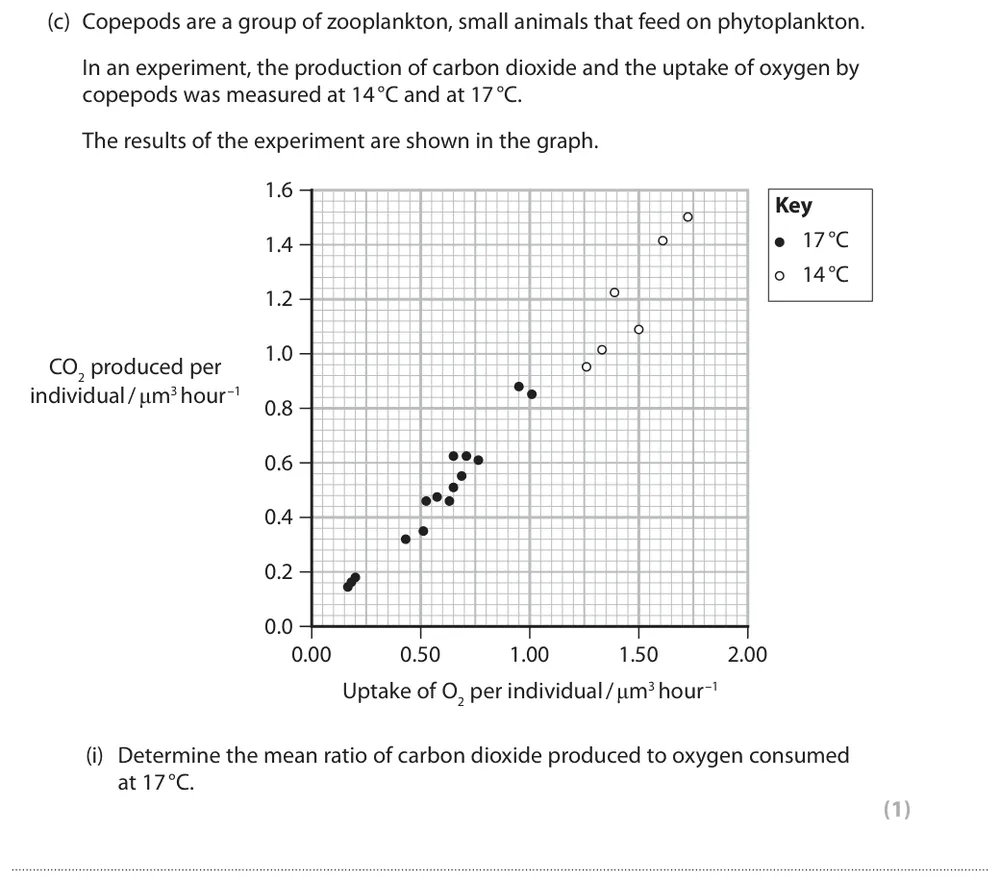
A level Paper 3 · June 2024 · Q4(c)(i) · 1 mark
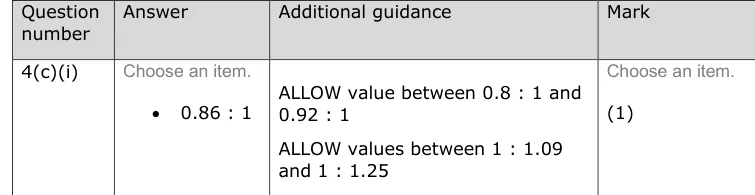
Determine the mean ratio of carbon dioxide produced to oxygen consumed from a graph.
Show the mark scheme
Tap an image to open it full size.
From the examiners' report: Most were correct. Marks were lost for not giving the ratio to 1 (for example 0.6 : 0.657) or for giving it the wrong way round.
Question 4
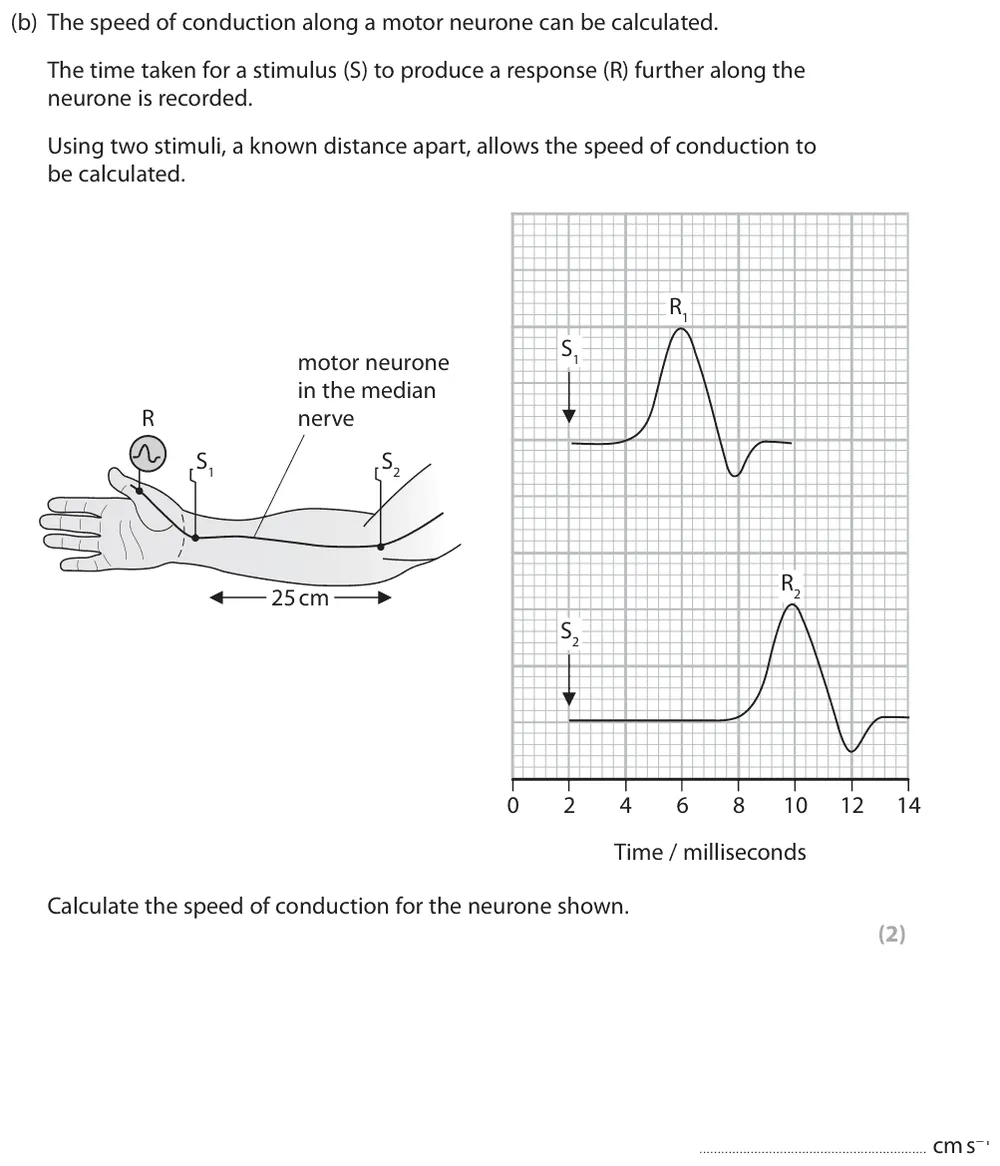
A level Paper 2 · June 2018 · Q8(b) · 2 marks · Hard
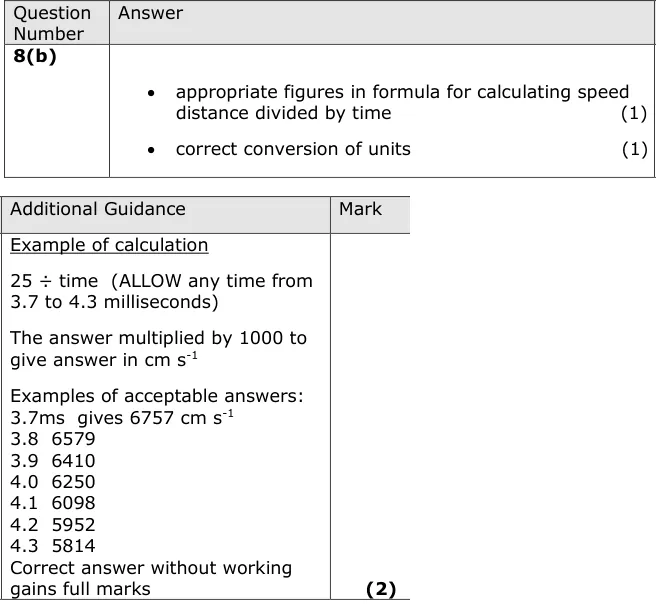
Use a trace of nerve impulses and the distance between two stimuli to calculate the speed of conduction.
Show the mark scheme
Tap an image to open it full size.
From the examiners' report: The data were presented in an unfamiliar way, and many failed to extract the correct information, so many scored nothing. The conversion to the units asked for was often wrong: check which units your answer should be in.
Question 5
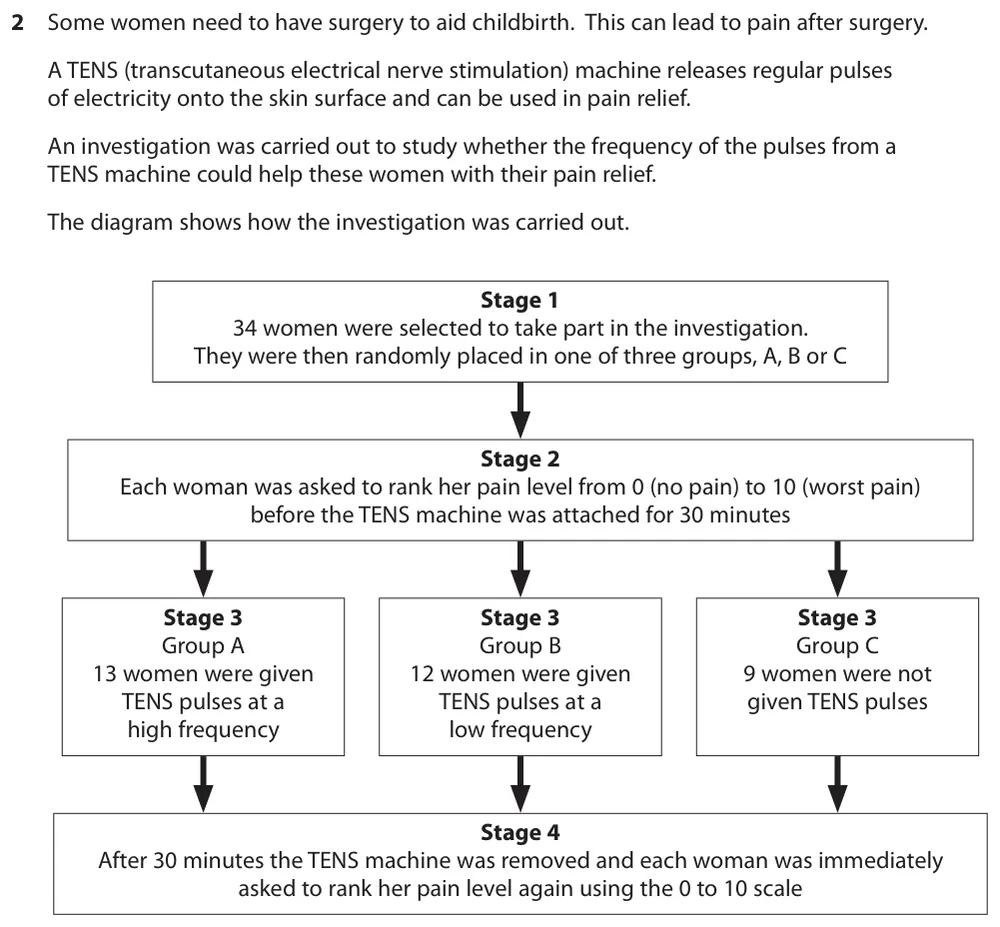
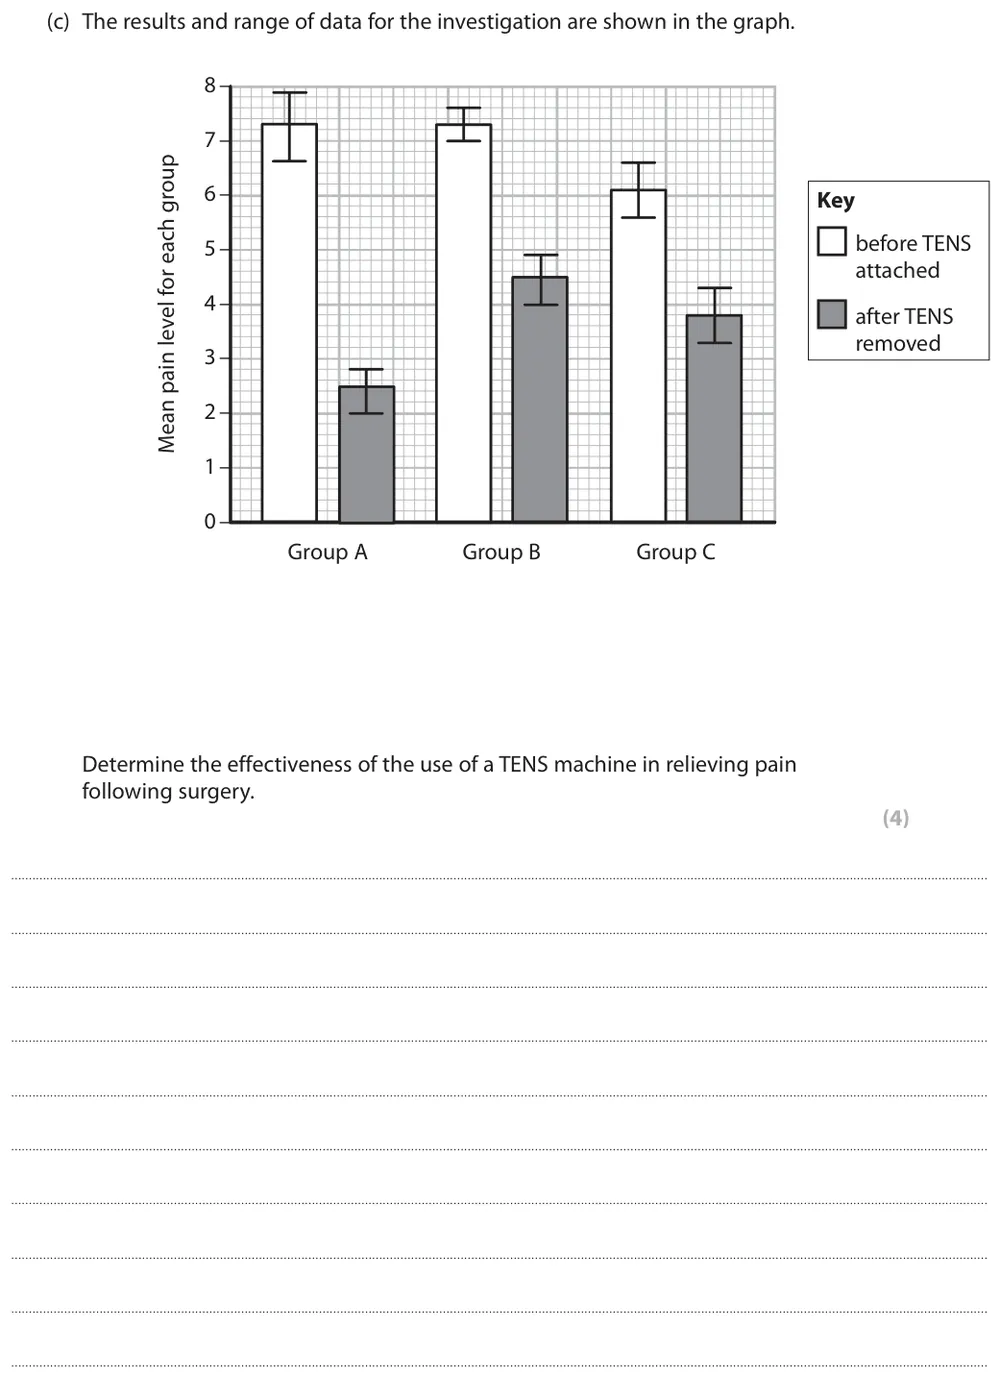
A level Paper 3 · June 2017 · Q2(c) · 4 marks
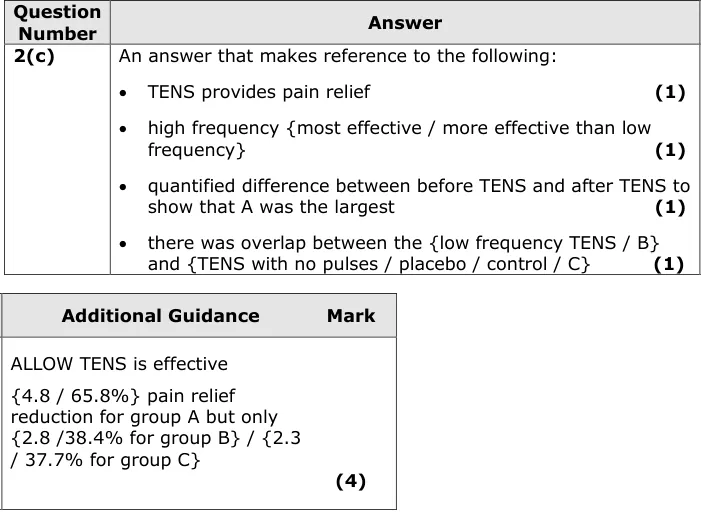
Use a bar graph with range bars to determine how effective a TENS machine is at relieving pain after surgery.
Information from earlier in this question:
Show the mark scheme
Tap an image to open it full size.
From the examiners' report: 'Determine' needs a quantitative element. Better answers worked out the reduction in pain for each group rather than quoting figures, but many could not read values off the bar graph correctly and some subtractions were wrong. Many also noted where range bars did or did not overlap.
Plotting data (MS 3.2)
Question 6
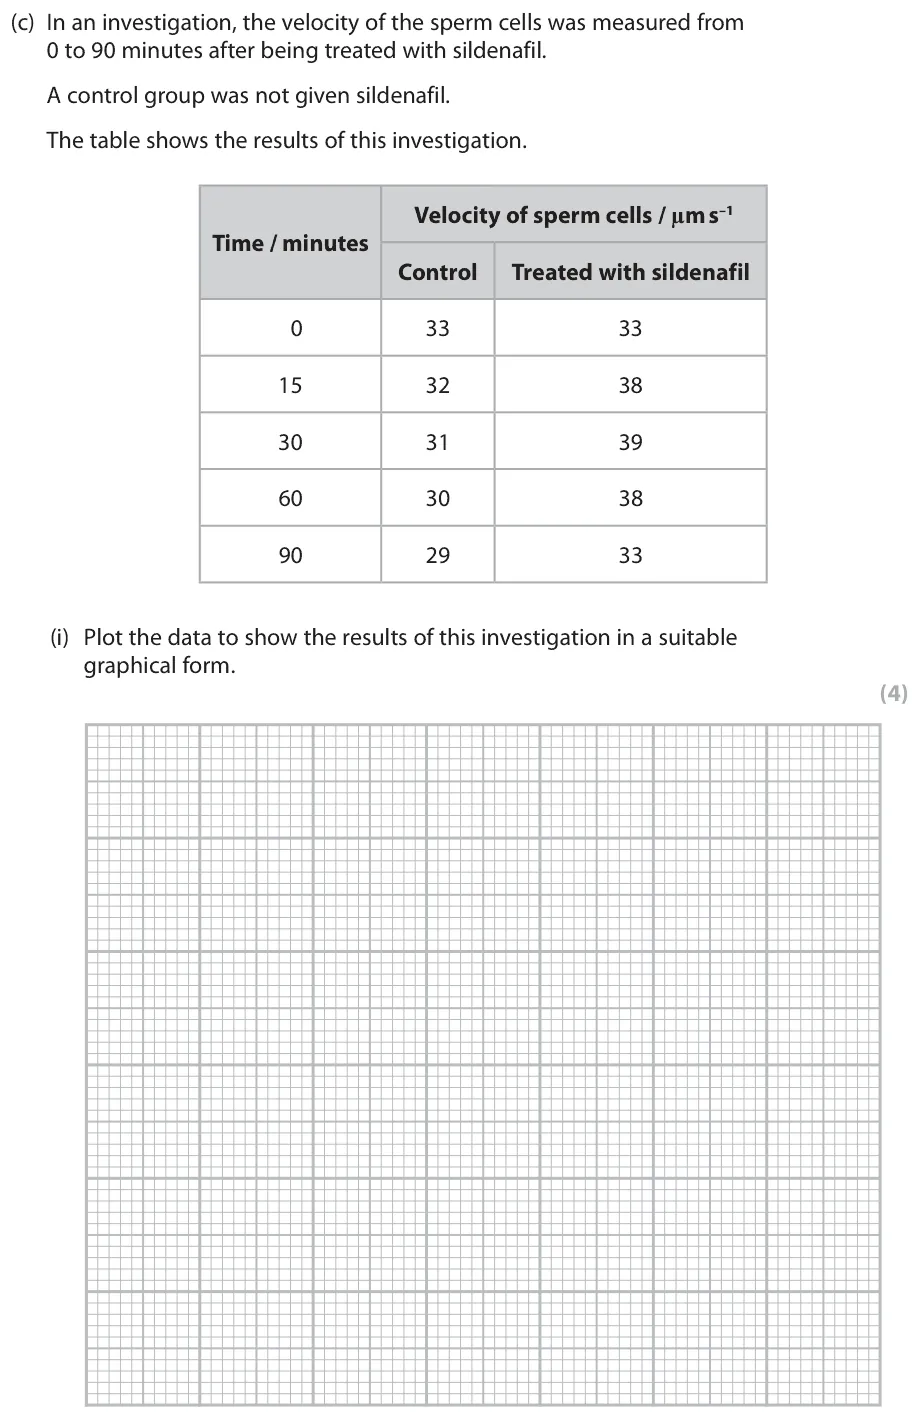
AS Paper 2 · June 2025 · Q7(c)(i) · 4 marks · Hard
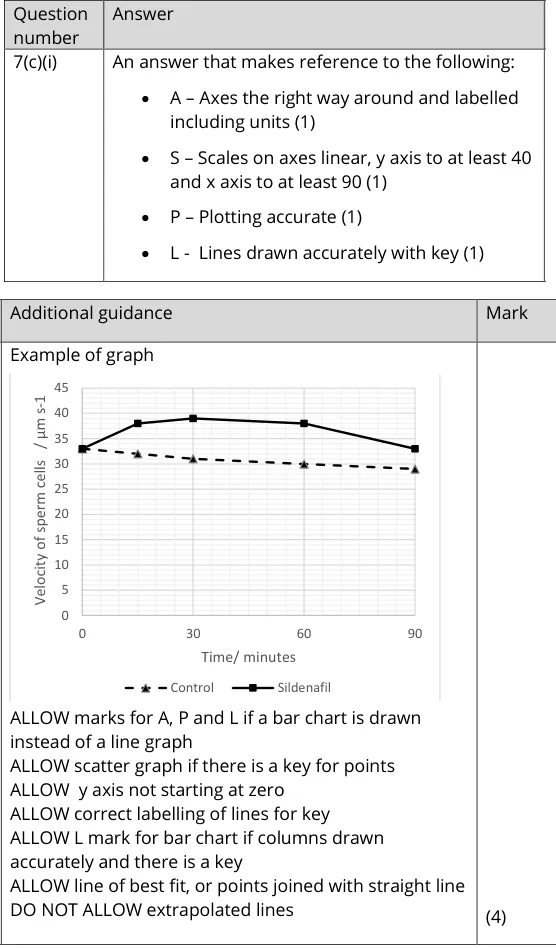
Plot the velocity of sperm cells with and without sildenafil in a suitable graphical form.
Show the mark scheme
Tap an image to open it full size.
From the examiners' report: Few gained all 4 marks. Many drew a bar graph for numerical data best shown as a line graph, which capped them at 3 marks because they could not gain the mark for linear scales. Other losses were incorrect scales and labels without units.
Question 7
AS Paper 1 · June 2017 · Q5(b)(i) · 1 mark
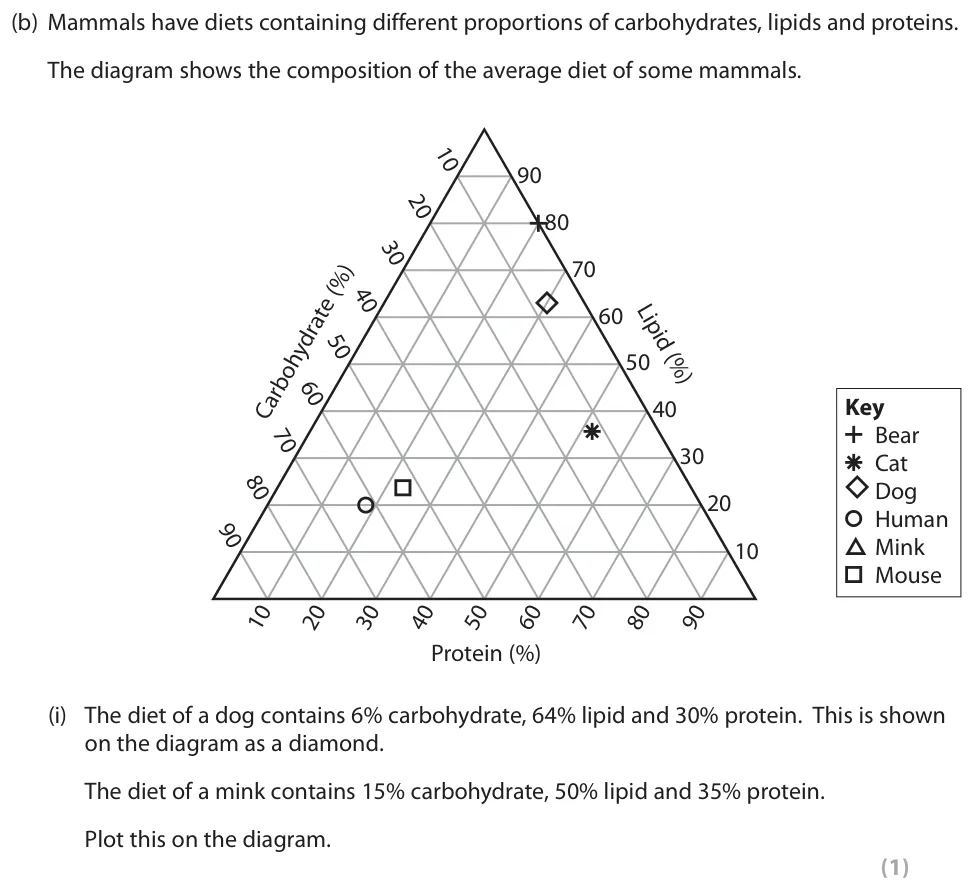
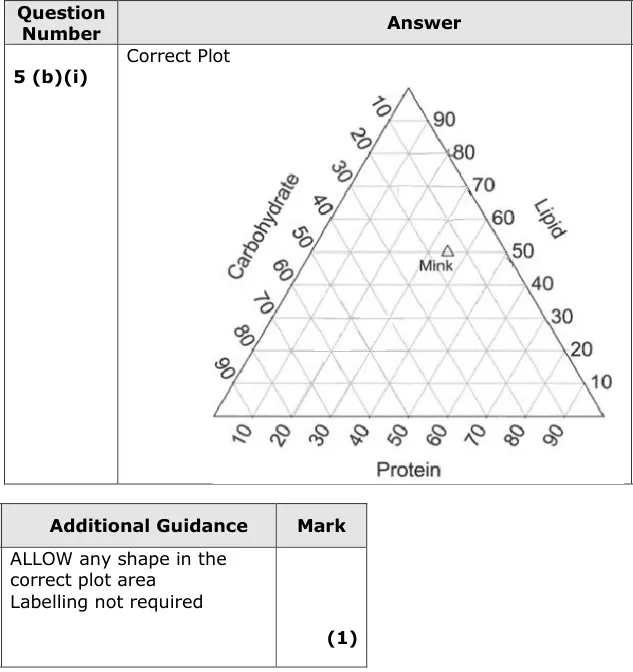
Plot the composition of a mink's diet on a triangular diagram.
Show the mark scheme
Tap an image to open it full size.
From the examiners' report: The vast majority plotted it correctly, using the dog's diet in the stem as a guide. Some did not use the triangle symbol for mink from the key.
Linear relationships: y = mx + c (MS 3.3)
Question 8
AS Paper 2 · June 2016 · Q1(c)(i) · 2 marks
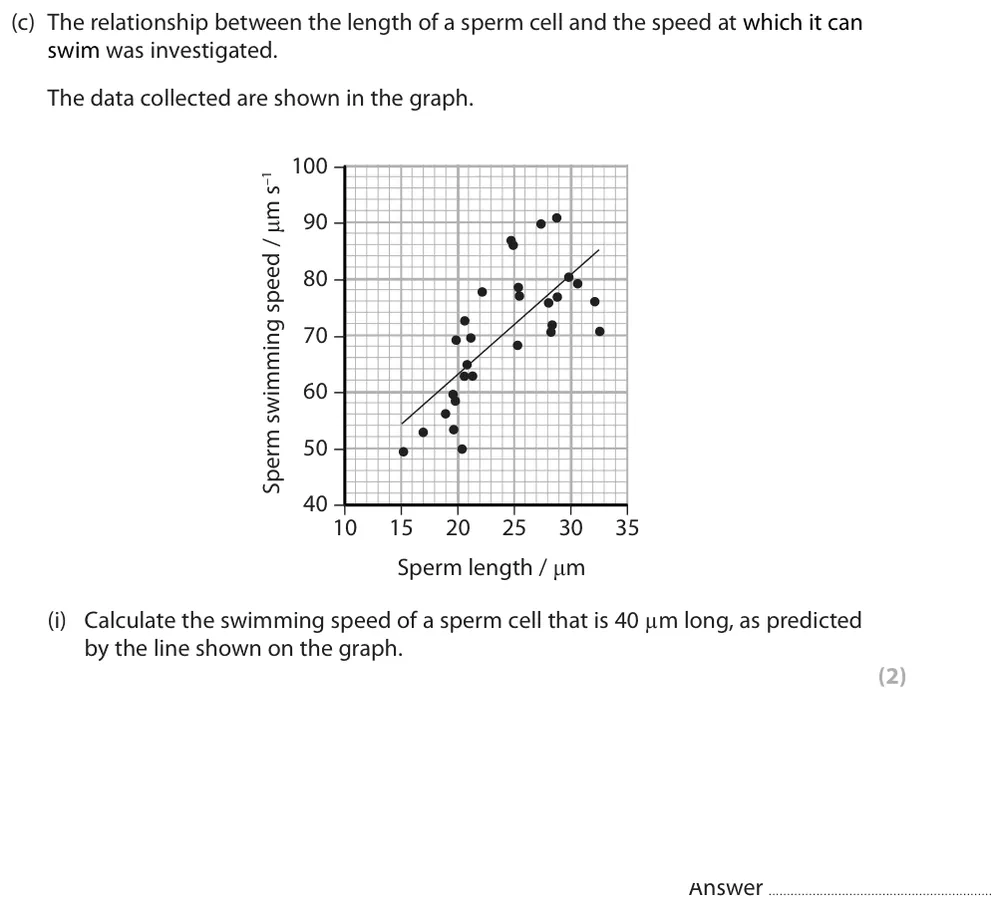
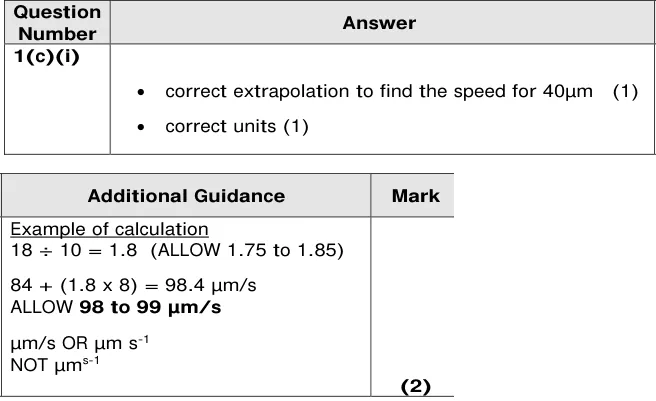
Use the line on a graph to predict the swimming speed of a sperm cell longer than any shown.
Show the mark scheme
Tap an image to open it full size.
From the examiners' report: Many found the gradient and used it to extrapolate. Extending the axis and reading the value from the graph was rarely accurate enough. Many lost the unit mark, which could be taken from the graph; writing the 's' as a superscript was a surprisingly common mistake.
Question 9
AS Paper 2 · June 2016 · Q1(c)(ii) · 2 marks
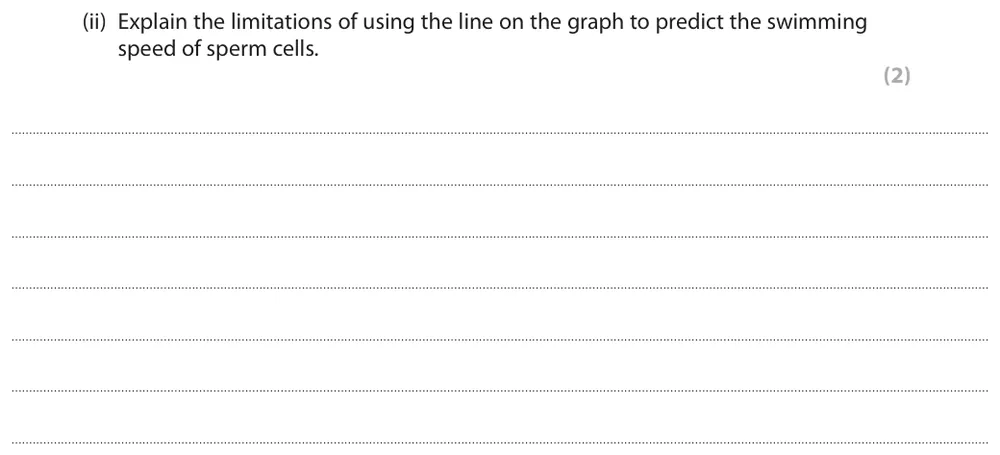
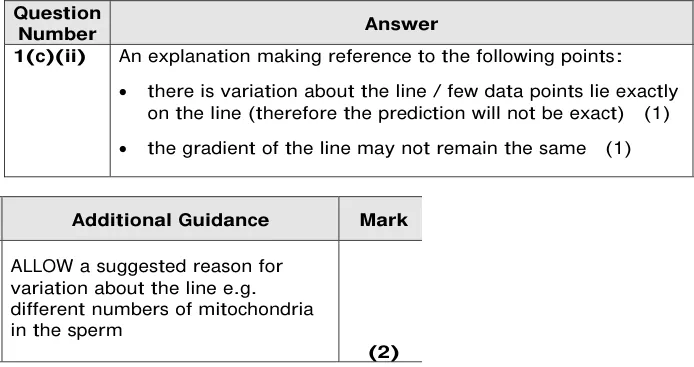
Explain the limitations of using the line to predict swimming speed.
Show the mark scheme
Tap an image to open it full size.
From the examiners' report: 'Limitations' and two marks mean two distinct points. Most mentioned the variation of the data about the line; few added that the gradient may not stay the same.
Question 10
A level Paper 3 · June 2024 · Q5(c)(i) · 2 marks
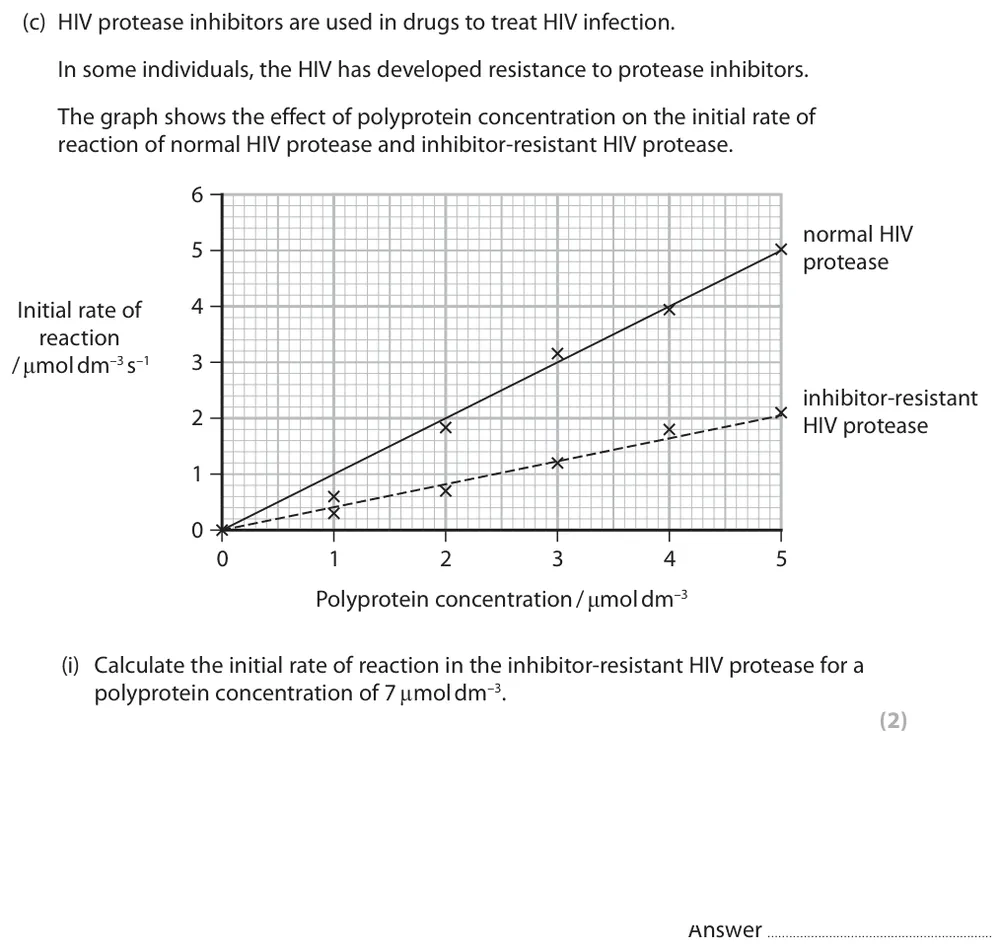
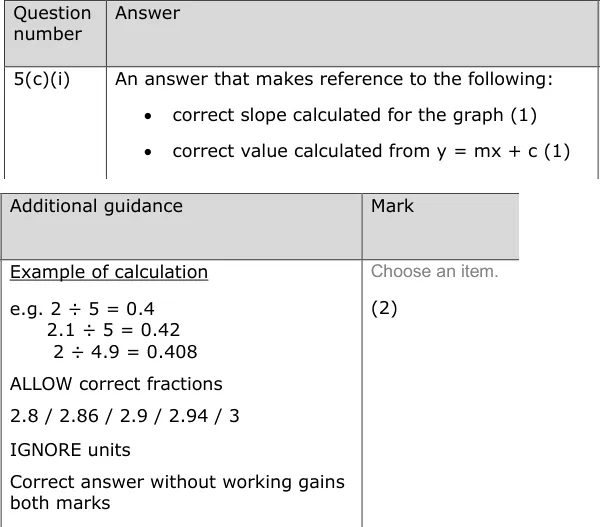
Use the slope of a straight-line graph to calculate the initial rate of reaction at a substrate concentration beyond the data.
Show the mark scheme
Tap an image to open it full size.
From the examiners' report: Many found the slope but went no further and gained one mark. Use the gradient in y = mx + c to find the rate at the new concentration; clear working earns the intermediate mark.
Rate of change from a graph (MS 3.5)
Question 11
AS Paper 1 · June 2016 · Q2(a)(i) · 2 marks
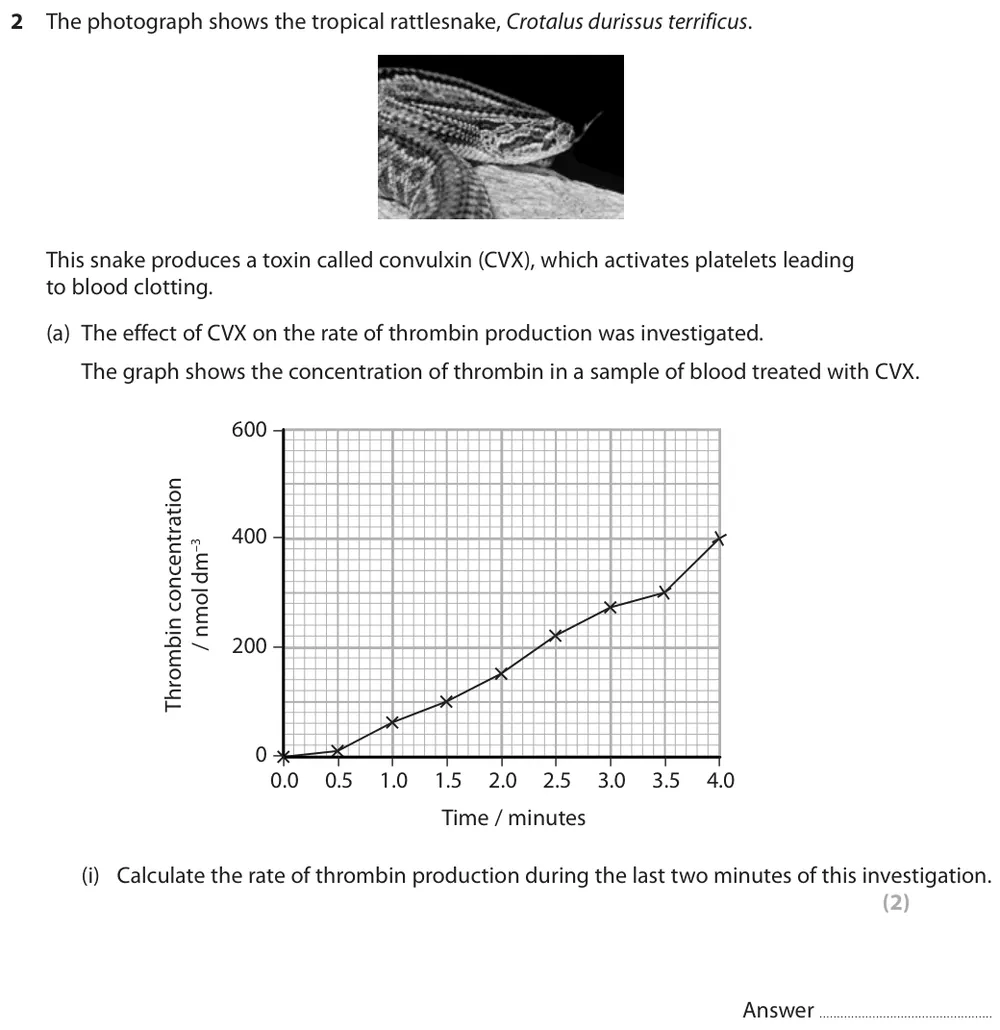
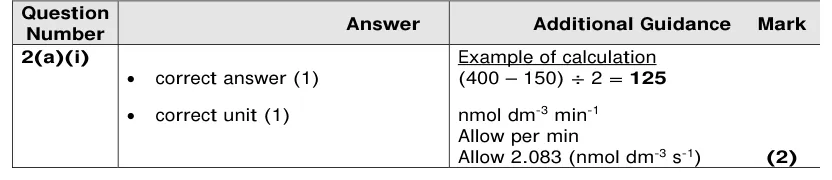
Calculate the rate of thrombin production over the last two minutes of an investigation.
Show the mark scheme
Tap an image to open it full size.
From the examiners' report: A significant number gave a rate per 2 minutes instead of per minute. Many gave no unit or a wrong one: adapt the units from the graph's axes.
Question 12
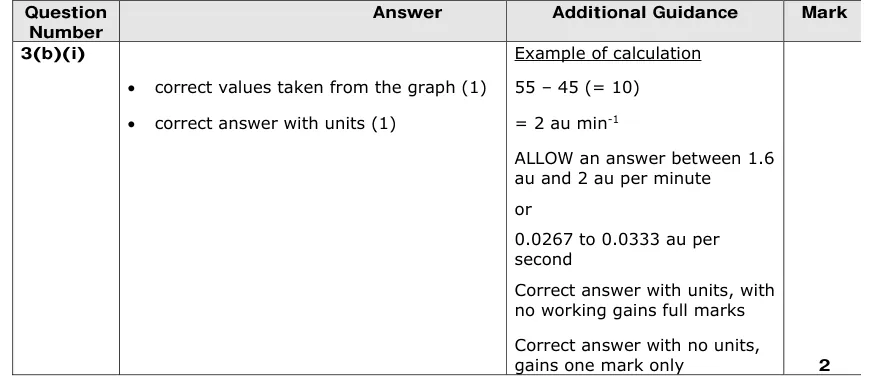
A level Paper 1 · June 2017 · Q3(b)(i) · 2 marks
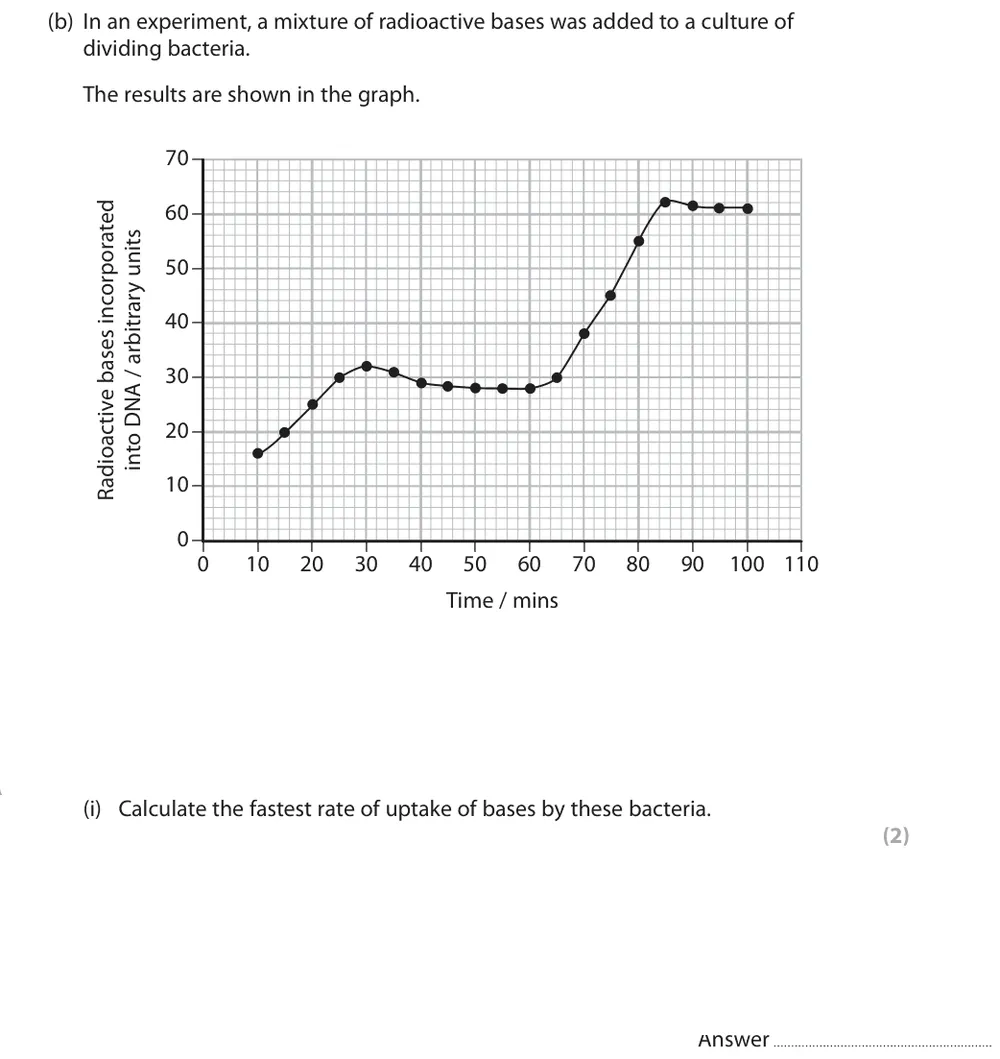
Calculate the fastest rate of uptake of bases by dividing bacteria.
Show the mark scheme
Tap an image to open it full size.
From the examiners' report: Most coped well. The main reason for losing a mark was leaving out the units. A range of answers was accepted because you had to judge where to draw the gradient.
Question 13
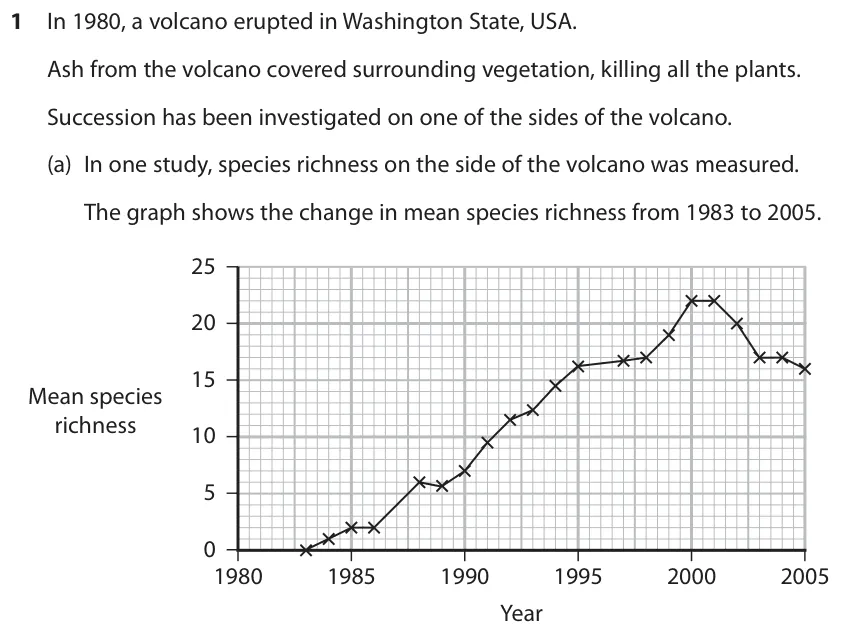
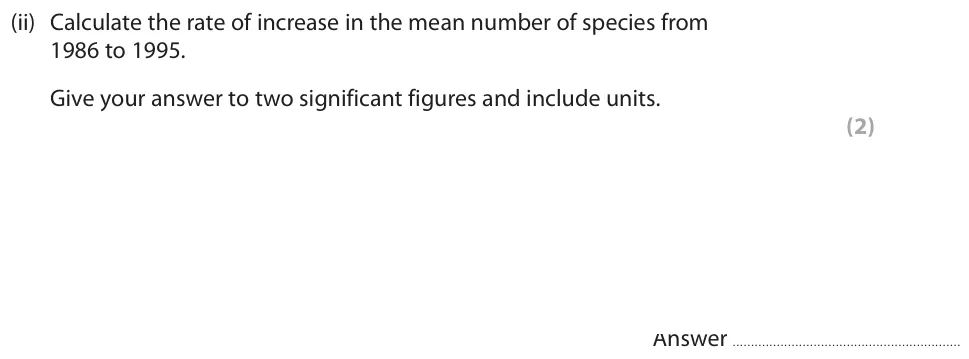
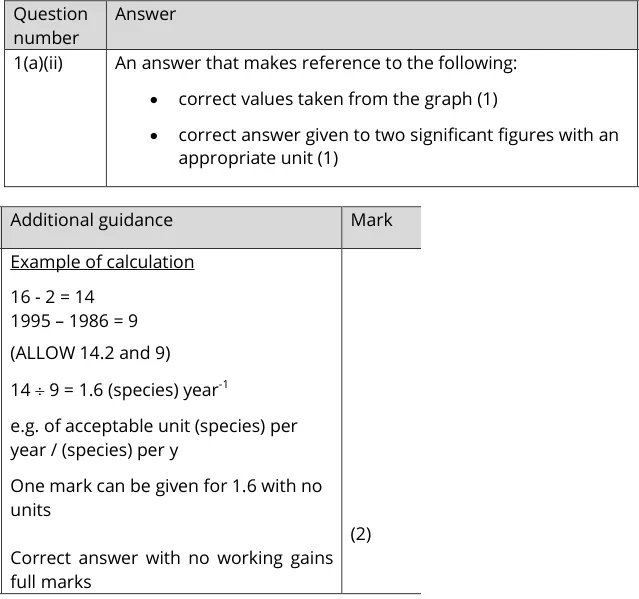
A level Paper 3 · June 2025 · Q1(a)(ii) · 2 marks
Calculate the rate of increase in the mean number of species over nine years, to two significant figures with units.
Information from earlier in this question:
Show the mark scheme
Tap an image to open it full size.
From the examiners' report: Many scored nothing. Some worked out the number of years wrongly; others lost a mark for not using two significant figures, for leaving out the unit or for using an incorrect unit.
Question 14
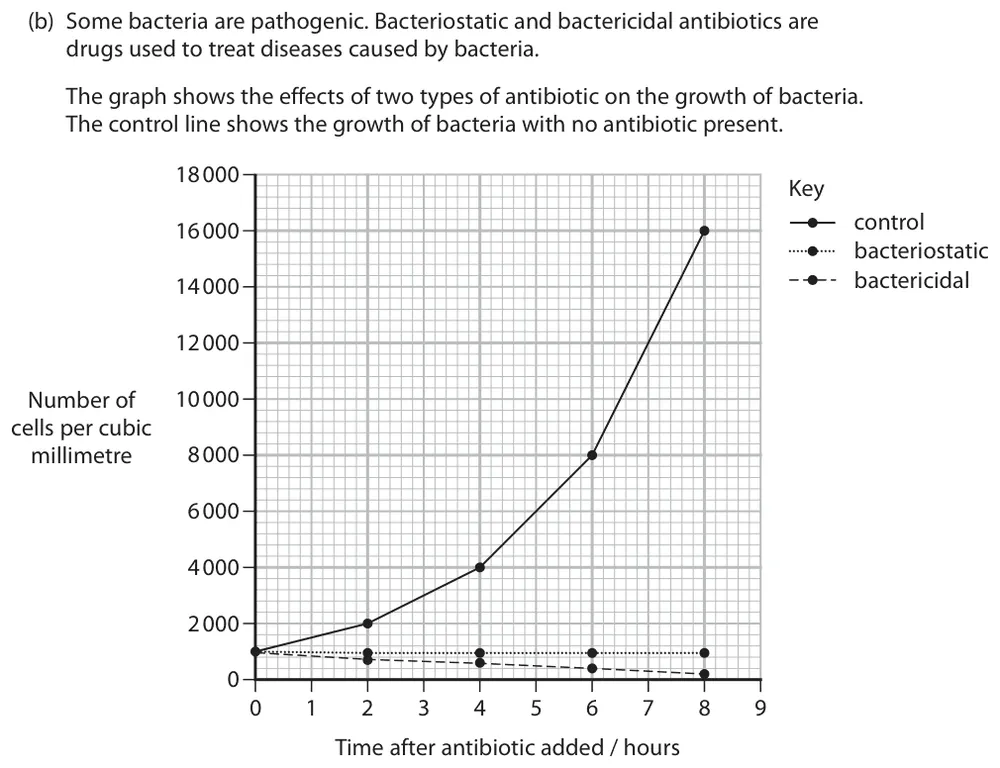
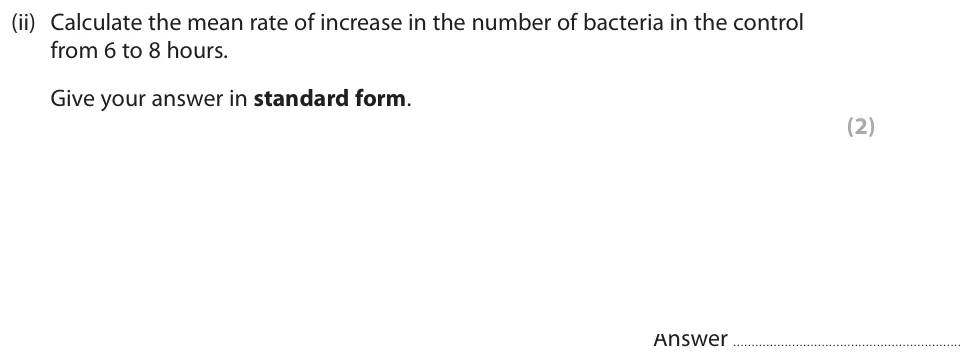
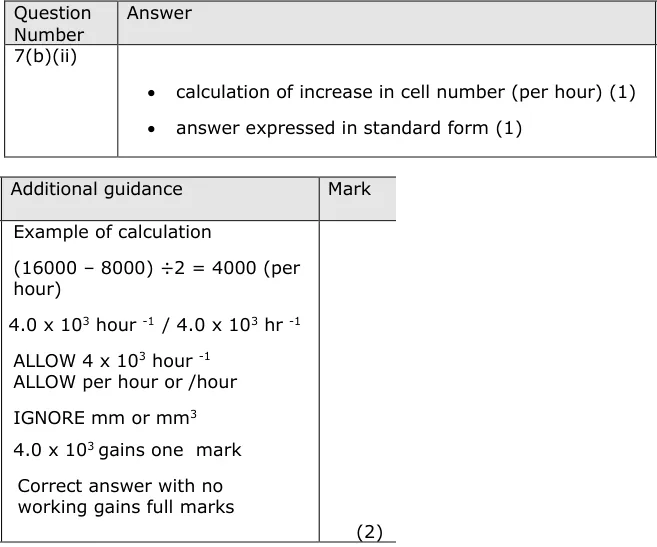
A level Paper 1 · June 2023 · Q7(b)(ii) · 2 marks
Calculate the mean rate of increase in the number of bacteria and give it in standard form.
Information from earlier in this question:
Show the mark scheme
Tap an image to open it full size.
From the examiners' report: Many did the calculation and converted it to standard form, but lost a mark because they did not give the unit.
Gradient of a tangent to a curve (MS 3.6)
Question 15
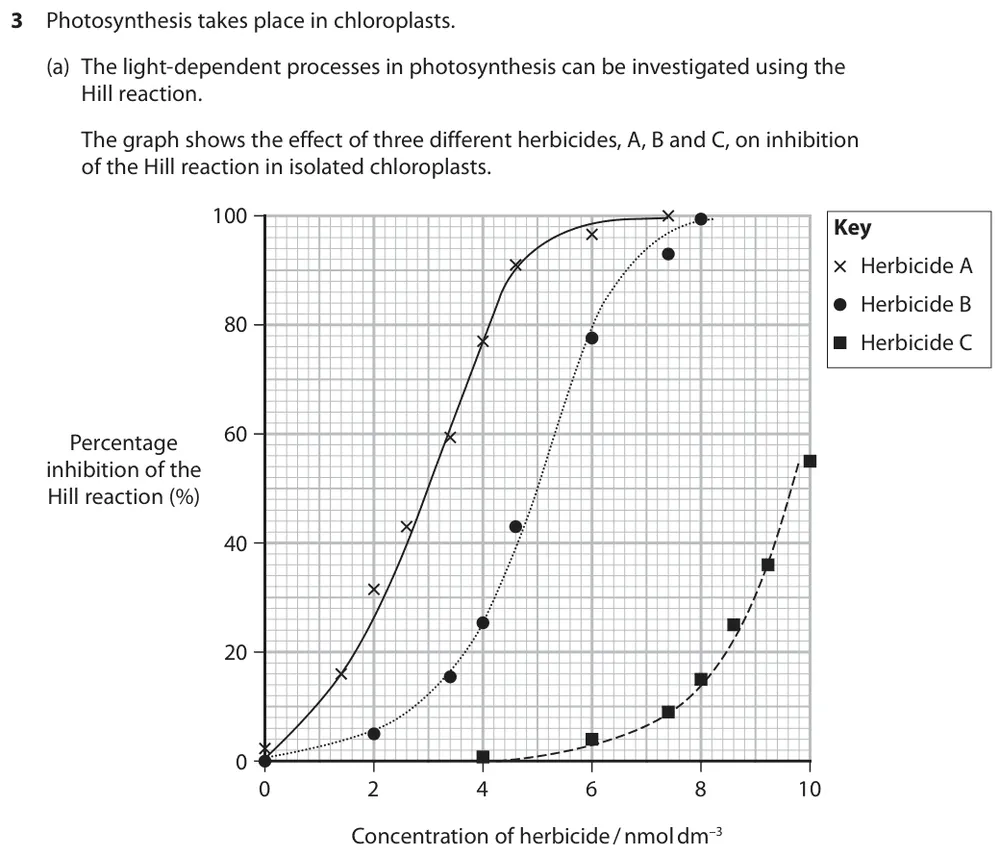
A level Paper 3 · June 2024 · Q3(a)(ii) · 2 marks
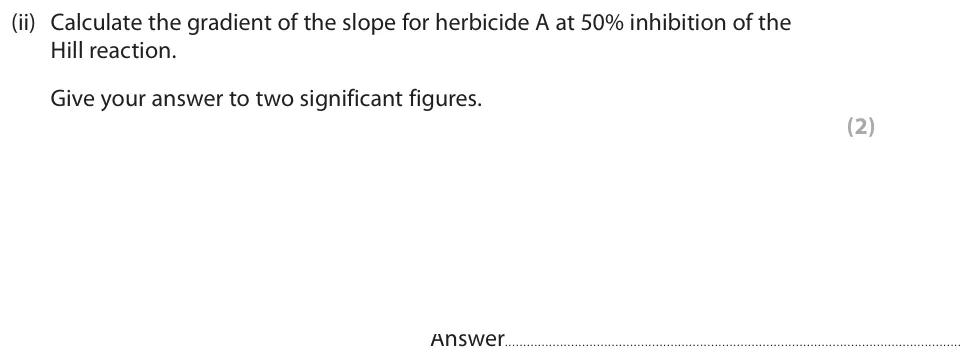
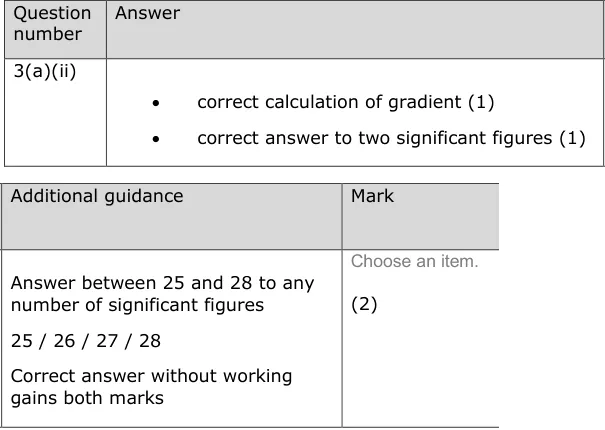
Calculate the gradient of a curve at 50% inhibition of the Hill reaction, to two significant figures.
Information from earlier in this question:
Show the mark scheme
Tap an image to open it full size.
From the examiners' report: Some confused the y and x axes, and some ignored the instruction to give two significant figures (two decimal places is not the same). The second mark depended on a correct gradient.
Areas of circles (MS 4.1)
Question 16
AS Paper 2 · June 2023 · Q6(a)(i) · 2 marks
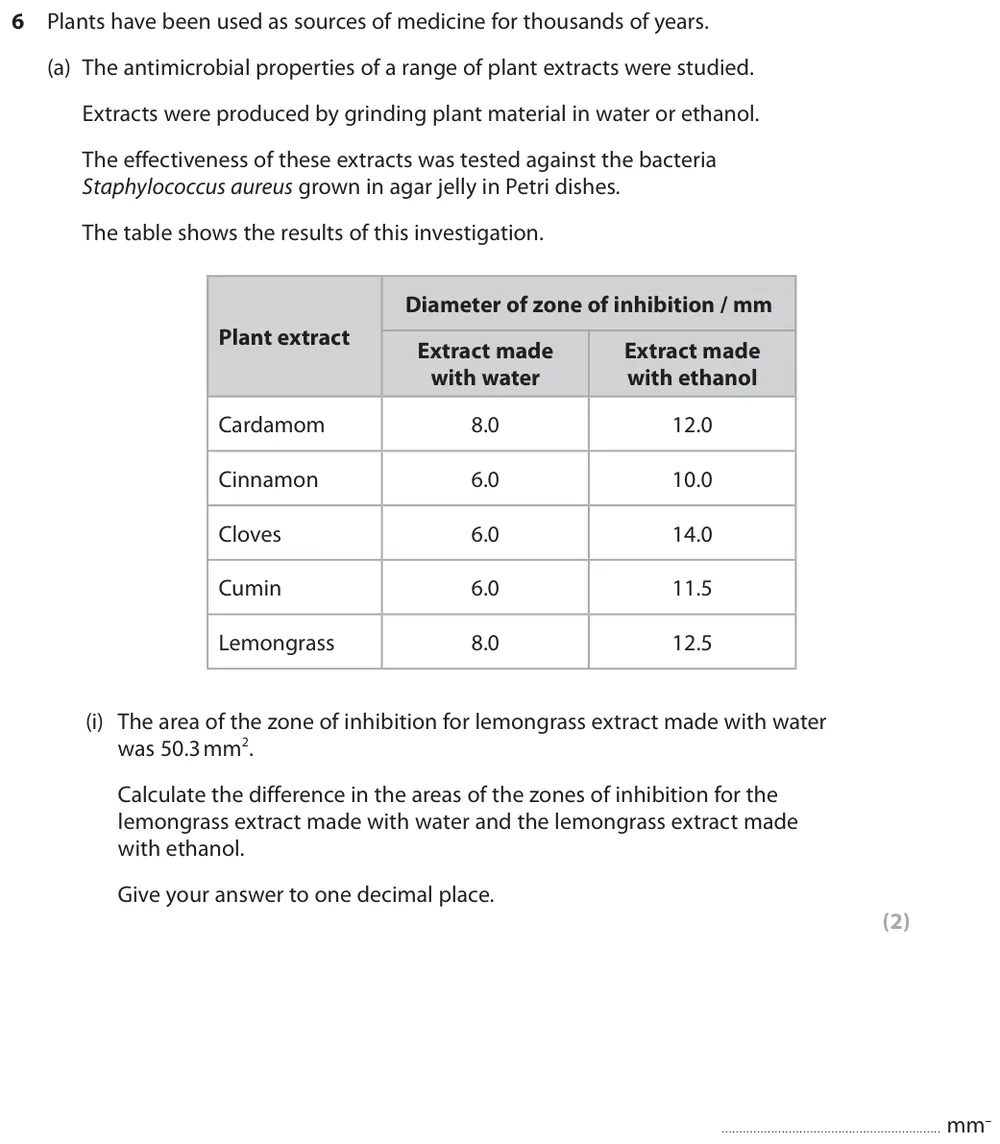
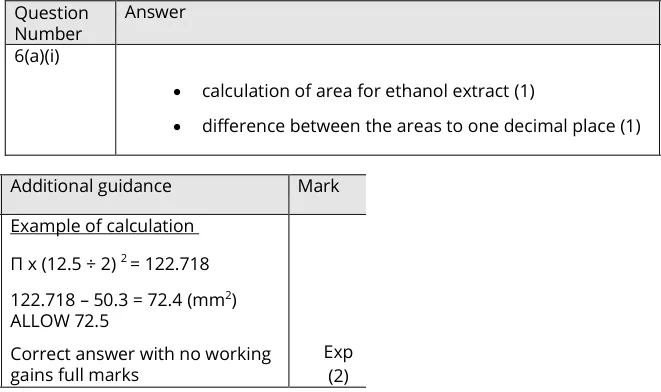
Calculate the area of a zone of inhibition and the difference from another area, to one decimal place.
Show the mark scheme
Tap an image to open it full size.
From the examiners' report: Read all parts of the question: answers not given to one decimal place, as instructed, gained only one mark.
Question 17
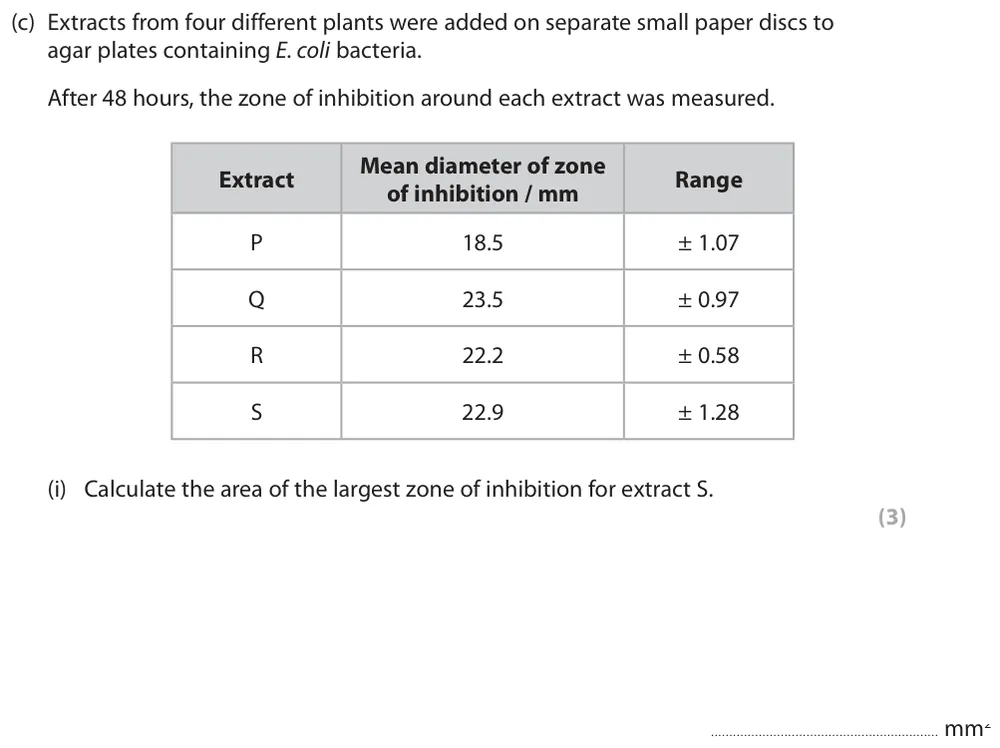
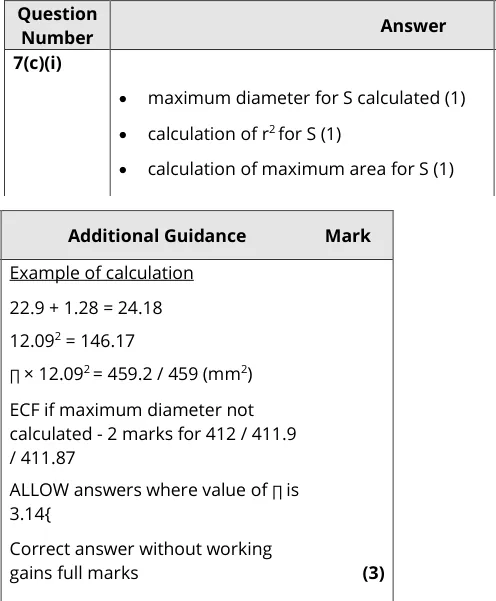
AS Paper 2 · June 2019 · Q7(c)(i) · 3 marks
Calculate the area of the largest zone of inhibition for one plant extract, using the mean diameter and its range.
Show the mark scheme
Tap an image to open it full size.
From the examiners' report: Most scored well, with more than half reaching the correct answer. Some chose the wrong sample.
Question 18
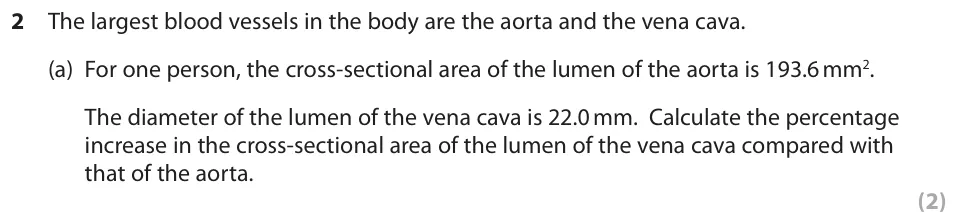
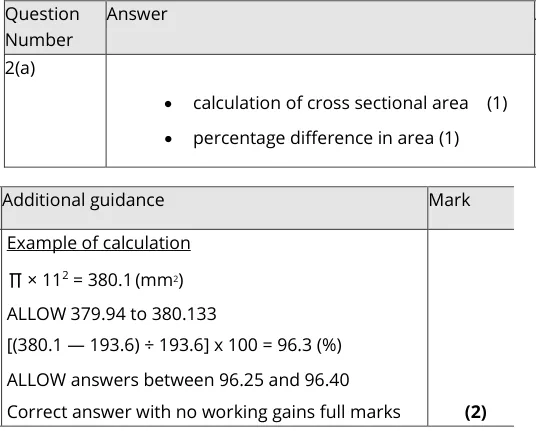
A level Paper 3 · June 2019 · Q2(a) · 2 marks
Calculate the percentage increase in the cross-sectional area of the vena cava compared with the aorta.
Show the mark scheme
Tap an image to open it full size.
From the examiners' report: Many calculated the area of the vena cava for one mark but did not finish correctly, often because they calculated the decrease from the vena cava to the aorta instead of the increase. Lay out your working neatly.
Question 19
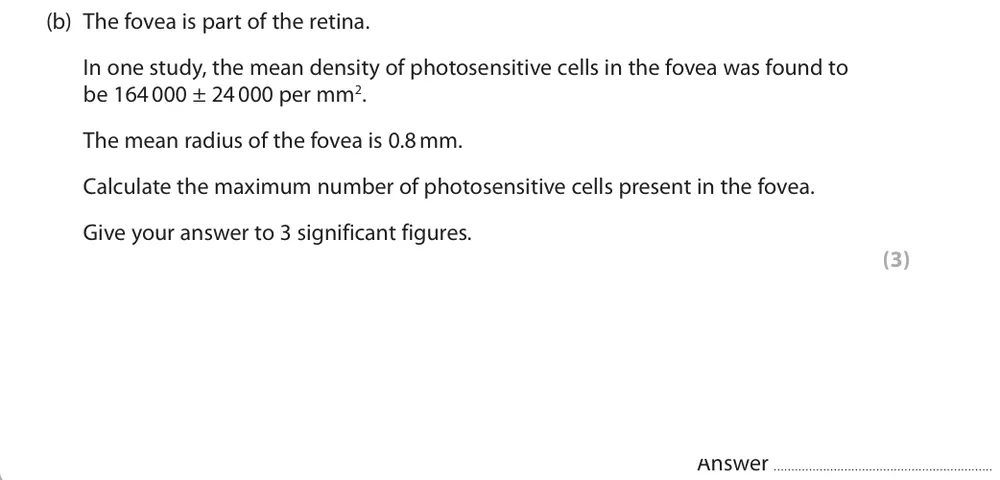
A level Paper 2 · June 2025 · Q4(b) · 3 marks
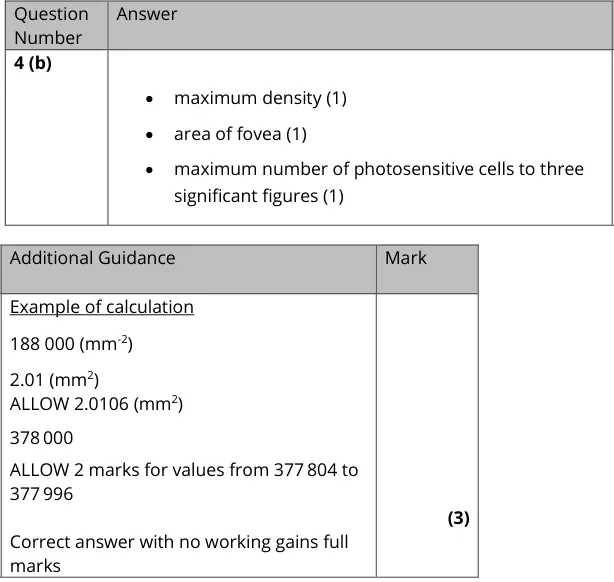
Calculate the maximum number of photosensitive cells in the fovea, to three significant figures.
Show the mark scheme
Tap an image to open it full size.
From the examiners' report: Most did this well, though a few did not give three significant figures. Show each stage: some correctly found the maximum density and the area, then divided instead of multiplying.
Where students lose marks (from Pearson examiners' reports and mark schemes)
Each point below comes from the examiners' reports and mark schemes, and is followed by wording that gained marks.
Rate per minute, not per two minutes. A significant number gave the rate per 2 minutes, and many gave no unit or an incorrect one.
✔ Gains credit: '(400 – 150) ÷ 2 = 125 nmol dm⁻³ min⁻¹.'
Write the unit even when the line has none. The most common reason for one mark was a correct heart rate with no unit.
✔ Gains credit: 'Correct figures from graph, e.g. 120 and 1.6 or 60 and 0.8; 120 ÷ 1.6 = 75 bpm.'
Numbers over time need a line graph. Many drew a bar graph for numerical data, which capped them at 3 marks.
✔ Gains credit: 'Axes the right way around and labelled, including units; scales on axes linear; plotting accurate; lines drawn accurately with key.'
Extrapolate with the gradient. Some extended the axis and read the value from the graph, which was rarely accurate enough, and many left out the units.
✔ Gains credit: '18 ÷ 10 = 1.8; 84 + (1.8 × 8) = 98.4 µm/s; units µm/s or µm s⁻¹, not µms⁻¹.'
Use the slope to reach the new value. A number calculated the slope of the graph but went no further.
✔ Gains credit: 'Correct slope calculated, e.g. 2 ÷ 5 = 0.4; correct value calculated from y = mx + c: 2.8.'
Ratios are written to 1. Some gave ratios such as 0.6 : 0.657, or wrote the ratio the wrong way round.
✔ Gains credit: '0.86 : 1 (ALLOW values between 0.8 : 1 and 0.92 : 1).'
Percentage increase uses the starting value. Many calculated the decrease from the vena cava instead of the increase from the aorta.
✔ Gains credit: 'π × 11² = 380.1 mm²; [(380.1 – 193.6) ÷ 193.6] × 100 = 96.3%.'
Density times area gives a number of cells. Some correctly found the maximum density and the area of the fovea, then divided instead of multiplying.
✔ Gains credit: 'Maximum density 188 000 mm⁻²; area of fovea 2.01 mm²; maximum number of photosensitive cells to three significant figures 378 000.'
Download the questions
Download the PDF pack (19 questions, mark schemes at the end)
Keep practising
- Edexcel SNAB A level Biology revision resources by topic
- Arithmetic and Numerical Computation (Maths Skills MS0): Edexcel SNAB A Level Biology Exam Questions
- Handling Data and Statistics (Maths Skills MS1): Edexcel SNAB A Level Biology Exam Questions
- Algebra and Equations (Maths Skills MS2): Edexcel SNAB A Level Biology Exam Questions
- All Edexcel SNAB exam questions by topic
- Edexcel SNAB A level Biology past papers, mark schemes and examiners' reports
- Edexcel SNAB A level Biology grade boundaries
- Message Tom on WhatsApp about one-to-one Edexcel SNAB tutoring or an Edexcel group class
Questions, mark schemes and examiners' report extracts © Pearson Education Ltd.