

Handling data (MS 1) is the second group of mathematical skills in the Edexcel A level Biology A (Salters-Nuffield) specification. It covers significant figures, means and the mode, tables, bar charts and frequency diagrams, probability, sampling, correlation, magnification and other order of magnitude calculations, statistical tests, standard deviation and uncertainty. In biology questions you meet these skills in context: plotting deaths from heart disease, using a genetic diagram to find the chance of a child inheriting a condition, working out the width of a DNA molecule from a magnified image, deciding why overlapping ranges stopped a drug trial, or explaining what p = 0.05 means. Maths questions like these appear on every paper. Questions marked AS are from the AS papers (8BN0); the rest are from the A level papers (9BN0).
The examiners' reports give clear warnings. Use the data in the table to judge how many significant figures to give, and follow any instruction on significant figures exactly. Read every piece of information in the question before you pick your values. Convert units carefully, divide the image size by the magnification and give the answer in the unit asked for. When you comment on a graph, make as many separate points as there are marks. Say 'correlation', not 'relationship', and use the term 'significant difference'. When you explain a p value, link the 5% probability to the results occurring by chance.
Studying Edexcel SNAB and want more help? If you'd like to arrange one-to-one Edexcel tutoring, or to register your interest in an Edexcel group class, message Tom on WhatsApp using the link at the bottom of this page.
What you need first
Each question on this page assumes you're secure on these ideas. If any of them feels shaky, look it up before you start.
- Actual size = image size ÷ magnification; 1 mm = 1000 µm and 1 µm = 1000 nm.
- A mean is the total of the values divided by the number of values.
- A genetic diagram shows the parents' genotypes, their gametes and the possible offspring genotypes.
- Percentage change = difference ÷ starting value × 100.
Key terms
These words come up in the questions and mark schemes. Examiners expect you to use them exactly.
- Significant figures: the digits in a number that carry meaning, counted from the first non-zero digit.
- Mode: the value that occurs most often in a set of data.
- Correlation: a relationship between two variables: positive when both increase together, negative when one increases as the other decreases.
- Magnification: how many times larger the image is than the real object: image size ÷ actual size.
- Null hypothesis: a statement that there is no difference, or no relationship, between the groups or variables being tested.
- Significance level (p): the probability that the results occurred by chance; biologists usually use p = 0.05 (5%).
- Critical value: the value from a table that a calculated test statistic is compared with to decide whether a result is significant.
- Standard deviation: a measure of the spread of data around the mean; ± values show the spread or range of the data.
What these questions cover
Every question on this page tests one of these mathematical skills listed in the Pearson Edexcel A level Biology A (Salters-Nuffield) specification (9BN0).
- MS1.1: Use an appropriate number of significant figures
- MS1.2: Find arithmetic means
- MS1.3: Construct and interpret frequency tables and diagrams, bar charts and histograms
- MS1.4: Understand simple probability
- MS1.5: Understand the principles of sampling as applied to scientific data
- MS1.6: Understand the terms mean, median and mode
- MS1.7: Use a scatter diagram to identify a correlation between two variables
- MS1.8: Make order of magnitude calculations
- MS1.9: Select and use a statistical test
- MS1.10: Understand measures of dispersion, including standard deviation and range
- MS1.11: Identify uncertainties in measurements and use simple techniques to determine uncertainty when data are combined
How to use this page
Write your answer on paper before you open the mark scheme. Allow about 1.2 minutes per mark: the 20 questions are worth 41 marks, so about 49 minutes in total. Then mark your answer strictly against the mark scheme and read the examiners' tip underneath it. If you'd rather print the questions, download the PDF pack.
Significant figures and means (MS 1.1, MS 1.2)
Question 1
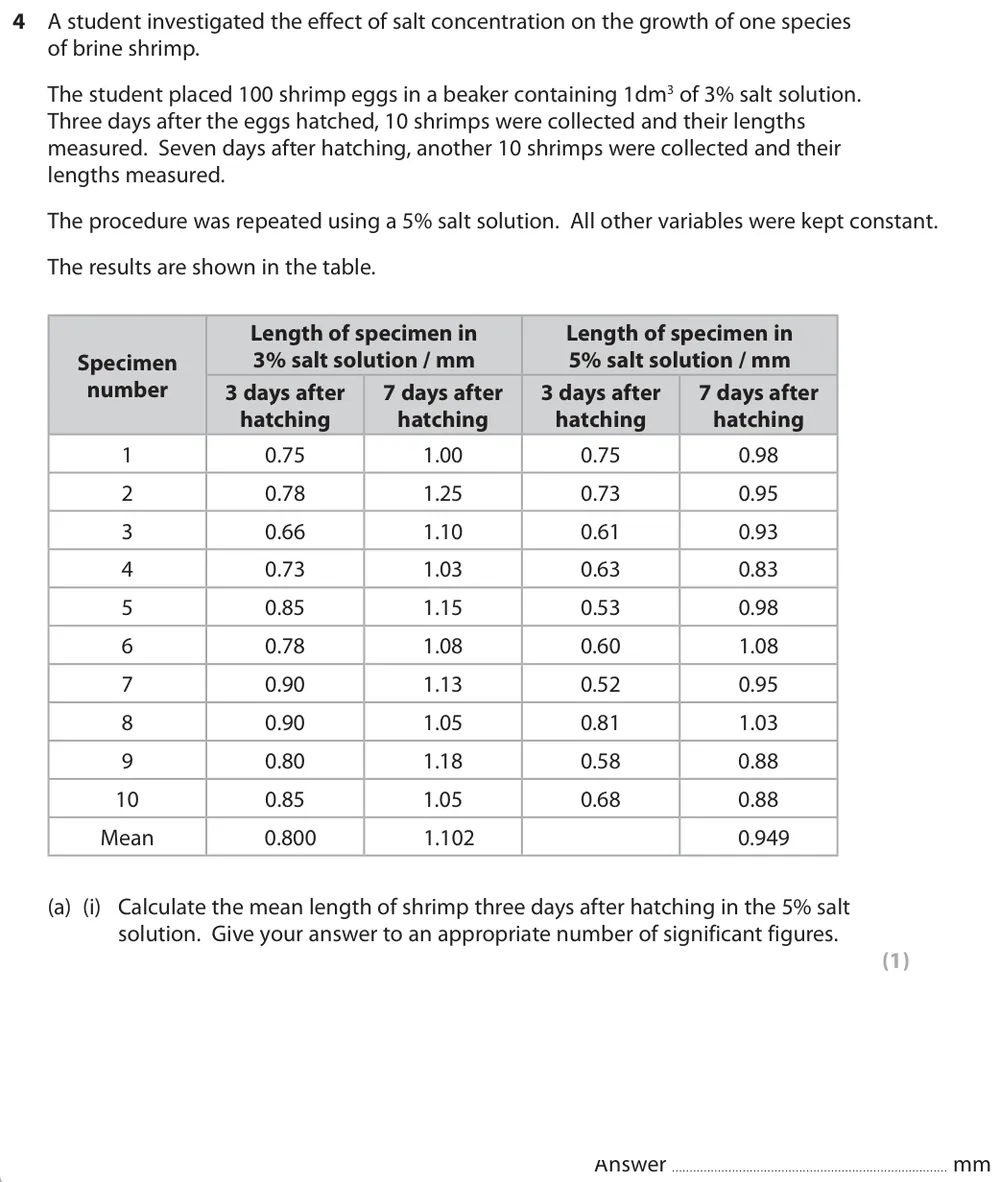
A level Paper 3 · June 2017 · Q4(a)(i) · 1 mark · Easy
Calculate the mean length of ten brine shrimp to an appropriate number of significant figures.
Show the mark scheme

Tap an image to open it full size.
From the examiners' report: Use the data in the table to decide how many significant figures to give, even when you aren't told. Many worked out the mean correctly and then rounded it to fewer figures, or wrote the full value in the table and a rounded one on the answer line.
Question 2
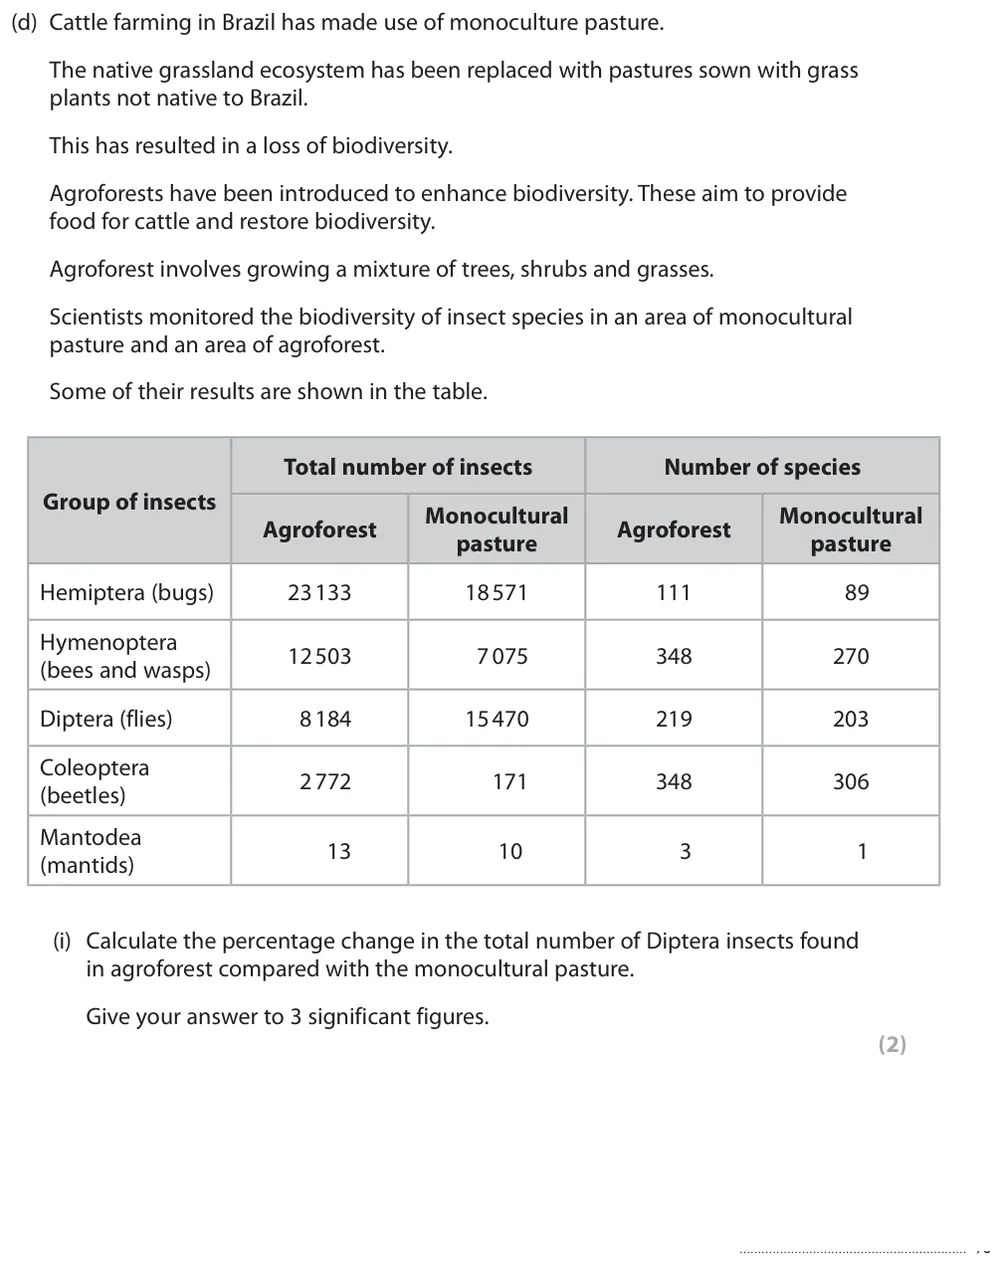
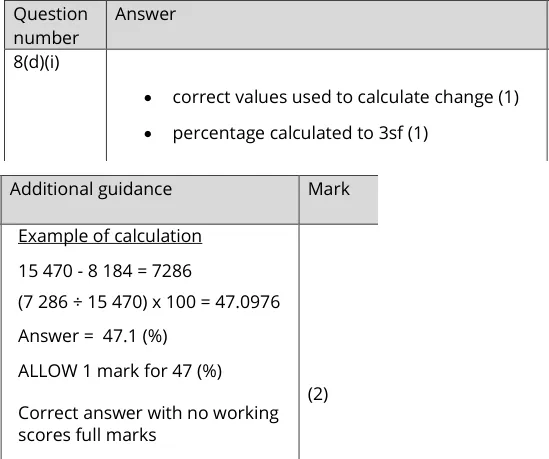
AS Paper 2 · June 2024 · Q8(d)(i) · 2 marks
Calculate the percentage change in the number of flies between two habitats, to three significant figures.
Show the mark scheme
Tap an image to open it full size.
From the examiners' report: About half gained full marks. Many calculated the change correctly and then divided by the wrong value. Even a correct value would have lost a mark if it was not given to three significant figures.
Question 3
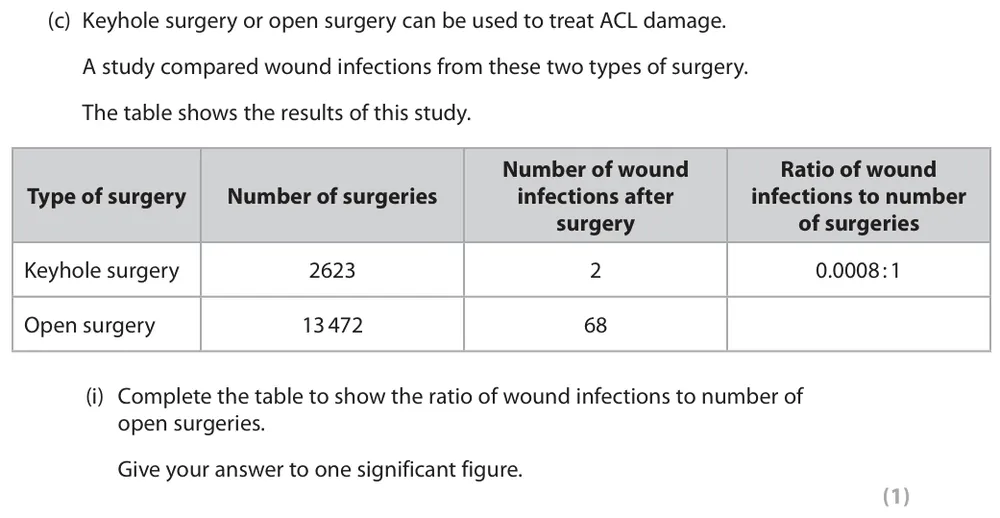
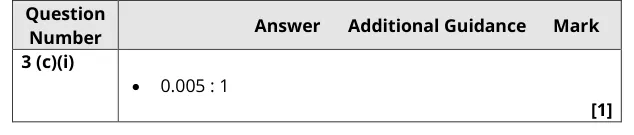
A level Paper 2 · June 2023 · Q3(c)(i) · 1 mark
Complete a table with the ratio of wound infections to open surgeries, to one significant figure.
Show the mark scheme
Tap an image to open it full size.
From the examiners' report: Most got this right. The answer had to be to one significant figure (a value with more figures was not credited) and in the format wound infections : number of surgeries.
Question 4
A level Paper 3 · June 2022 · Q4(a) · 2 marks · Hard
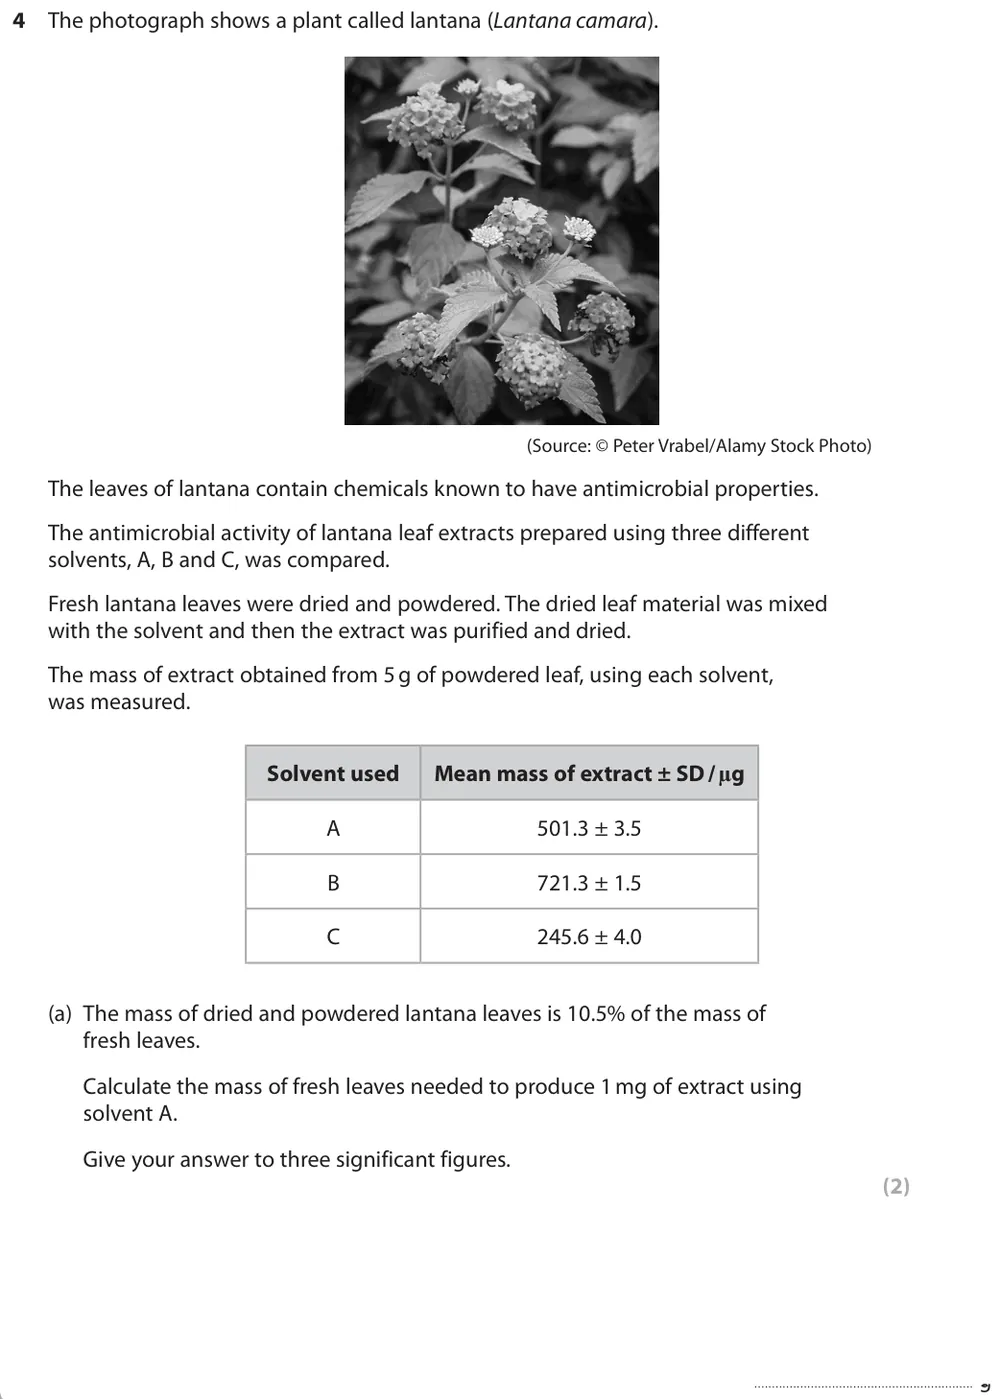
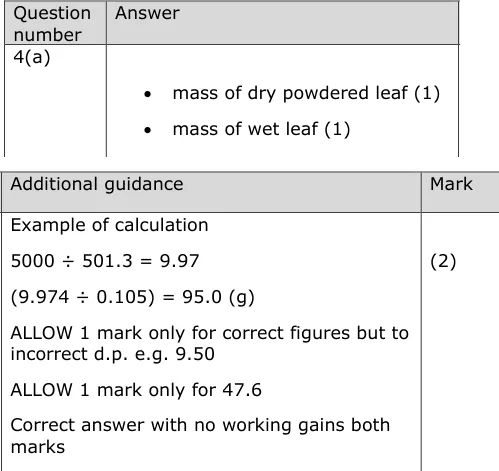
Calculate the mass of fresh leaves needed to produce 1 mg of plant extract, to three significant figures.
Show the mark scheme
Tap an image to open it full size.
From the examiners' report: Many found this difficult. Several did not realise there were two steps and gained one mark for the first step only. Many lost a mark by not giving the final answer to three significant figures.
Tables, graphs and the mode (MS 1.3, MS 1.6)
Question 5
AS Paper 1 · June 2024 · Q7(c) · 4 marks
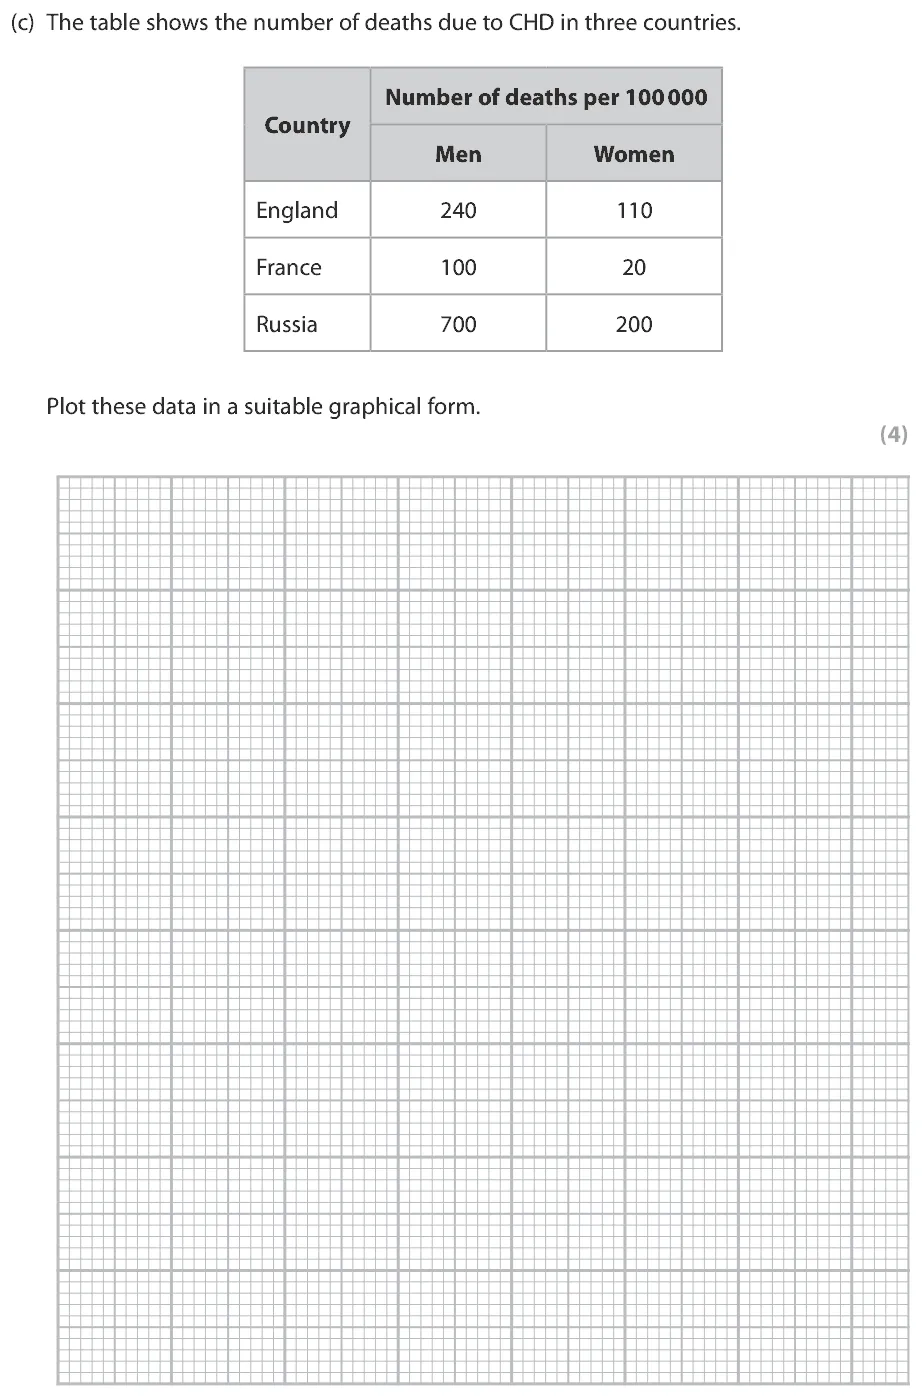
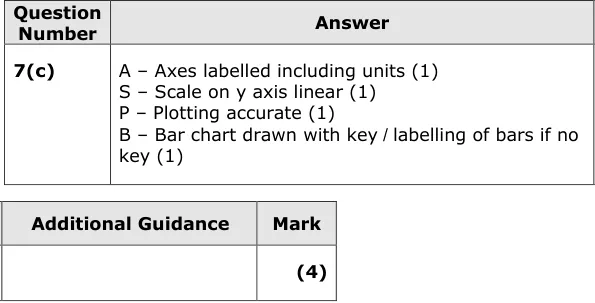
Plot deaths from heart disease in men and women in three countries in a suitable graphical form.
Show the mark scheme
Tap an image to open it full size.
From the examiners' report: Most drew a suitable graph. The most common errors were a scale using less than half of the space provided, inaccurate plotting and leaving out some of the labelling.
Question 6
A level Paper 2 · June 2023 · Q3(b) · 3 marks
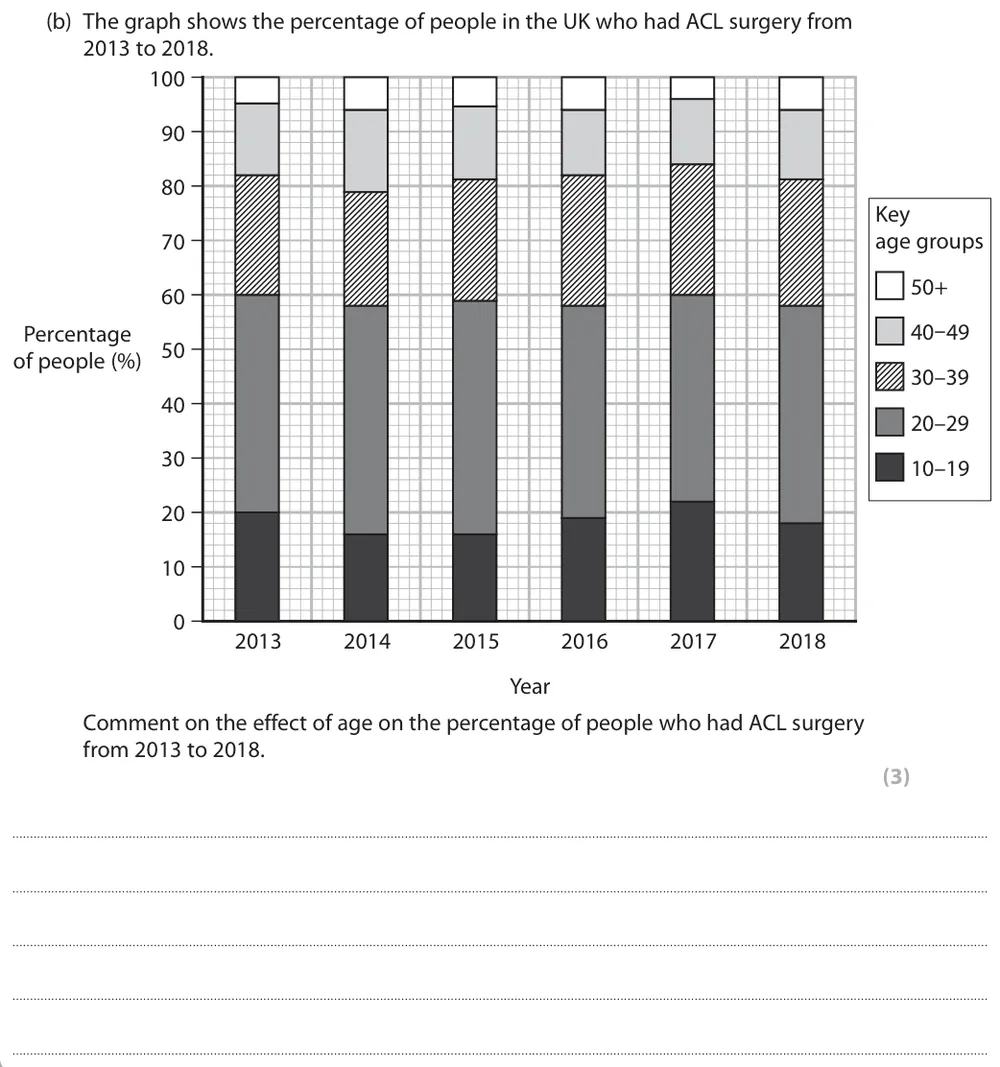
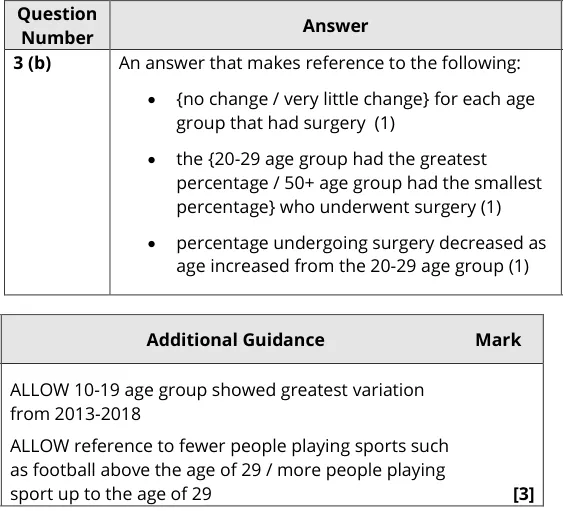
Comment on the effect of age on the percentage of people who had knee ligament (ACL) surgery from 2013 to 2018.
Show the mark scheme
Tap an image to open it full size.
From the examiners' report: Many only considered one feature of the graph despite there being three marks. Be precise: a statement that surgery decreased with age was not credited, because this was only true from the 20–29 age group upwards.
Question 7
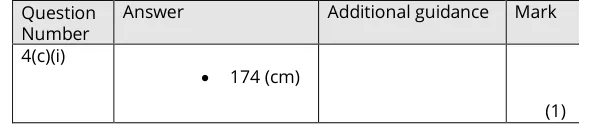
AS Paper 2 · June 2023 · Q4(c)(i) · 1 mark
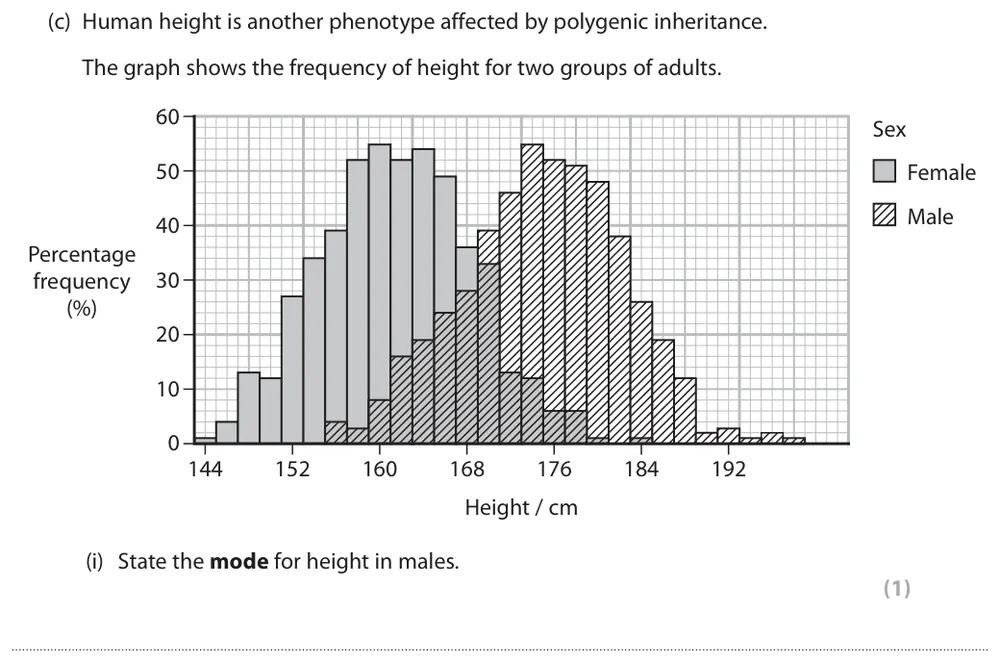
State the mode for height in males from a frequency graph.
Show the mark scheme
Tap an image to open it full size.
From the examiners' report: Most identified the mode correctly. Some gave a range of heights instead of a single value, and others tried to calculate percentages.
Probability (MS 1.4)
Question 8
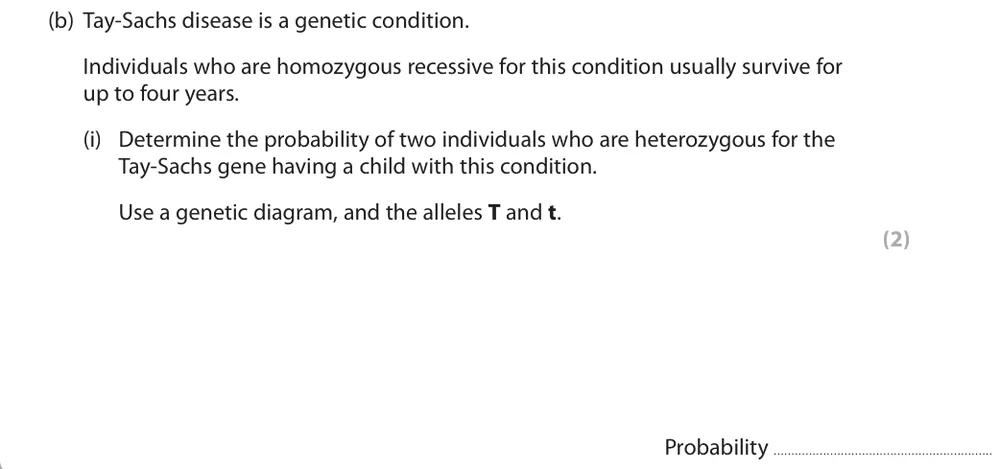
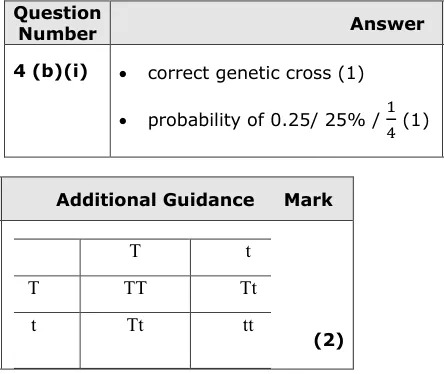
AS Paper 1 · June 2023 · Q4(b)(i) · 2 marks
Use a genetic diagram to find the probability that two carriers of Tay-Sachs disease have a child with the condition.
Show the mark scheme
Tap an image to open it full size.
From the examiners' report: Most used the alleles T and t that were given to draw a correct genetic diagram and gave the correct probability.
Question 9
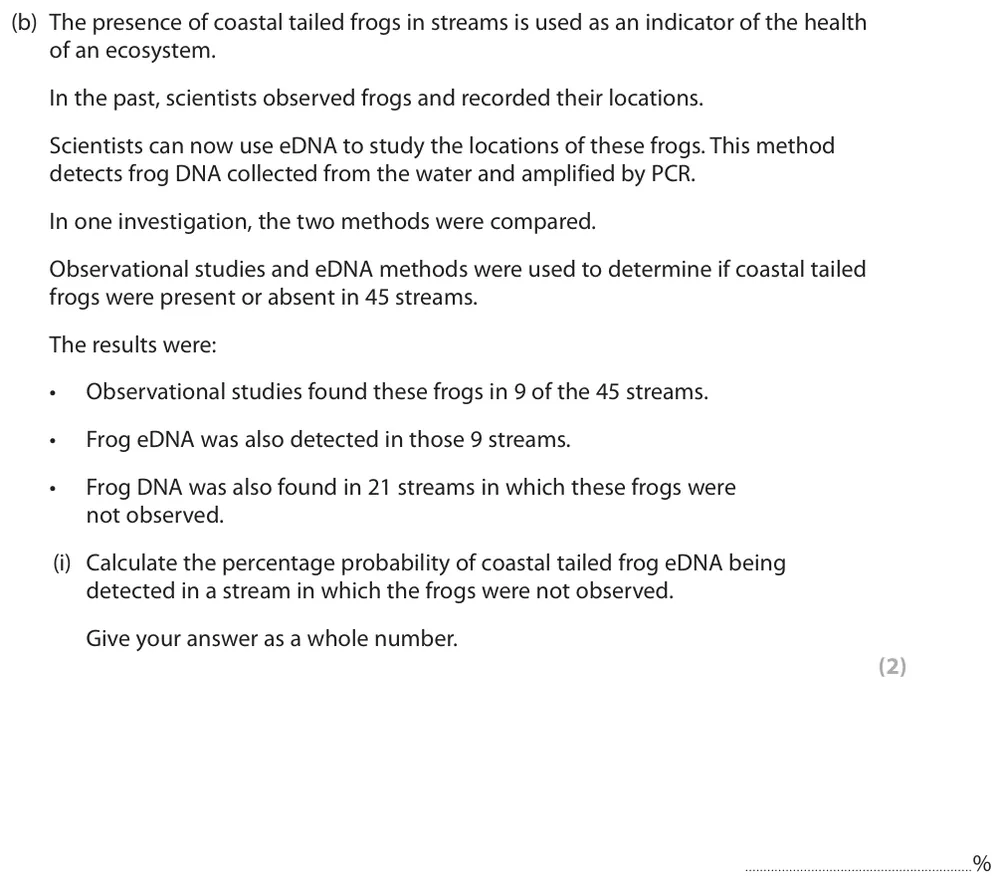
A level Paper 3 · June 2025 · Q6(b)(i) · 2 marks
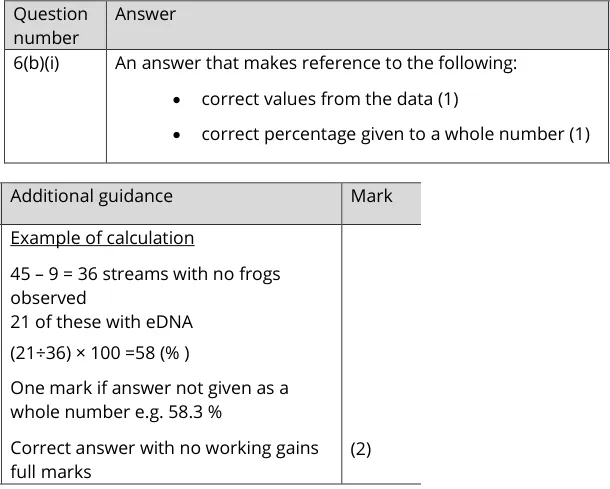
Calculate the percentage probability of finding frog eDNA in a stream where the frogs were not seen.
Show the mark scheme
Tap an image to open it full size.
From the examiners' report: Candidates found this demanding. Many scored zero because they did not use the first bullet point to work out how many streams had no frogs observed. Then give the percentage as a whole number, as asked.
Correlation and sampling (MS 1.5, MS 1.7)
Question 10
AS Paper 2 · June 2016 · Q5(c)(i) · 1 mark
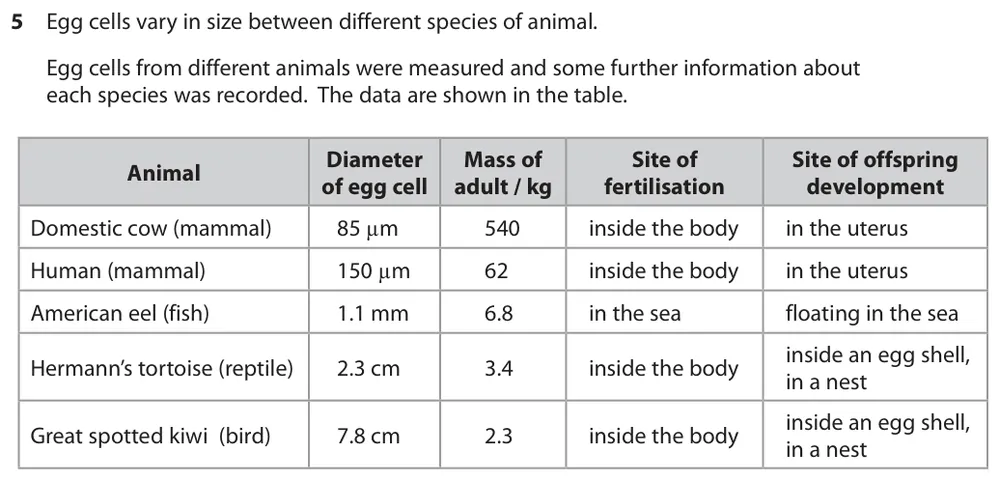
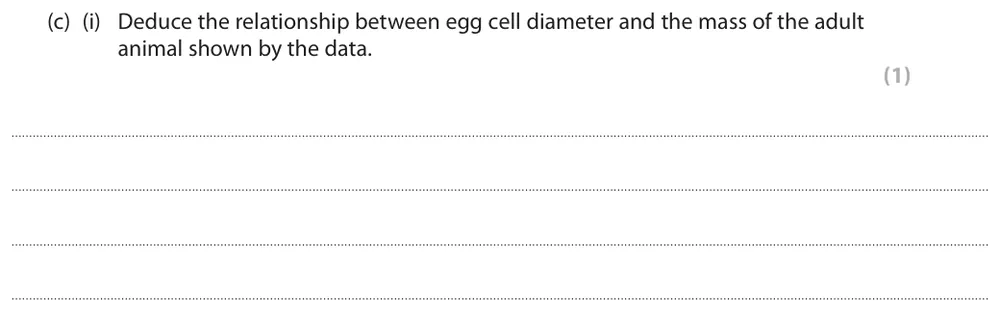
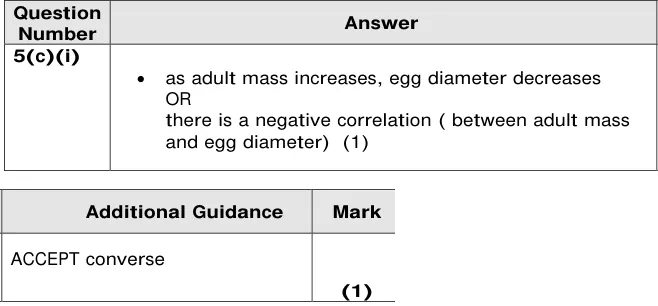
Deduce the relationship between egg cell diameter and the mass of the adult animal.
Information from earlier in this question:
Show the mark scheme
Tap an image to open it full size.
From the examiners' report: Almost all candidates identified the negative correlation.
Question 11
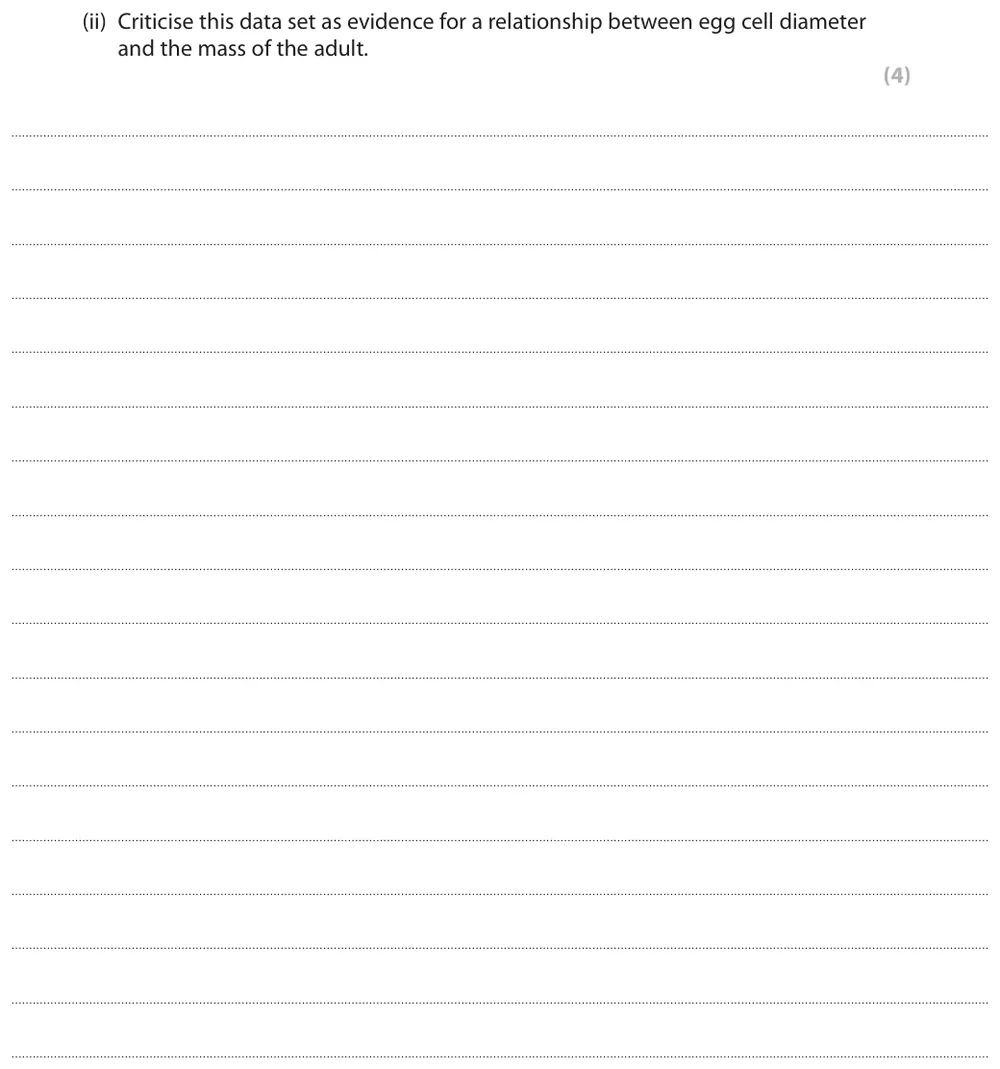
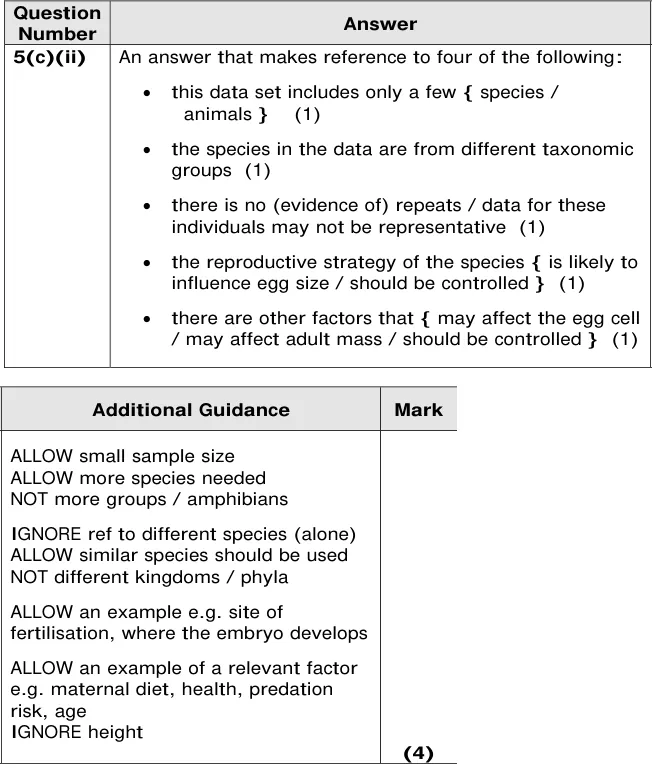
AS Paper 2 · June 2016 · Q5(c)(ii) · 4 marks · Easy
Criticise this data set as evidence for a relationship between egg cell diameter and adult mass.
Show the mark scheme
Tap an image to open it full size.
From the examiners' report: 'Criticise' means point out weaknesses: some quoted the data in detail to support the correlation and offered no criticism. Many discussed one flaw at length; consider a range of different issues with the data set to reach 4 marks.
Question 12
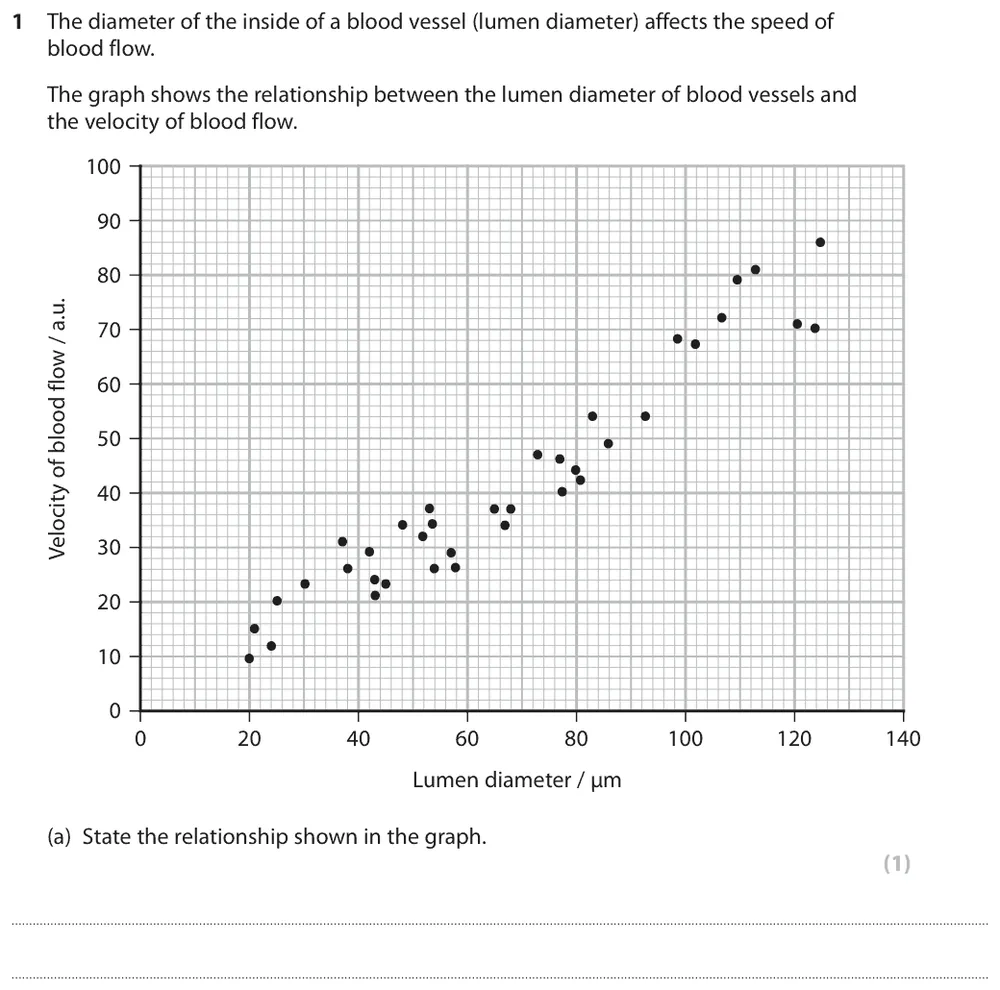
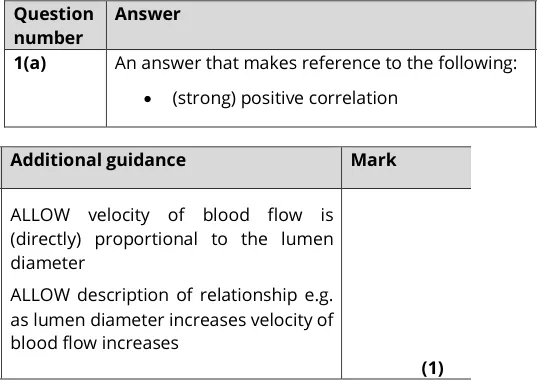
A level Paper 3 · October 2020 · Q1(a) · 1 mark
State the relationship between lumen diameter and the velocity of blood flow.
Show the mark scheme
Tap an image to open it full size.
From the examiners' report: Most found this straightforward. 'A positive relationship' was not accepted as equivalent to a positive correlation.
Magnification and orders of magnitude (MS 1.8)
Question 13
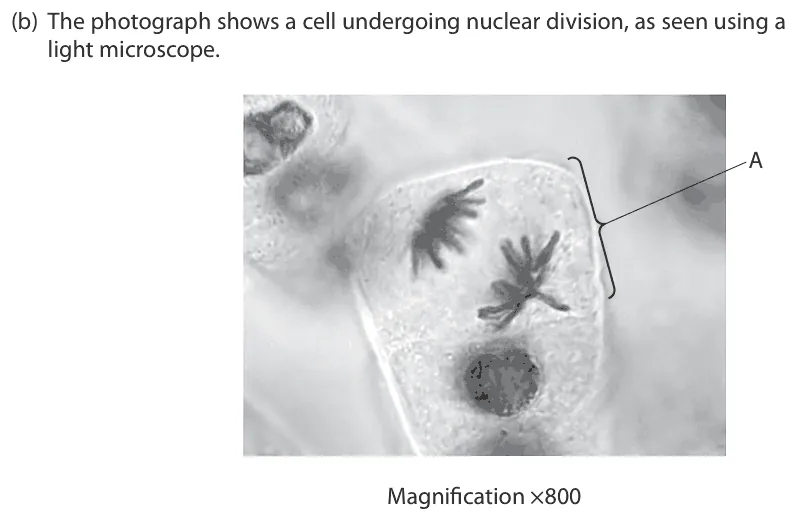
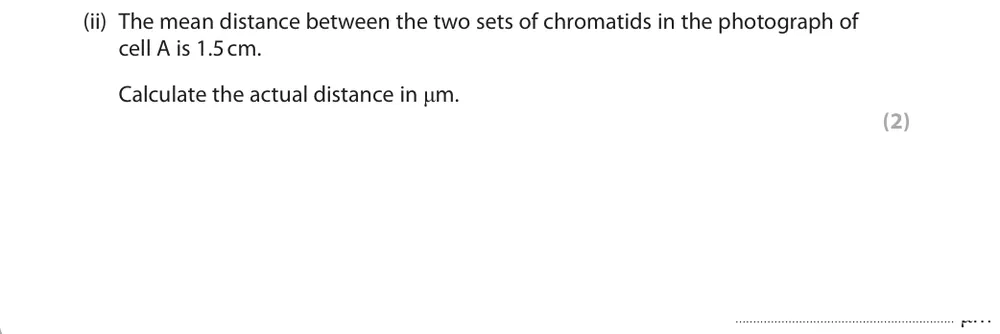
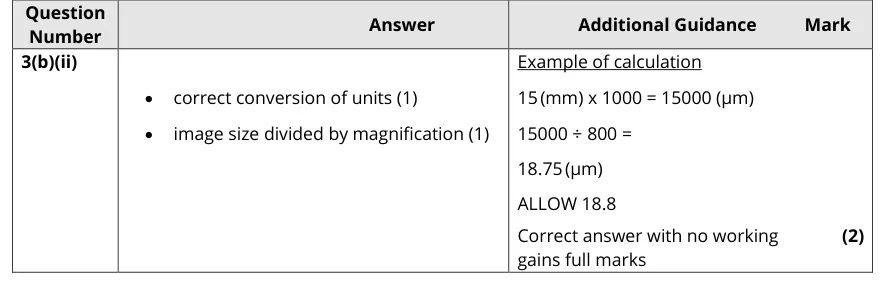
AS Paper 2 · June 2019 · Q3(b)(ii) · 2 marks
Use a given image distance and the magnification to calculate the actual distance between two sets of chromatids, in µm.
Information from earlier in this question:
Show the mark scheme
Tap an image to open it full size.
From the examiners' report: A large number gained full marks. Most errors came from converting to micrometres incorrectly.
Question 14
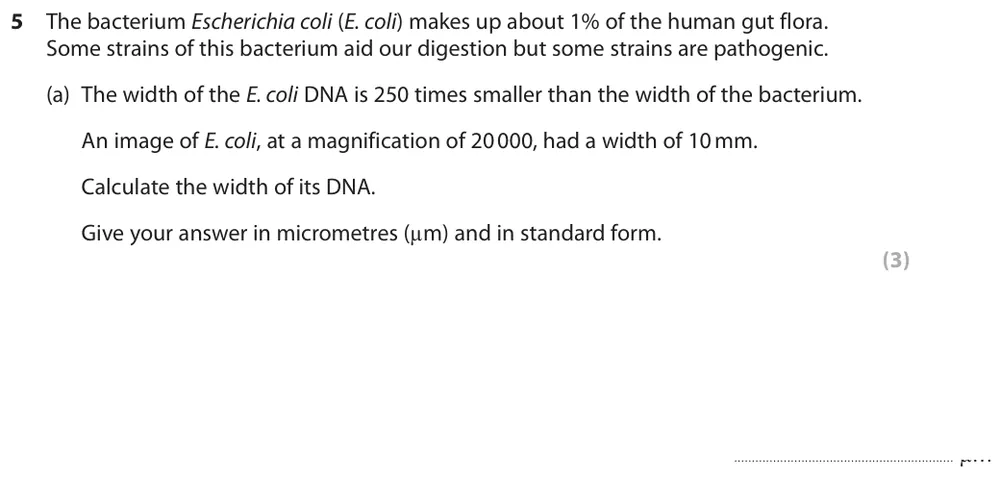
A level Paper 2 · June 2023 · Q5(a) · 3 marks
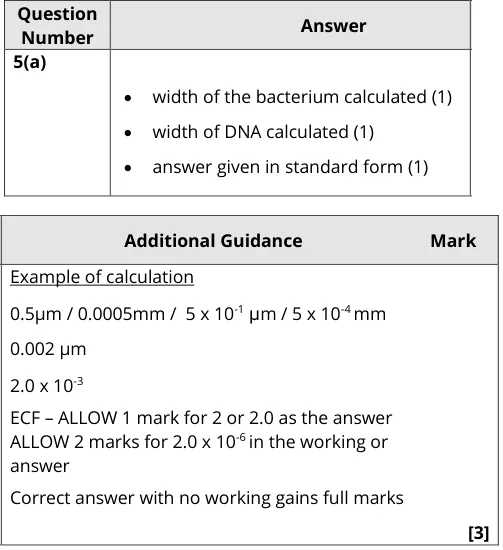
Use an image width and magnification to calculate the width of E. coli DNA, in micrometres and in standard form.
Show the mark scheme
Tap an image to open it full size.
From the examiners' report: A sizeable minority only calculated the real width of the bacterium, or did not take account of the units. Make sure you deal with every part of the question, including the information that the DNA is 250 times narrower than the bacterium.
Statistical tests and significance (MS 1.9)
Question 15
A level Paper 3 · October 2020 · Q4(a)(i) · 1 mark
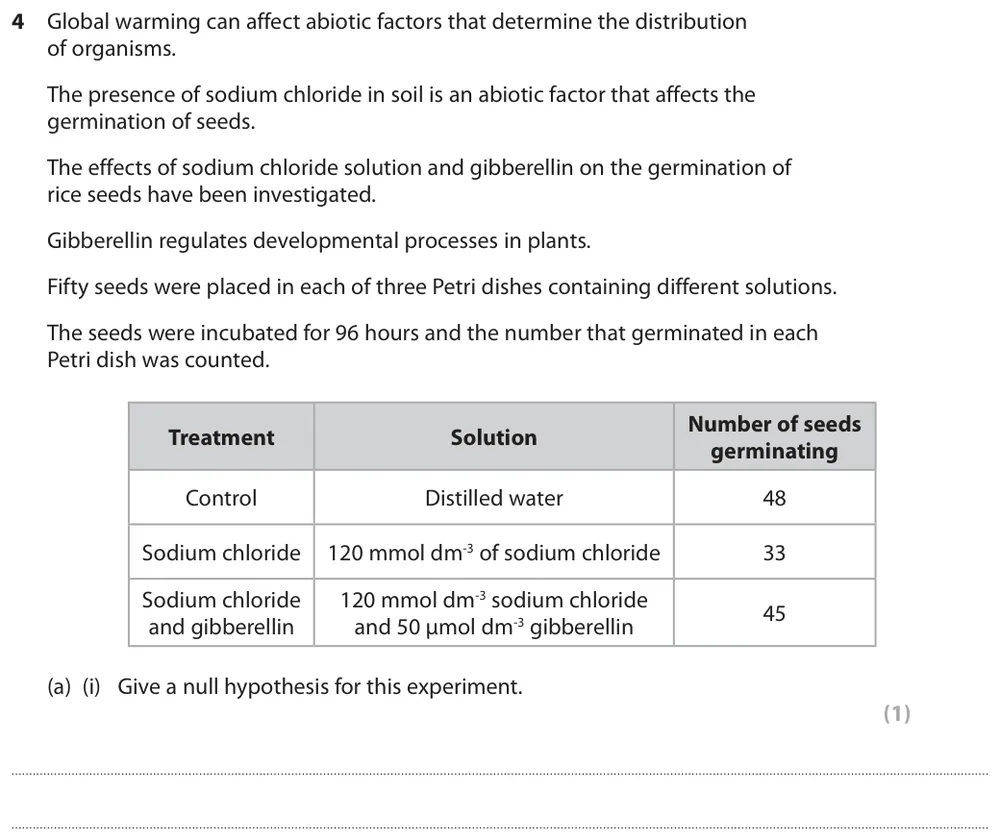
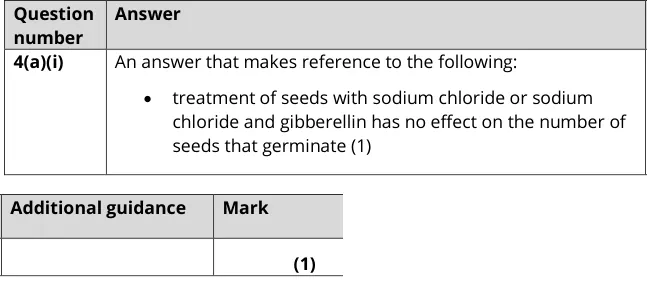
Give a null hypothesis for an experiment on the effect of salt and gibberellin on seed germination.
Show the mark scheme
Tap an image to open it full size.
From the examiners' report: The answer had to compare the right groups. One answer that compared sodium chloride with gibberellin did not gain the mark; the creditworthy answer made the correct comparison.
Question 16
A level Paper 3 · June 2022 · Q1(a)(ii) · 2 marks
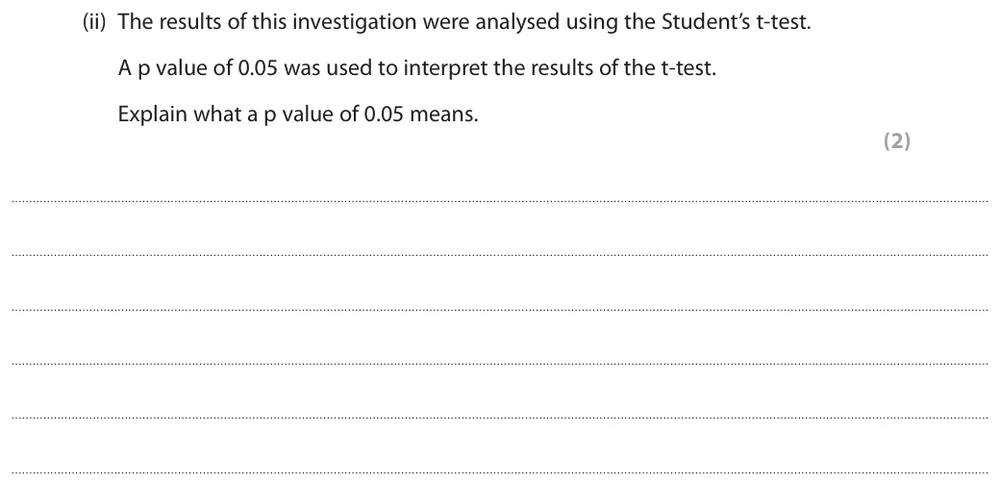
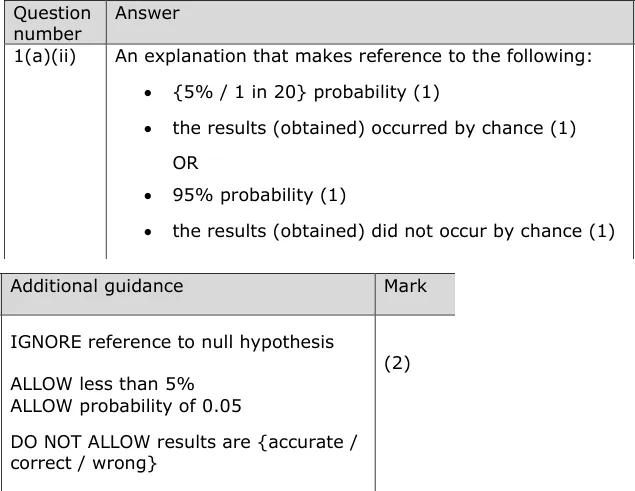
Explain what a p value of 0.05 means.
Show the mark scheme
Tap an image to open it full size.
From the examiners' report: Statements such as 'there is a 5% chance of accepting the null hypothesis' gained only one mark, and 'the null hypothesis can be rejected' gained none. Link the 5% probability to the results occurring by chance.
Question 17
A level Paper 2 · November 2021 · Q9(b)(i) · 2 marks
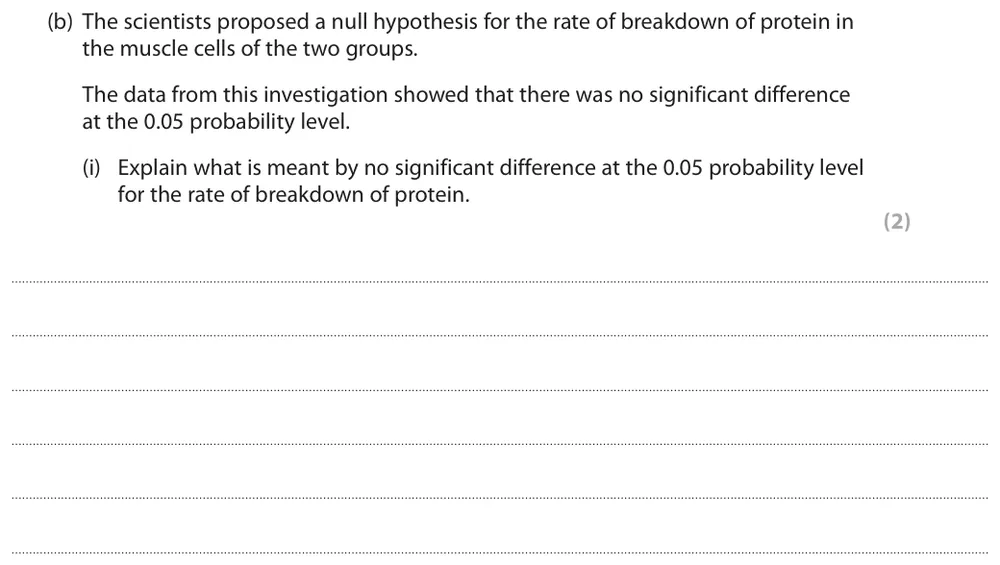
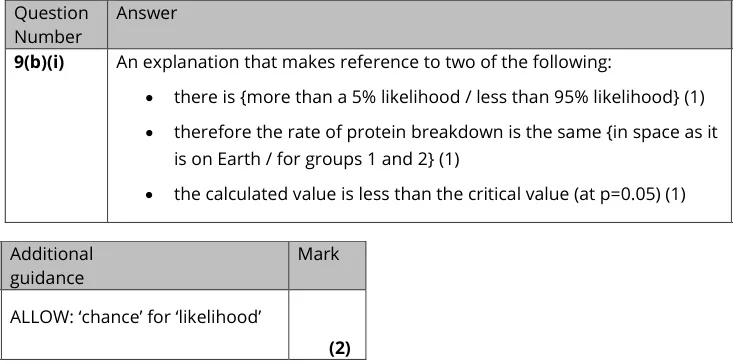
Explain what 'no significant difference at the 0.05 probability level' means for the rate of protein breakdown.
Show the mark scheme
Tap an image to open it full size.
From the examiners' report: It was not uncommon for candidates to read this as a 95% certainty that there was a significant difference. An answer that described the result in context but did not explain the importance of p = 0.05 gained only one mark.
Standard deviation, range and uncertainty (MS 1.10, MS 1.11)
Question 18
AS Paper 2 · November 2021 · Q3(c) · 3 marks
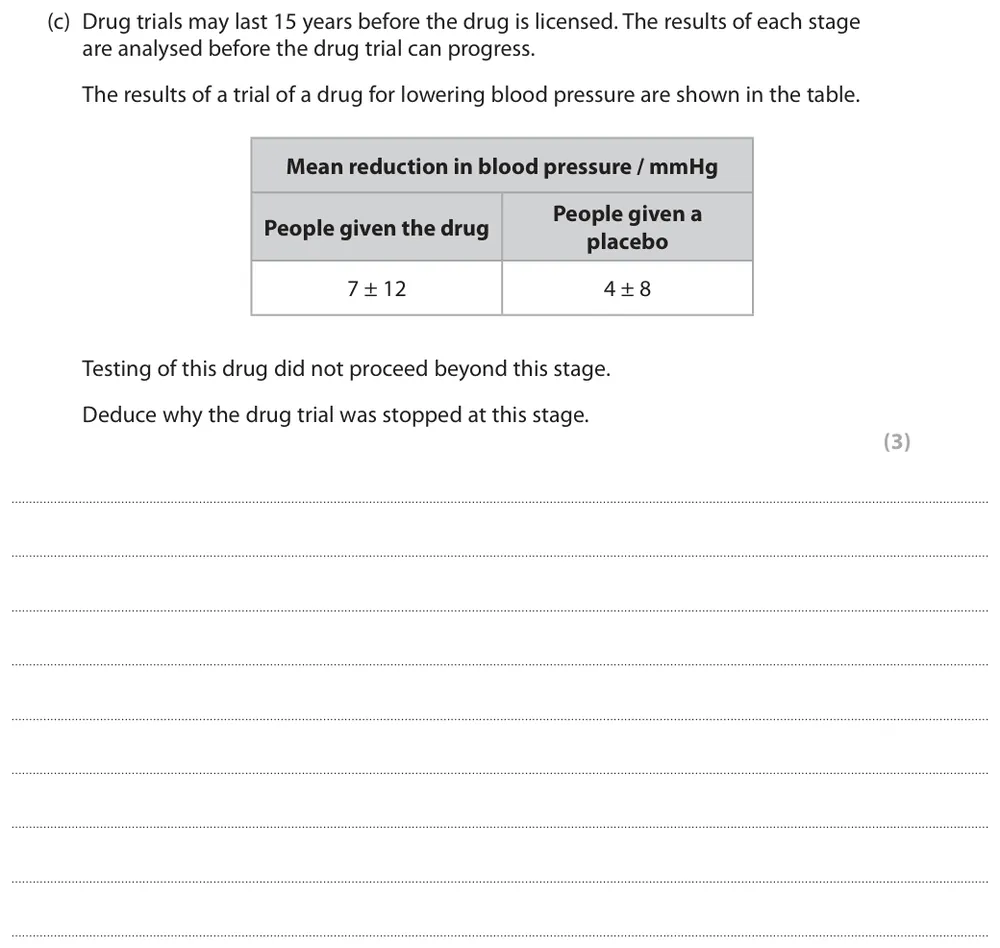
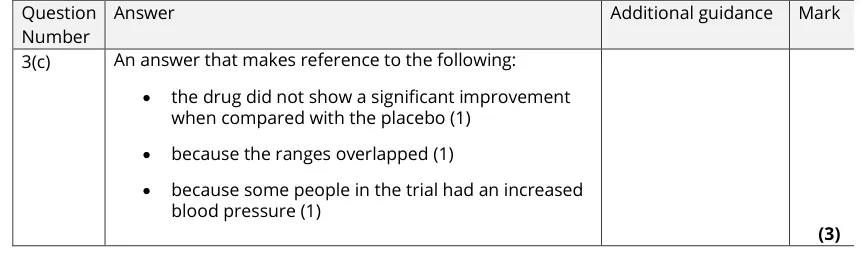
Use mean values and their ranges to deduce why a blood pressure drug trial was stopped.
Show the mark scheme
Tap an image to open it full size.
From the examiners' report: Most saw there was little difference between the drug and the placebo, but few used the term 'significant difference'. Only a small minority saw the relevance of the ranges (error bars), so full marks were rare.
Question 19
A level Paper 2 · June 2018 · Q6(a)(i) · 2 marks
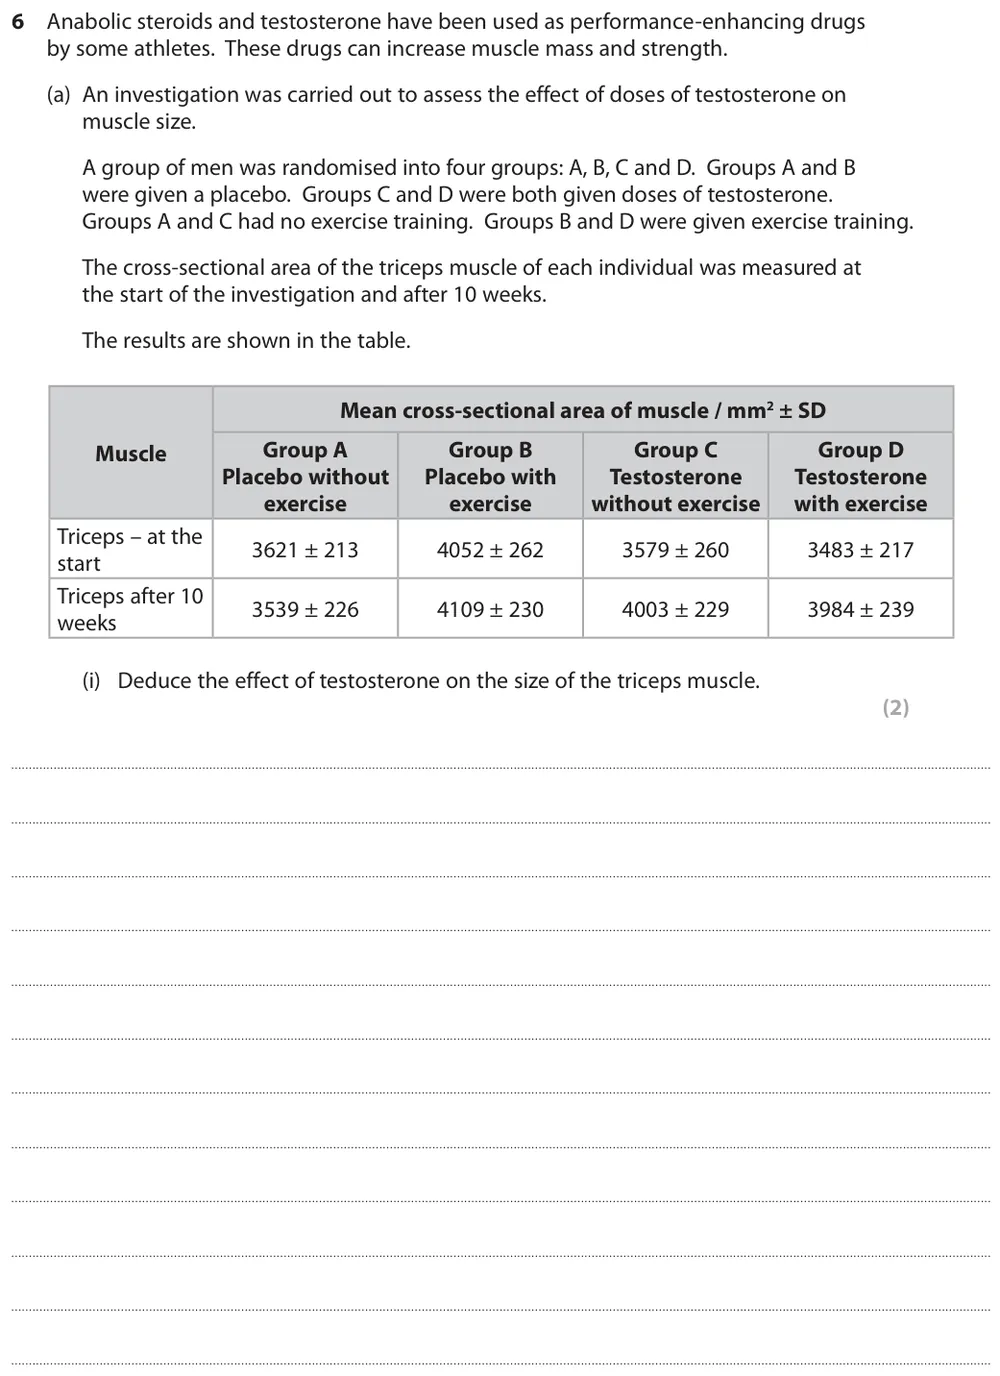
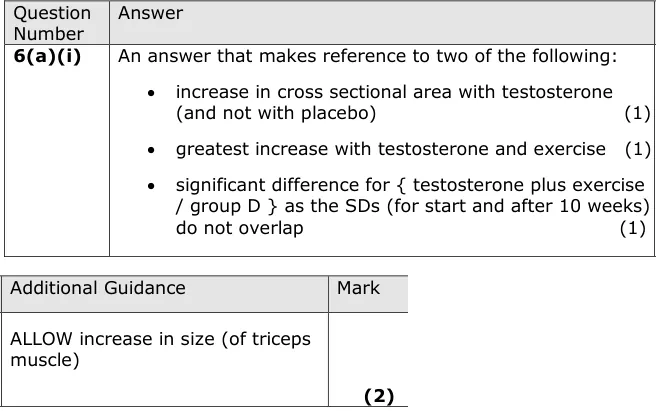
Deduce the effect of testosterone on the size of the triceps muscle from means and standard deviations.
Show the mark scheme
Tap an image to open it full size.
From the examiners' report: Most said testosterone increased muscle size. Only the better answers said the greatest increase was with testosterone and exercise, and very few said this was a significant difference because the standard deviations do not overlap.
Question 20
AS Paper 1 · June 2023 · Q8(a)(i) · 2 marks
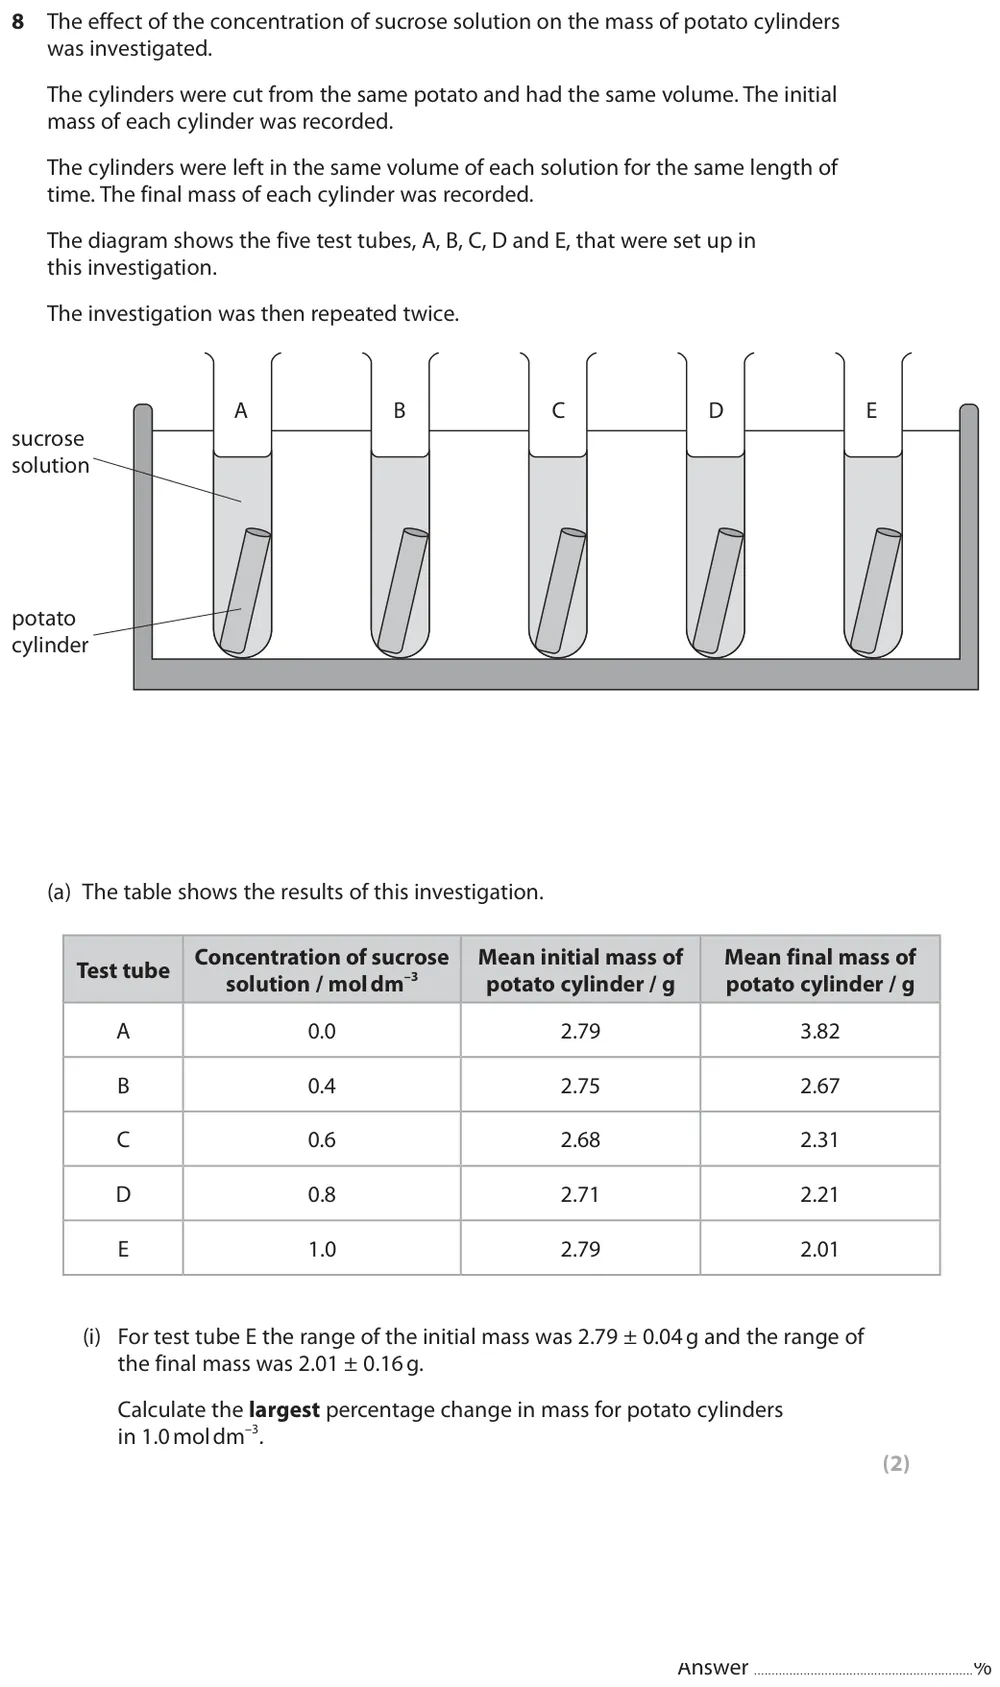
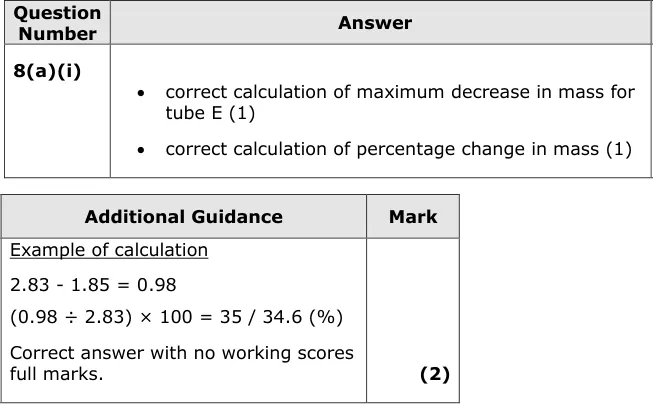
Use the uncertainty in two masses to calculate the largest possible percentage change in mass.
Show the mark scheme
Tap an image to open it full size.
From the examiners' report: A large number did not read the question carefully and used the mean values in the table instead of the ± ranges given in the question, which gained no credit.
Where students lose marks (from Pearson examiners' reports and mark schemes)
Each point below comes from the examiners' reports and mark schemes, and is followed by wording that gained marks.
Let the table set your significant figures. Many worked out the mean correctly but then rounded it to fewer figures than the data in the table.
✔ Gains credit: '6.44 ÷ 10 = 0.644 (mm)'
Divide the change by the right value. Many calculated the change but then divided by the wrong value, and lost a further mark by not giving three significant figures.
✔ Gains credit: '15 470 – 8184 = 7286; (7286 ÷ 15 470) × 100 = 47.1%'
Say correlation, not relationship. 'A positive relationship' was not accepted as equivalent to a positive correlation.
✔ Gains credit: '(strong) positive correlation' or 'as lumen diameter increases, velocity of blood flow increases'
Work out the bacterium, then the DNA. A sizeable minority only calculated the true width of the bacterium or did not take account of the units.
✔ Gains credit: 'Width of bacterium = 0.5 µm; width of DNA = 0.002 µm = 2.0 × 10⁻³ µm'
Two steps before you round. Several did not realise there were two steps, and many lost a mark by not giving three significant figures.
✔ Gains credit: '5000 ÷ 501.3 = 9.97; 9.974 ÷ 0.105 = 95.0 (g)'
Tie the 5% to chance. Some wrote 'a 5% chance of accepting the null hypothesis' or just 'the null hypothesis can be rejected'.
✔ Gains credit: 'There is a 5% probability that the results occurred by chance.'
Overlapping ranges mean no significant difference. Few used the term significant difference, and only a small minority saw the relevance of the ranges.
✔ Gains credit: 'The drug did not show a significant improvement compared with the placebo, because the ranges overlapped.'
Use the ± values the question gives. A large number used the mean masses from the table instead of the ranges given in the question.
✔ Gains credit: '2.83 – 1.85 = 0.98; (0.98 ÷ 2.83) × 100 = 34.6%'
Download the questions
Download the PDF pack (20 questions, mark schemes at the end)
Keep practising
- Edexcel SNAB A level Biology revision resources by topic
- Arithmetic and Numerical Computation (Maths Skills MS0): Edexcel SNAB A Level Biology Exam Questions
- Algebra and Equations (Maths Skills MS2): Edexcel SNAB A Level Biology Exam Questions
- Graphs and Geometry (Maths Skills MS3 and MS4): Edexcel SNAB A Level Biology Exam Questions
- All Edexcel SNAB exam questions by topic
- Edexcel SNAB A level Biology past papers, mark schemes and examiners' reports
- Edexcel SNAB A level Biology grade boundaries
- Message Tom on WhatsApp about one-to-one Edexcel SNAB tutoring or an Edexcel group class
Questions, mark schemes and examiners' report extracts © Pearson Education Ltd.