

Investigating diversity (AQA 3.4.7) links the genetics of the Year 12 course to practical skills. You need to know the four ways genetic diversity within or between species can be compared (observable characteristics, DNA base sequences, mRNA base sequences and amino acid sequences), interpret sequence data to suggest how closely organisms are related, explain why direct investigation of DNA sequences has replaced inference from observable characteristics, and describe how random samples, means and standard deviations are used to investigate variation within a species.
The examiners' reports show where the marks go. Students write 'sequence of DNA' without the bases, name amino acids without saying sequence, put 'better technology' instead of DNA sequencing, and explain relationships with vague answers about sharing a common ancestor. In practical questions they choose sites rather than individuals at random, describe without explaining, and read the standard deviations from the wrong figure.
Start with the ways of comparing genetic diversity, then sampling and means, then the sequence data, and finish with standard deviations. Answer each question on paper before you open the mark scheme. If you'd like help with this topic, my AQA masterclasses run online on Tuesdays at 5.15pm for Year 12 and on Wednesdays or Thursdays at 6.30pm for Year 13.
What you need from GCSE and Year 12
Each question on this page assumes you're secure on these GCSE and Year 12 ideas. If any of them feels shaky, revise it before you start.
- GCSE: variation within a species can be genetic, environmental or both, and characteristics such as height show continuous variation.
- GCSE: random sampling, and why a large sample gives a more reliable mean.
- Year 12 (AQA 3.4.1): a triplet of DNA bases codes for an amino acid, so the base sequence of a gene determines the amino acid sequence of a polypeptide.
- Year 12 (AQA 3.4.2): mRNA is transcribed from DNA, and its codons are translated into the amino acid sequence of a polypeptide.
- Year 12 (AQA 3.4.3): a mutation changes the base sequence of DNA and can change the amino acid sequence.
Key terms
These words come up in the questions and mark schemes. Examiners expect you to use them exactly.
- Genetic diversity: the number of different alleles of genes in a population.
- Observable characteristics: measurable or observable features; comparing their frequency was the older way of inferring genetic diversity.
- Base sequence: the order of bases in DNA or mRNA; say 'base sequence of DNA', not just 'sequence of DNA'.
- Amino acid sequence: the primary structure of a polypeptide or protein, encoded by DNA and mRNA; compare it for the same protein in each organism.
- Common ancestor: fewer differences in base or amino acid sequences mean a more recent common ancestor; more differences mean an earlier one.
- Random sample: individuals chosen so that each has an equal chance of selection, for example using random numbers, so there is no bias.
- Mean: the sum of the measurements divided by the number of measurements.
- Running mean: the mean recalculated after each new measurement; keep sampling until it stays fairly constant.
- Standard deviation: a measure of the spread of the data around the mean.
- Significant difference: a difference between means that is not due to chance; if the standard deviations don't overlap, the difference is significant.
What these questions cover (AQA 3.4.7)
The questions test these statements from the AQA AS and A-level Biology specification (7401/7402):
- Genetic diversity within, or between species, can be made by comparing: the frequency of measurable or observable characteristics
- Genetic diversity within, or between species, can be made by comparing: the base sequence of DNA
- Genetic diversity within, or between species, can be made by comparing: the base sequence of mRNA (the HPV question is the only one built around mRNA, though mRNA base sequences also score in the 2025 and 2022 mark schemes)
- Genetic diversity within, or between species, can be made by comparing: the amino acid sequence of the proteins encoded by DNA and mRNA.
- Students should be able to: interpret data relating to similarities and differences in the base sequences of DNA and in the amino acid sequences of proteins to suggest relationships between different organisms within a species and between species
- Students should be able to: appreciate that gene technology has caused a change in the methods of investigating genetic diversity; inferring DNA differences from measurable or observable characteristics has been replaced by direct investigation of DNA sequences. (the soil prokaryote question is the only part on this statement)
- Quantitative investigations of variation within a species involve: collecting data from random samples
- Quantitative investigations of variation within a species involve: calculating a mean value of the collected data and the standard deviation of that mean (you won't be asked to calculate a standard deviation in the written papers)
- Quantitative investigations of variation within a species involve: interpreting mean values and their standard deviations.
How to use this page
Write your answer on paper before you open the mark scheme. Allow about 1.3 minutes per mark: the 16 questions are worth 42 marks, so about 55 minutes in total. Then mark your answer strictly against the mark scheme and read the examiners' tip underneath it. If you'd rather print the questions, download the PDF pack.
Comparing genetic diversity (3.4.7)
Question 1
AS Paper 1 · June 2025 · Q05.1 · 2 marks · Hard
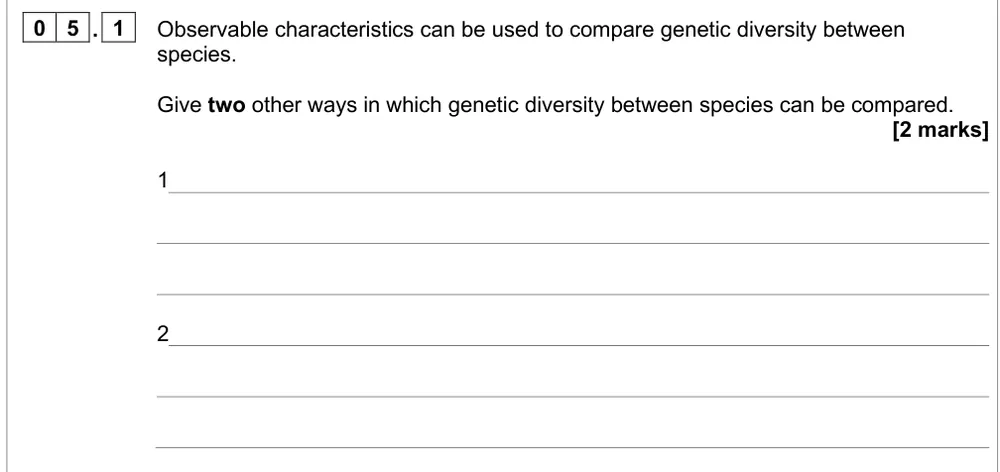
Give two ways other than observable characteristics to compare genetic diversity between species.
Show the mark scheme
Tap an image to open it full size.
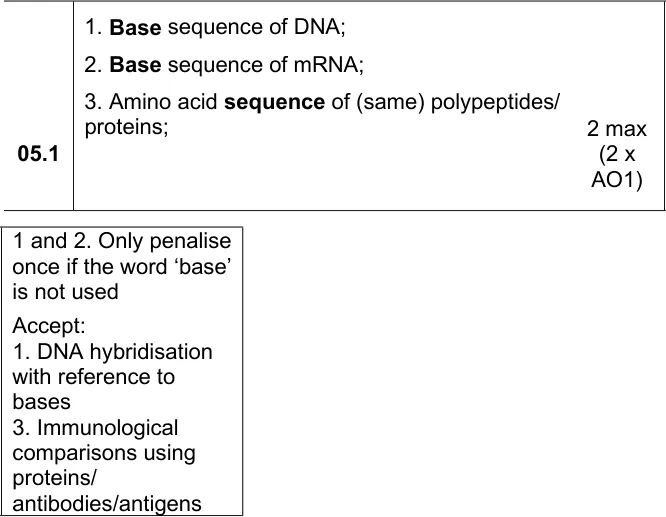
From the examiners' report: About 15% got both. Write 'sequence of bases in DNA', not 'sequence of DNA', and say the amino acid sequence is of a polypeptide or protein. Courtship and phylogeny didn't score.
Question 2
AS Paper 2 · June 2019 · Q08.1 · 2 marks · Hard
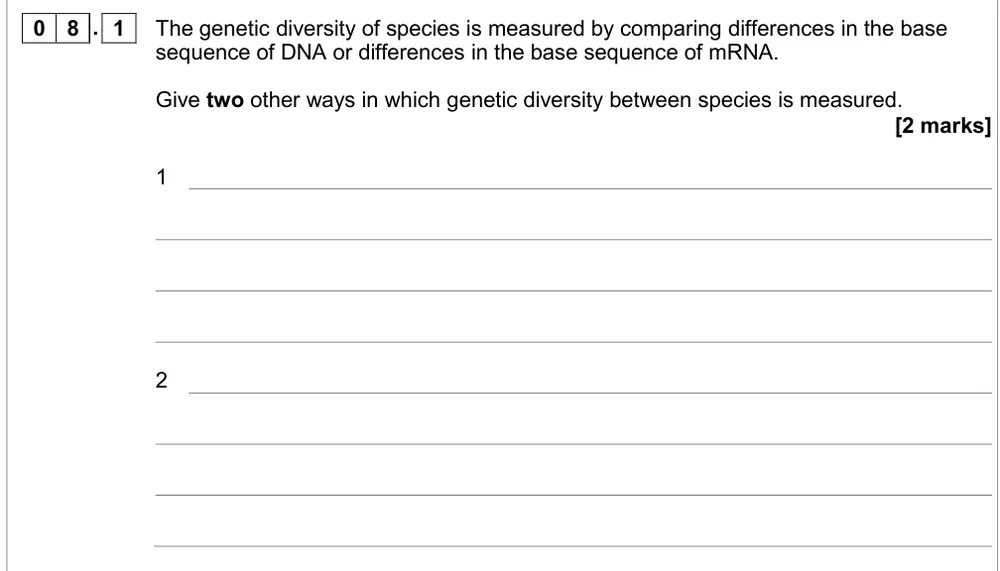
Give two ways other than DNA and mRNA base sequences to measure genetic diversity between species.
Show the mark scheme
Tap an image to open it full size.
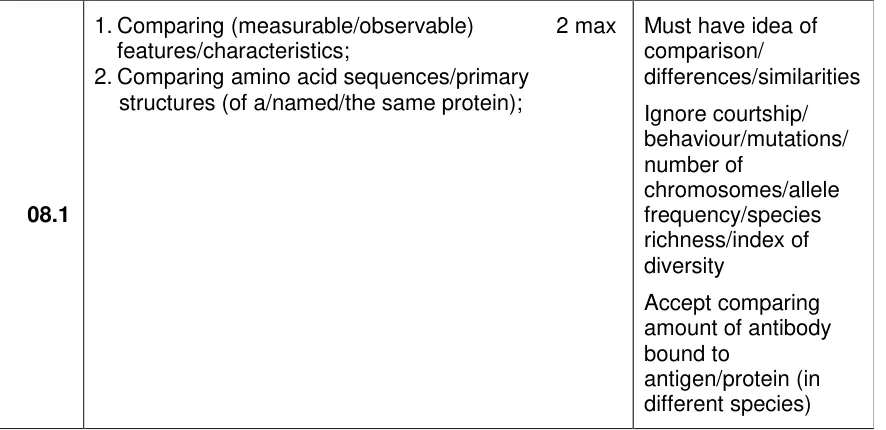
From the examiners' report: Many answers didn't make a comparison, or said 'amino acids' without 'sequence'. Courtship, behaviour and allele frequency were ignored, and some repeated DNA or RNA although the question ruled them out.
Question 3
AS Paper 1 · June 2016 · Q07.4 · 2 marks
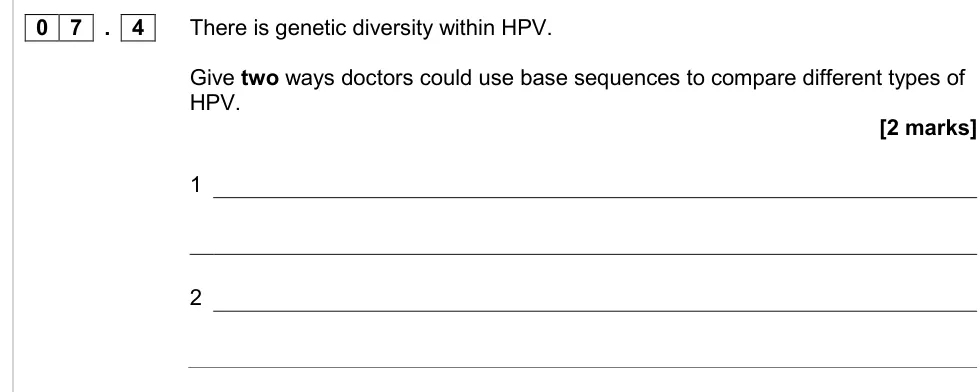
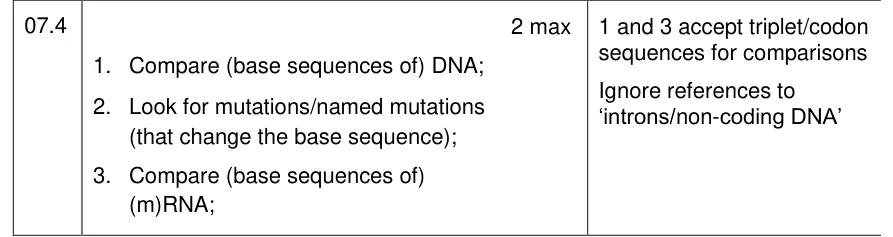
Give two ways to use base sequences to compare different types of HPV.
Show the mark scheme
Tap an image to open it full size.
From the examiners' report: No examiners' report for this paper. Name the molecule and say you compare its base sequence (DNA or mRNA), or look for mutations that change the base sequence.
Question 4
AS Paper 1 · June 2023 · Q07.2 · 2 marks · Hard
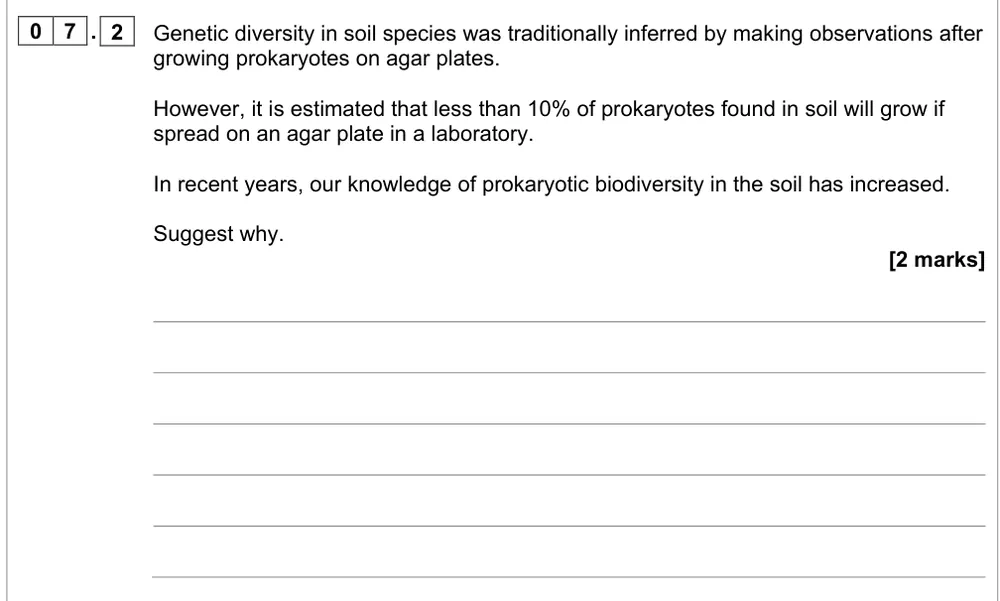
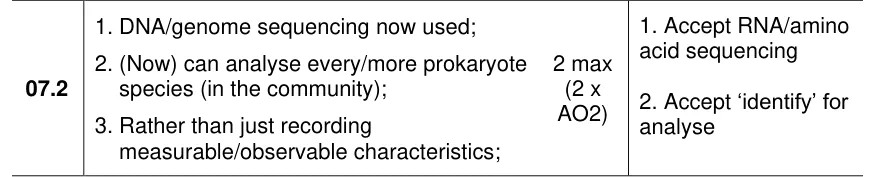
Suggest why knowledge of prokaryotic biodiversity in soil has increased.
Show the mark scheme
Tap an image to open it full size.
From the examiners' report: Very poorly answered. 'Better technology' or better microscopes didn't score: name DNA sequencing, then say it lets scientists identify more prokaryote species than growing them on agar.
Random samples and mean values (3.4.7)
Question 5
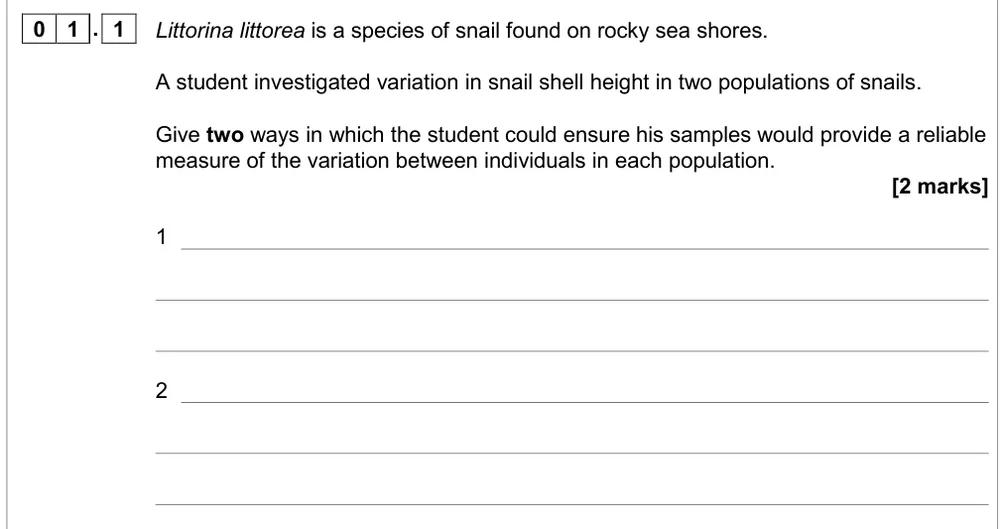
AS Paper 2 · November 2020 · Q01.1 · 2 marks
Give two ways to make samples of snails a reliable measure of variation.
Show the mark scheme

Tap an image to open it full size.
From the examiners' report: Most said use a large sample; fewer said select at random, and some chose sites at random instead of choosing the snails at random.
Question 6
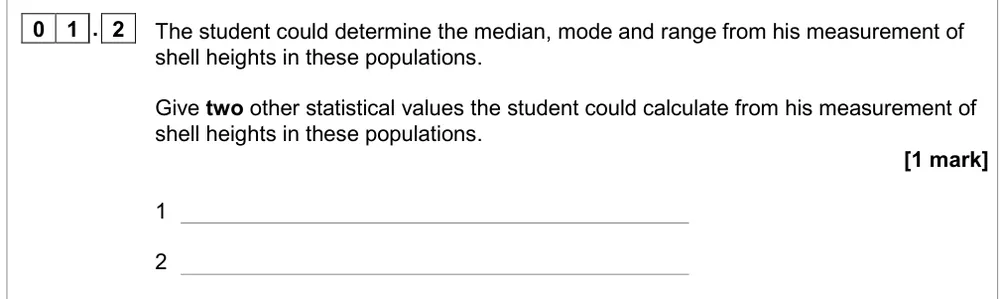
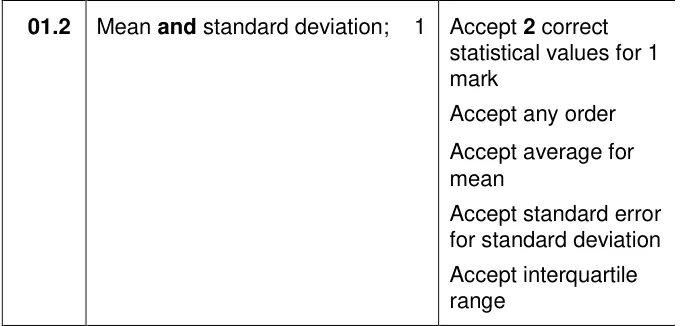
AS Paper 2 · November 2020 · Q01.2 · 1 mark · Medium
Name two statistical values, other than median, mode and range, to calculate from shell heights.
Show the mark scheme
Tap an image to open it full size.
From the examiners' report: Just over a third got it. The two values you need for an investigation of variation are the mean and the standard deviation.
Question 7
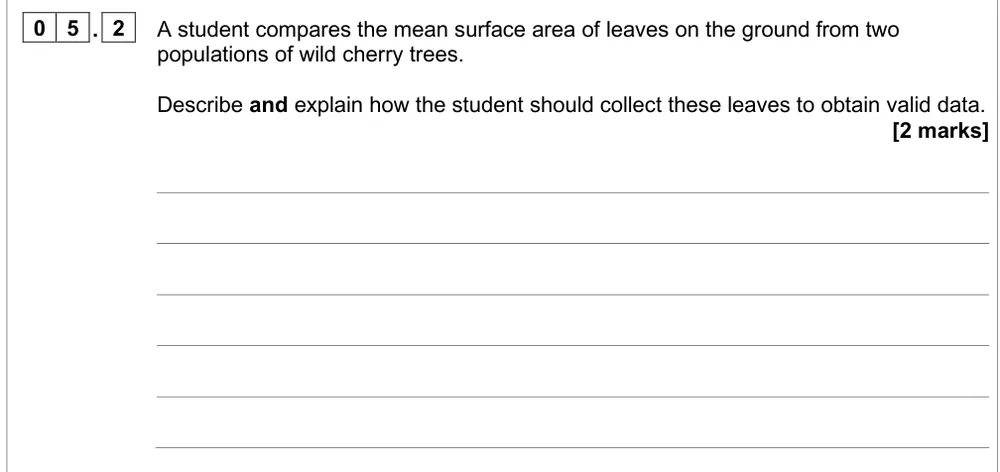
AS Paper 1 · June 2025 · Q05.2 · 2 marks · Hard
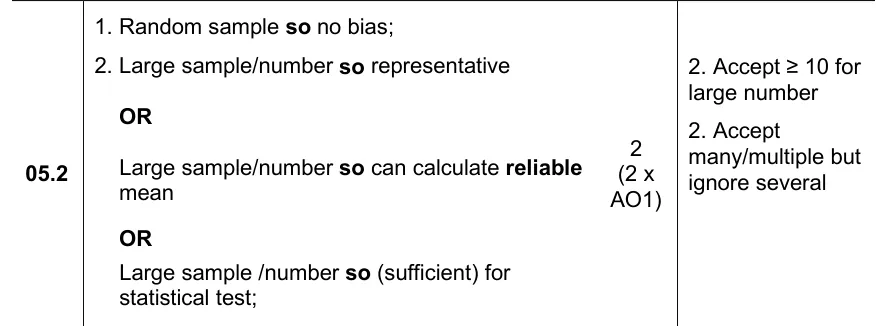
Describe and explain how to collect leaves to get valid data.
Show the mark scheme
Tap an image to open it full size.
From the examiners' report: About 5% got both. Many only described: give the reason with each step, such as a random sample so there is no bias, and a large sample so it is representative.
Question 8
AS Paper 1 · June 2024 · Q05.1 · 5 marks
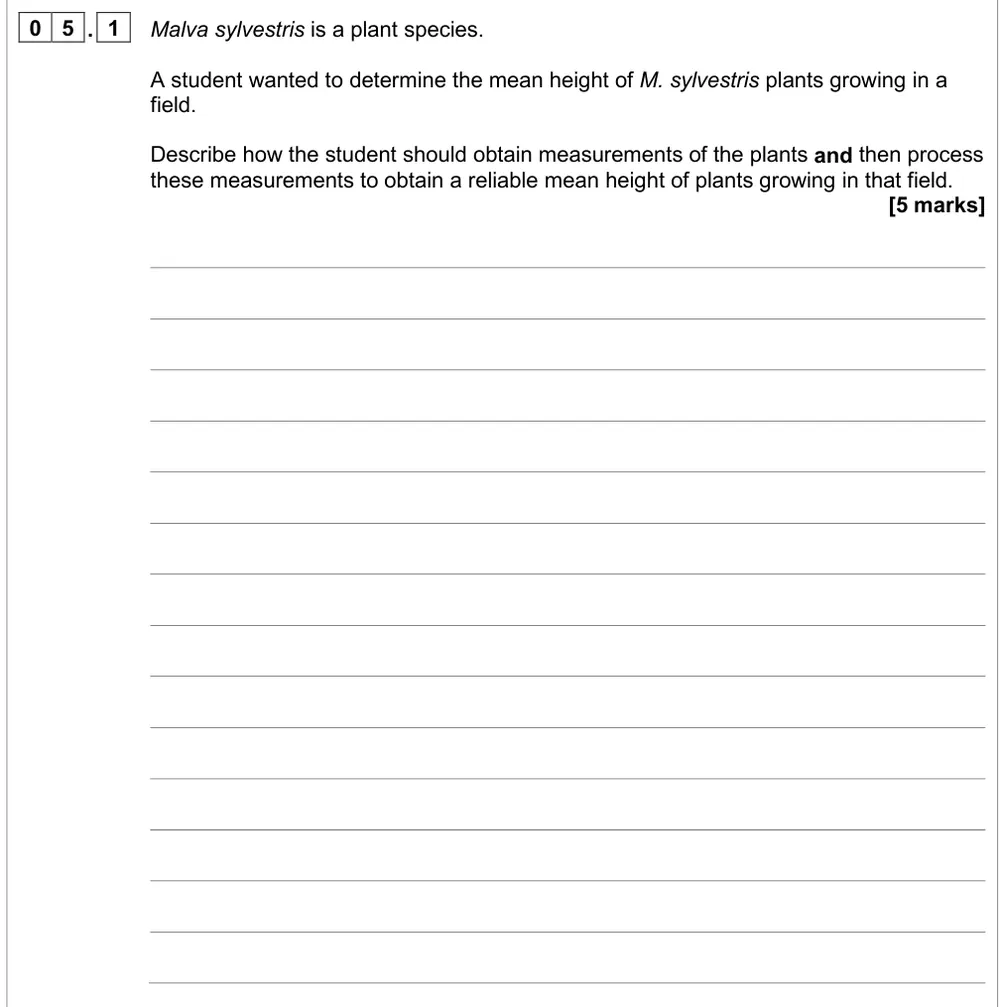
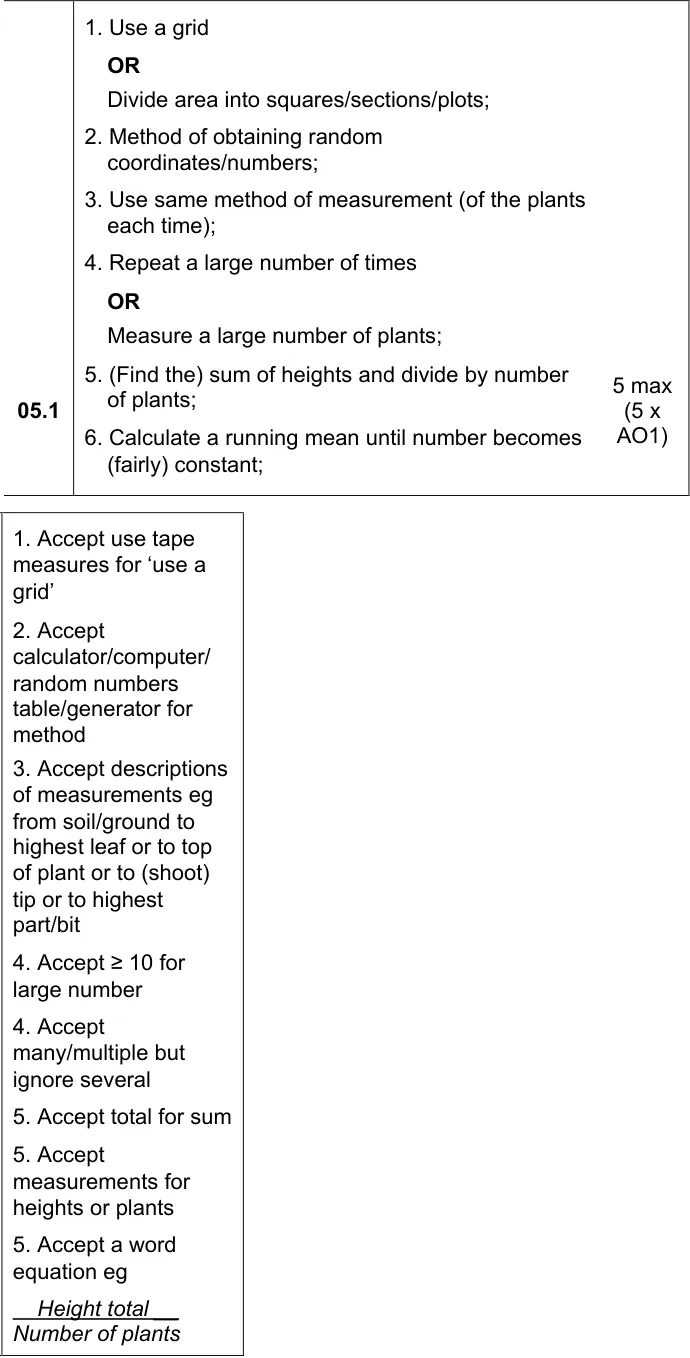
Describe how to obtain a reliable mean height of plants in a field.
Show the mark scheme
Tap an image to open it full size.
From the examiners' report: Use a grid with random coordinates; throwing a quadrat at random didn't count. Describe the mean in full: the total of the plant heights divided by the number of plants.
Question 9
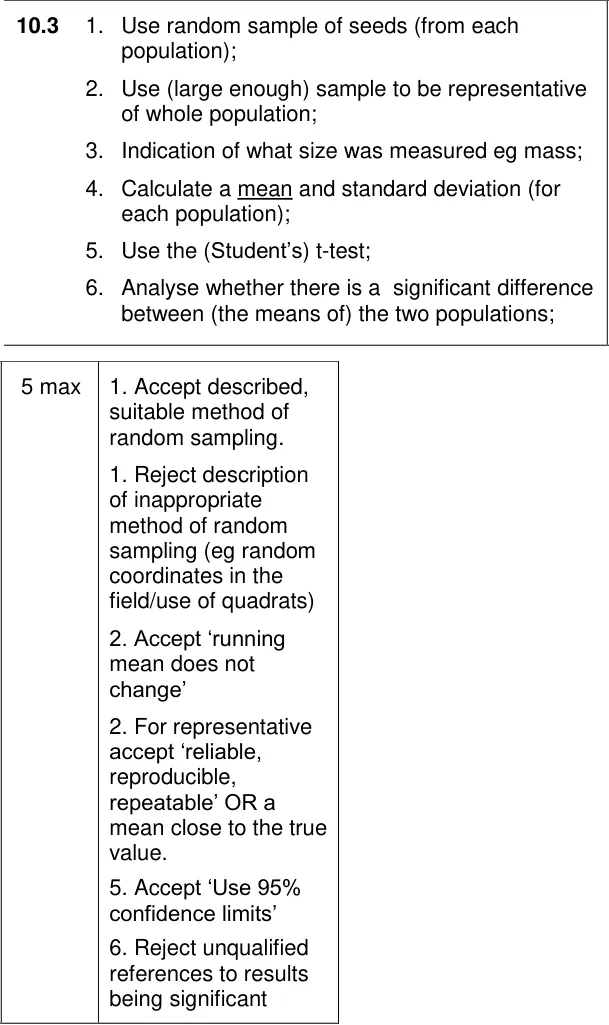
A level Paper 1 · June 2017 · Q10.3 · 5 marks
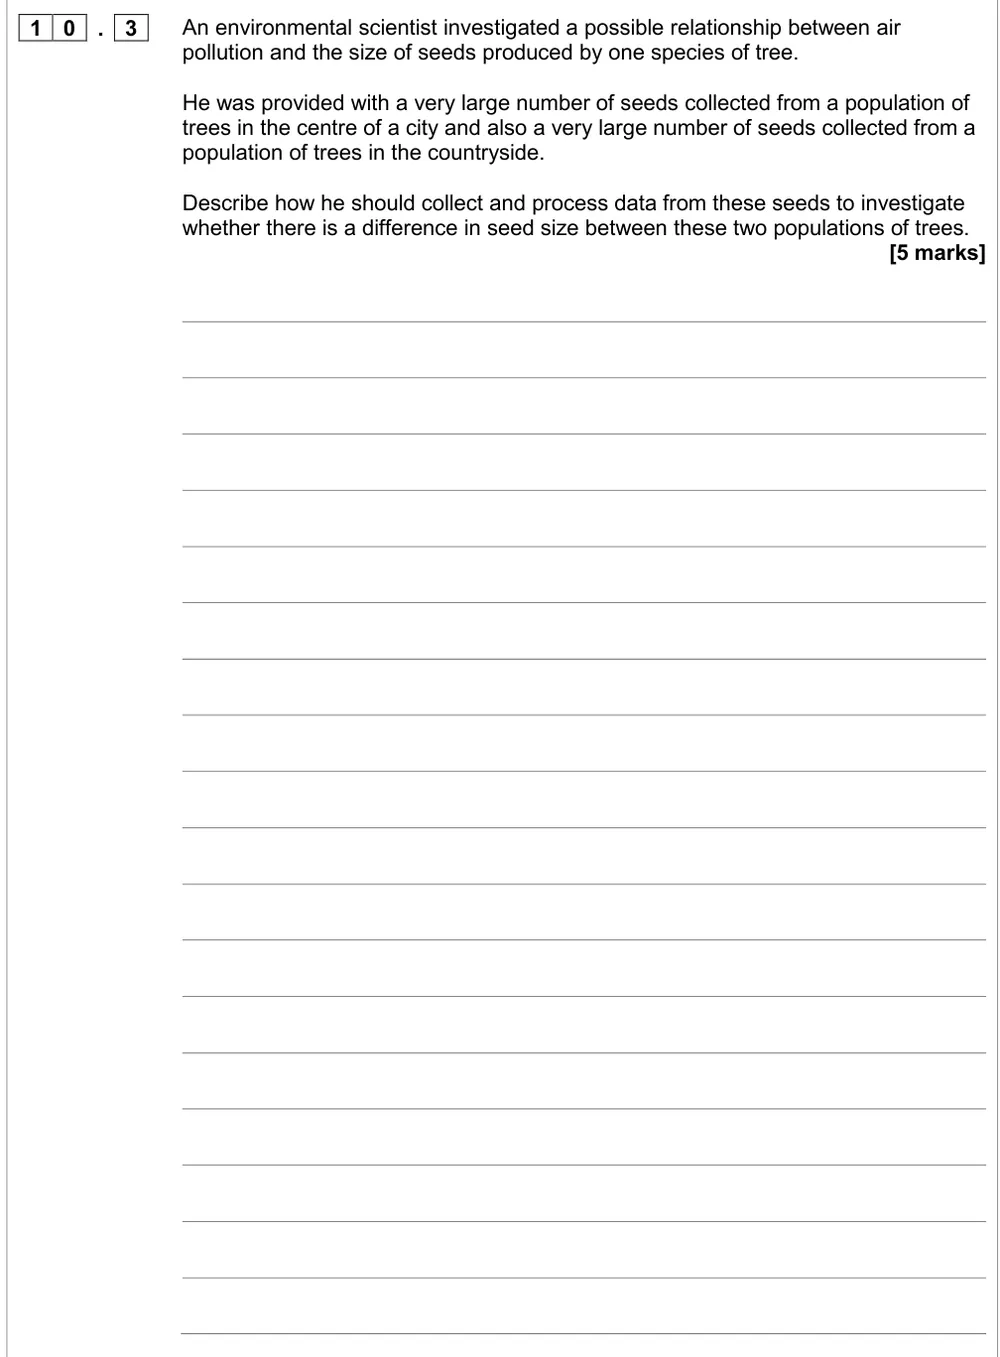
Describe how to collect and process seed data to test for a difference between two populations.
Show the mark scheme
Tap an image to open it full size.
From the examiners' report: No examiners' report comment for this part. The seeds are already collected, so random coordinates and quadrats are rejected: pick seeds at random, measure one thing, find each mean and SD, then use a t-test.
Interpreting DNA and amino acid sequence data (3.4.7)
Question 10
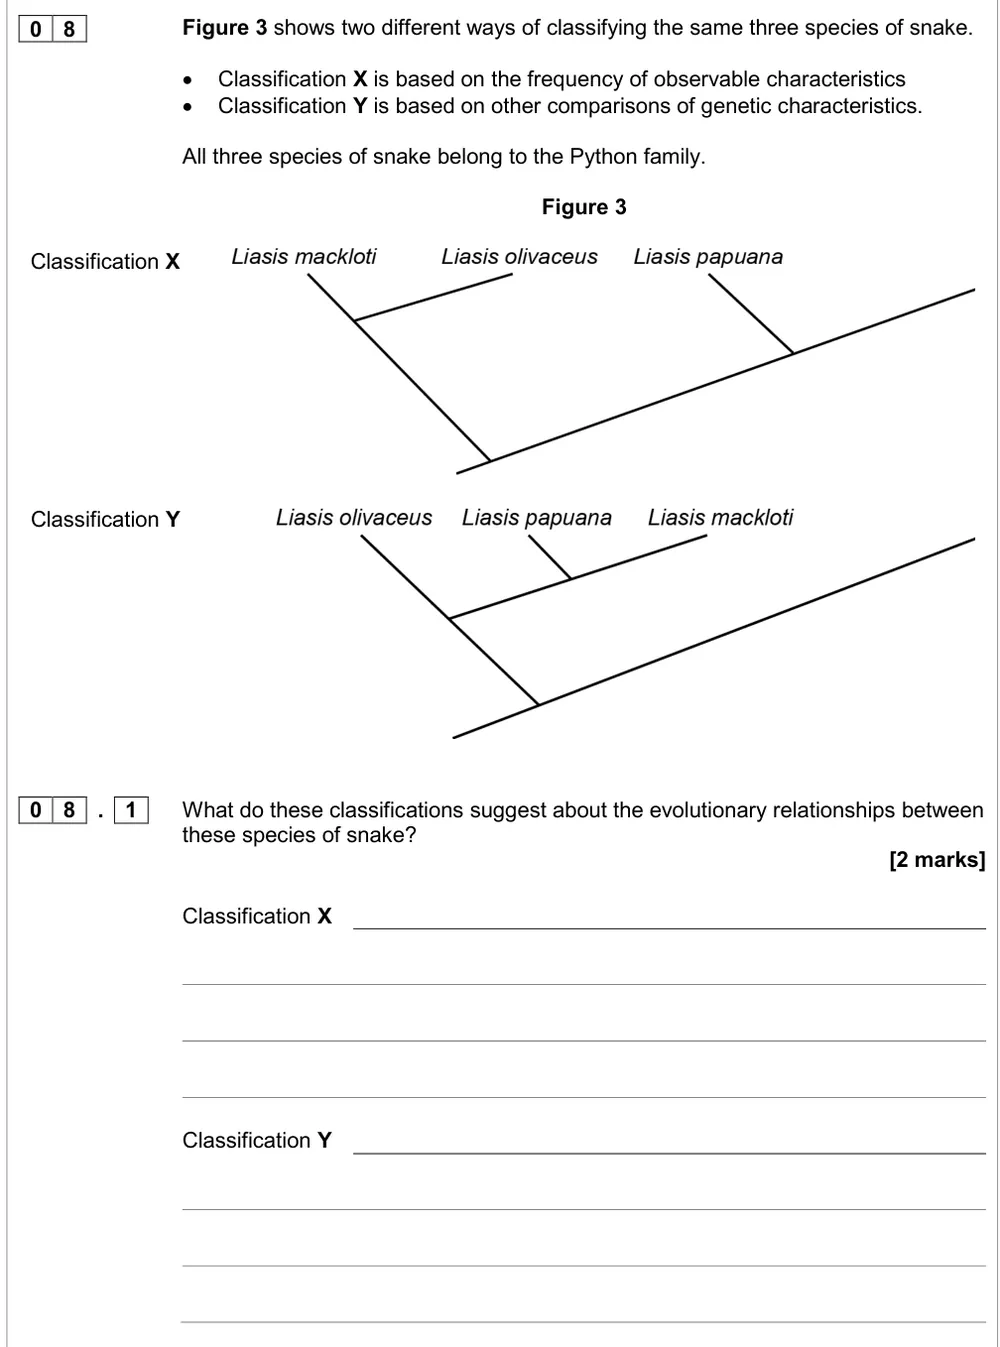
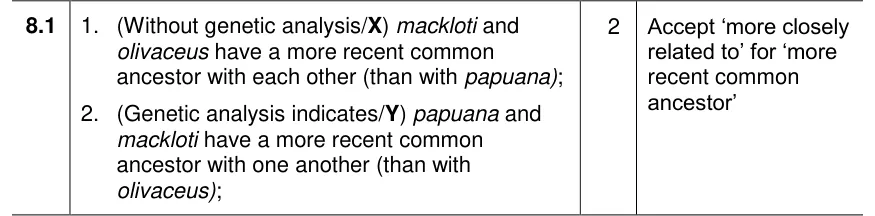
A level Paper 1 · June 2017 · Q08.1 · 2 marks
Say what two classifications suggest about the evolutionary relationships of three snakes.
Show the mark scheme
Tap an image to open it full size.
From the examiners' report: No examiners' report comment for this part. Name the pair in each tree and say they have a more recent common ancestor with each other than with the third species.
Question 11
AS Paper 2 · June 2018 · Q09.2 · 5 marks · Hard
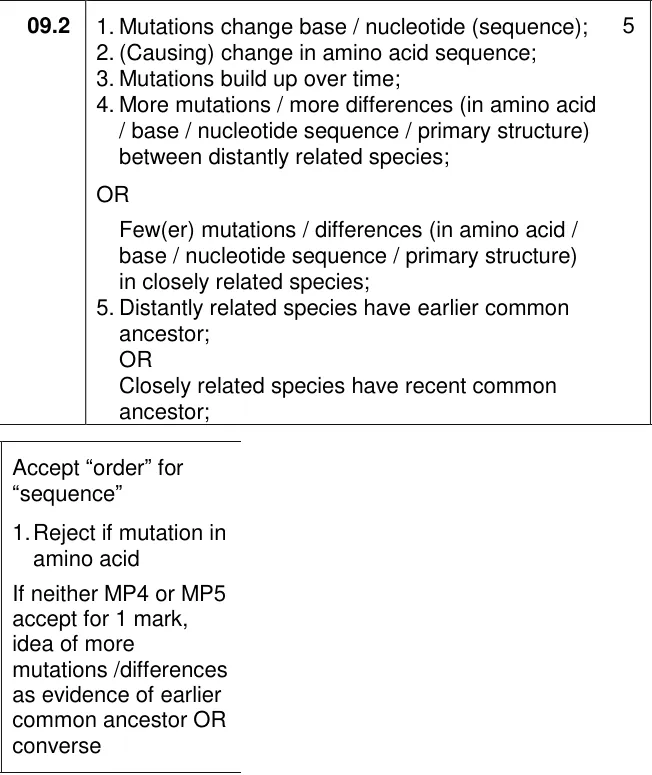
Explain how differences in haemoglobin primary structure show evolutionary relationships.
Show the mark scheme
Tap an image to open it full size.
From the examiners' report: 56.4% scored zero and the mean was 0.46 out of 5. Don't write about protein structure or altitude: start from mutation, say differences build up over time, so more differences mean an earlier common ancestor.
Question 12
AS Paper 2 · June 2022 · Q05.4 · 4 marks · Hard
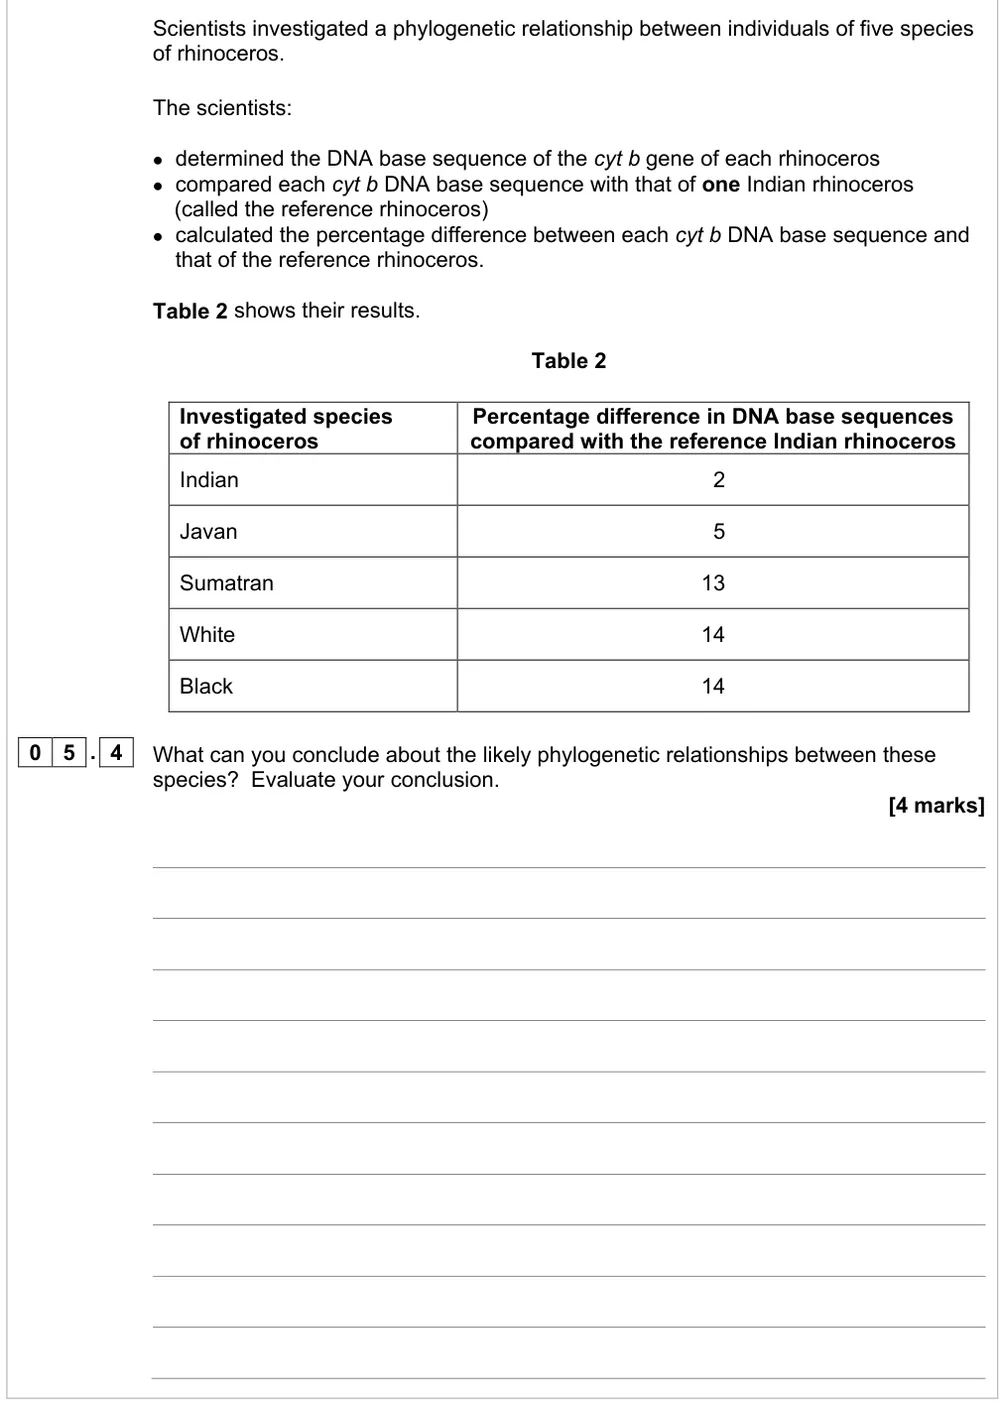
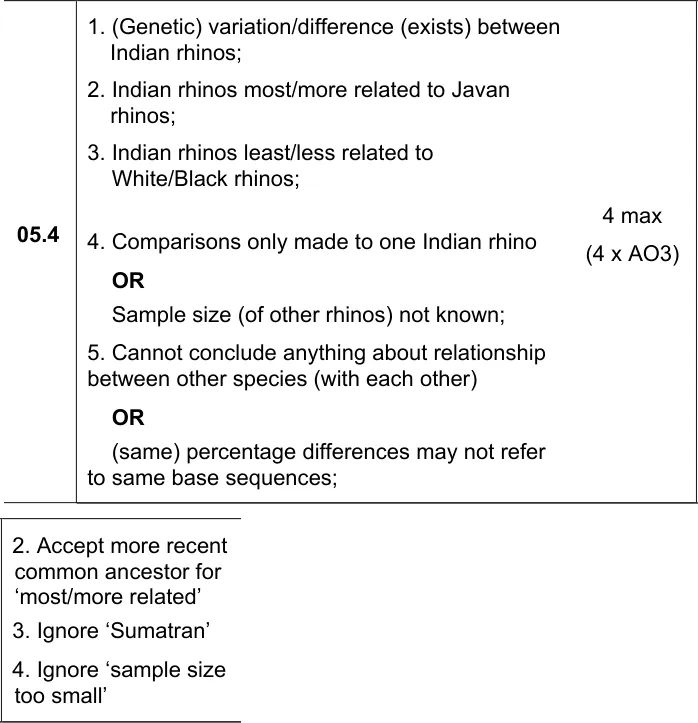
Draw and evaluate conclusions about rhinoceros relationships from DNA differences.
Show the mark scheme
Tap an image to open it full size.
From the examiners' report: Only 2% got full marks. Most saw that Indian and Javan are closest; few realised the 2% is variation within a species. Black and White both being 14% doesn't show they are closely related to each other.
Question 13
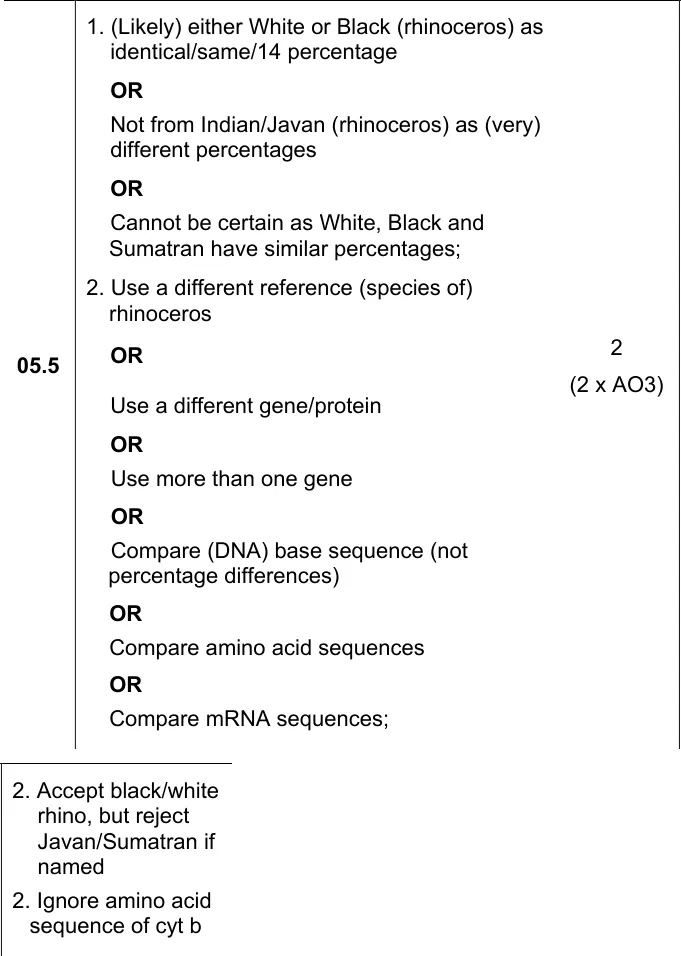
AS Paper 2 · June 2022 · Q05.5 · 2 marks · Medium
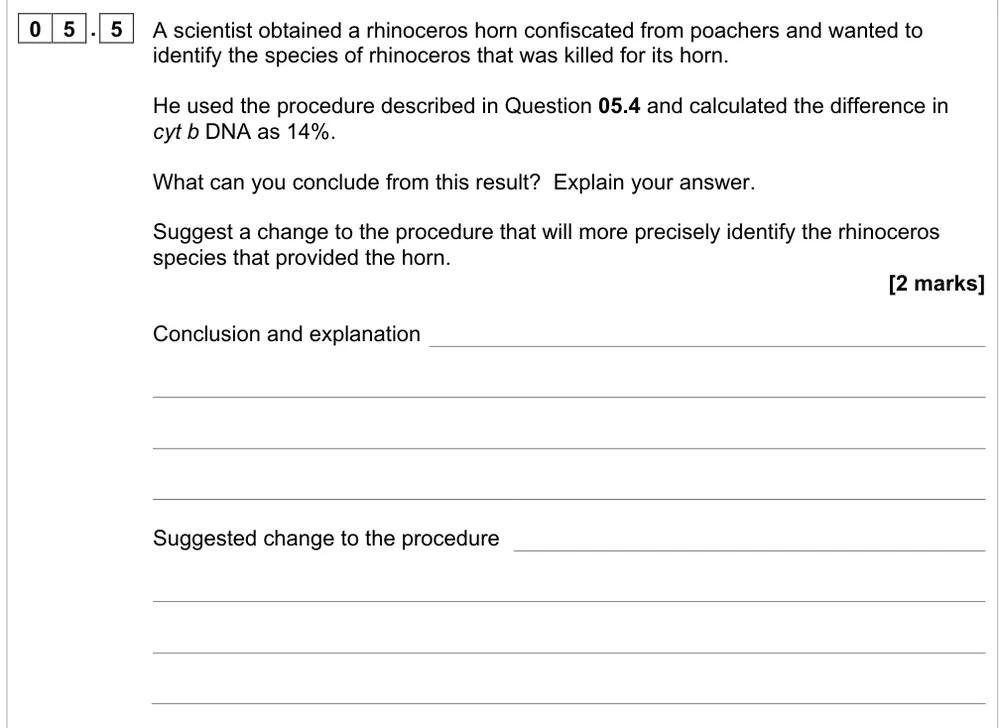
Identify the species a rhinoceros horn came from and suggest a better procedure.
Show the mark scheme
Tap an image to open it full size.
From the examiners' report: Over 76% got at least 1 mark. For the change, say exactly what to compare, such as a different gene or the base sequences themselves; vague answers about comparing the horns didn't score.
Question 14
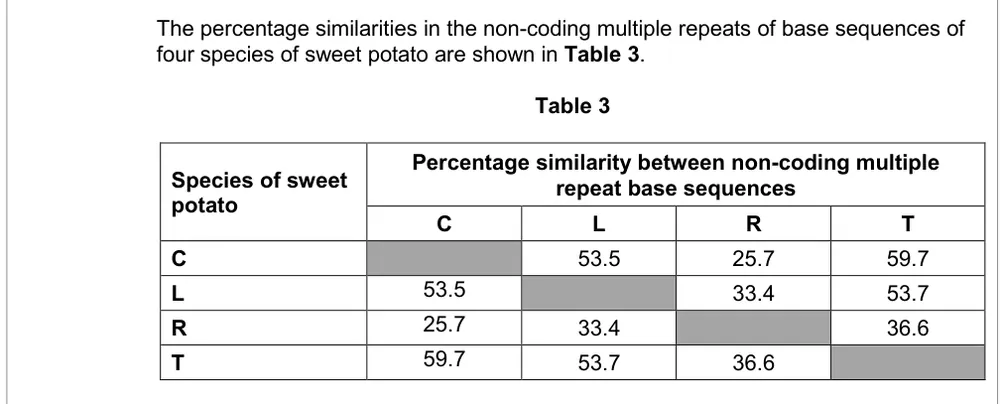
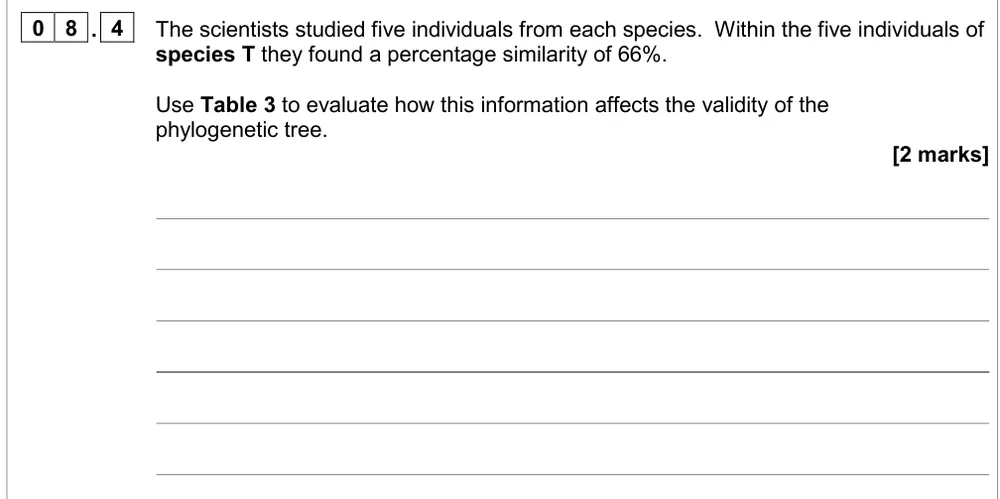
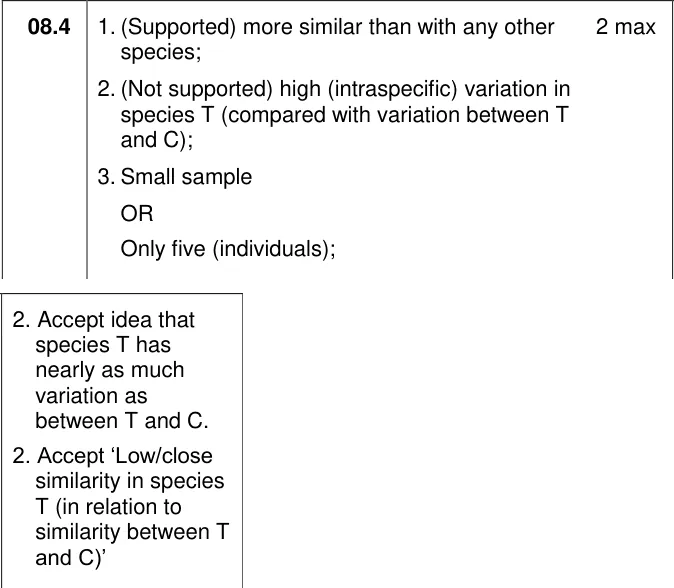
A level Paper 1 · November 2020 · Q08.4 · 2 marks · Hard
Evaluate how variation within one species affects a phylogenetic tree.
Information from earlier in this question:
Show the mark scheme
Tap an image to open it full size.
From the examiners' report: Many misread this as adding a new species. It's about variation within species T, which is nearly as large as the difference between T and C. Five individuals is also a small sample.
Interpreting means and standard deviations (3.4.7)
Question 15
AS Paper 2 · June 2016 · Q04.3 · 2 marks · Hard
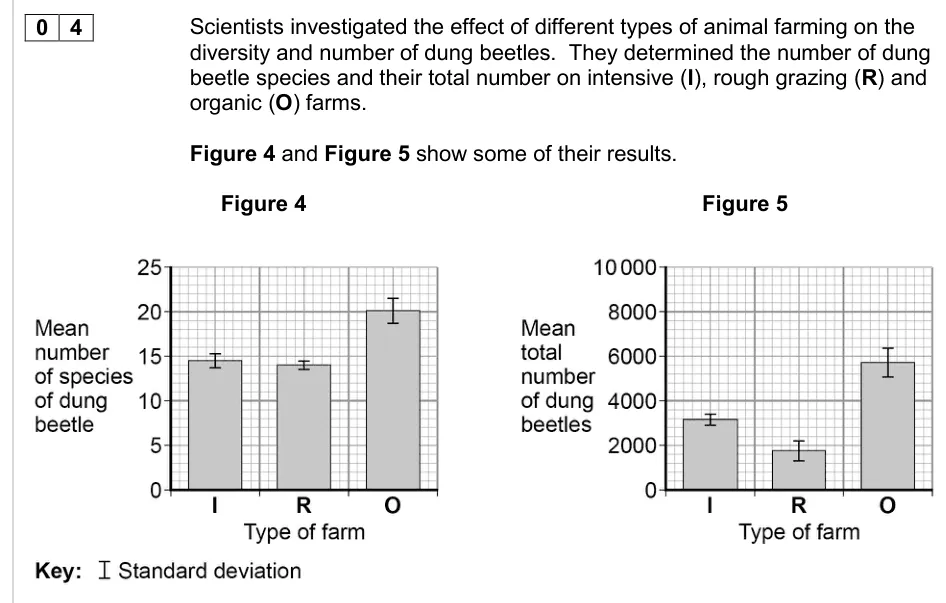
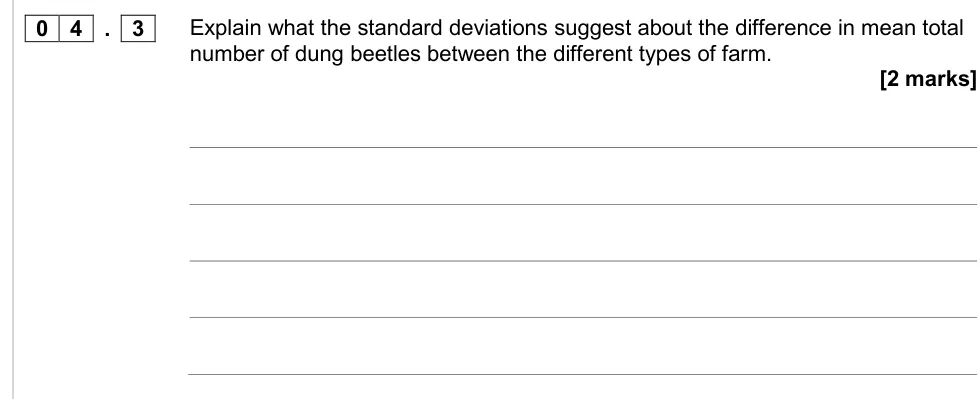
Explain what standard deviations show about the difference in mean number of dung beetles.
Information from earlier in this question:
Show the mark scheme

Tap an image to open it full size.
From the examiners' report: Almost two thirds scored zero, and many used Figure 4 instead of Figure 5. The SD bars in Figure 5 don't overlap, so the differences in mean total are significant.
Question 16
AS Paper 2 · June 2017 · Q04.3 · 2 marks
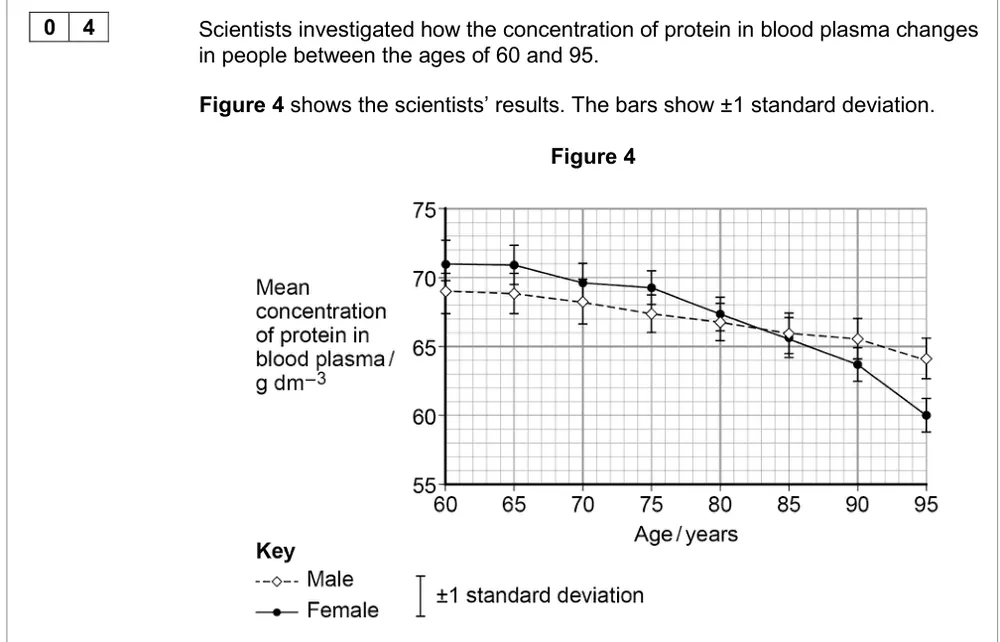
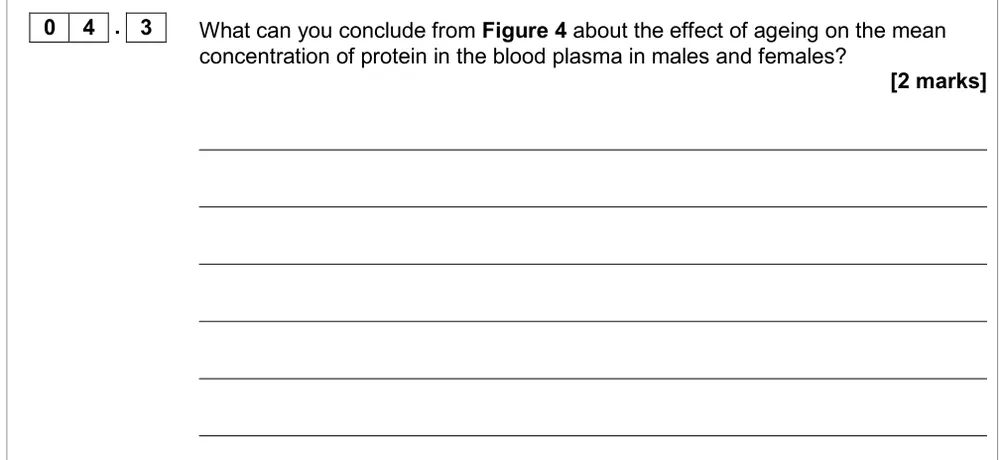
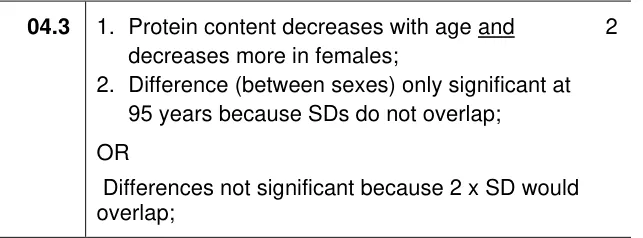
Use means and standard deviations to conclude how ageing affects plasma protein in males and females.
Information from earlier in this question:
Show the mark scheme
Tap an image to open it full size.
From the examiners' report: No examiners' report comment for this part. Describe the trend for both sexes, then use the SD bars: they only separate at 95 years.
Where students lose marks (from AQA examiners' reports and mark schemes)
Each point below is followed by wording that gained marks.
Say 'base sequence of DNA', not 'sequence of DNA': About 15% got both marks for two ways to compare genetic diversity. Many left out 'bases' or 'sequence', didn't say the amino acid sequence was of a polypeptide or protein, or wrote about courtship and phylogeny.
✔ Gains credit: "Base sequence of DNA; base sequence of mRNA; amino acid sequence of (the same) polypeptides or proteins."
Make it a comparison: Many answers didn't make a comparison, so 'amino acid sequence' on its own didn't score, and 'amino acids' without sequences didn't either. 'Immunological differences' lacked detail, and courtship was the commonest ignored answer.
✔ Gains credit: "Comparing measurable or observable characteristics; comparing amino acid sequences of the same protein"; or "comparing the amount of antibody bound to the protein".
Name the sequencing, not 'better technology': On why knowledge of soil prokaryotes has grown, most just said technology had improved, or suggested better electron microscopes. Few named DNA or genome sequencing, and very few said it identifies more species.
✔ Gains credit: "DNA or genome sequencing is now used; so more prokaryote species can be analysed, rather than just recording observable characteristics."
More differences, earlier common ancestor: 56.4% scored zero on how haemoglobin primary structure shows relationships, and the mean was 0.46 out of 5. Many wrote about protein structure or altitude, said species 'share a common ancestor', and few mentioned mutation.
✔ Gains credit: "Mutations change the base sequence and the amino acid sequence; they build up over time; more differences between distantly related species, which have an earlier common ancestor."
Differences inside one species are variation: Only 2% got full marks on the rhinoceros DNA data. Few saw that the 2% difference among Indian rhinos is variation within a species, and many claimed black and white rhinos are closely related to each other.
✔ Gains credit: "Genetic variation exists between Indian rhinos; comparisons only made to one Indian rhino; cannot conclude anything about the relationships between the other species."
Choose the individuals at random, not the sites: On making a snail sample reliable, using a large sample was common, but selecting snails at random was less common and was often confused with selecting sites at random.
✔ Gains credit: "Select at random; large sample or number (of snails), more than 10."
Give the reason as well as the step: About 5% got both marks on collecting cherry leaves for valid data. Many only described the method when the question said 'describe and explain'.
✔ Gains credit: "Random sample so no bias; large sample so representative, or so a reliable mean can be calculated."
Read the SDs from the figure the question names: Almost two thirds scored zero on what the standard deviations show about dung beetle numbers. Many didn't understand standard deviations, and many used Figure 4 instead of Figure 5.
✔ Gains credit: "No overlap in standard deviations, so the difference in mean total is significant, not due to chance."
Download the questions
Download the PDF pack (16 questions, mark schemes at the end)
Keep practising
- Biodiversity within a community: AQA A Level Biology exam questions by topic
- Handling data (MS 1): AQA A Level Biology exam questions by topic
- Species and taxonomy: AQA A Level Biology exam questions by topic
- Genetic diversity and adaptation: AQA A Level Biology exam questions by topic
- DNA and protein synthesis: AQA A Level Biology exam questions by topic
- AQA A Level Biology masterclasses
Questions, mark schemes and examiners' report extracts © AQA.