

Biodiversity within a community (AQA 3.4.6) is one of the shortest sections of the Year 12 specification, but it turns up on AS and A-level papers almost every year, usually as data from a field study. You need to know that biodiversity can relate to anything from a small local habitat to the whole Earth, define species richness and an index of diversity, calculate d = N(N − 1) ÷ Σn(n − 1), and explain how farming techniques reduce biodiversity and how conservation and farming are balanced.
The examiners' reports keep finding the same slips. Students write 'population' instead of 'community', count individuals when only the number of species is needed, ask for the total number of organisms instead of the number in each species, and say a low index means every species is rare. On farming questions they write 'more food' or 'less shelter' instead of linking plant species to food sources and niches, and stop before saying what a lower yield means for the farmer.
Start with the definitions, then the habitat and farming questions, then the data and P values, and finish with the calculations. Answer each question on paper with a calculator before you open the mark scheme. If you'd like help with this topic, my AQA masterclasses run online on Tuesdays at 5.15pm for Year 12 and on Wednesdays or Thursdays at 6.30pm for Year 13.
What you need from GCSE and Year 12
Each question on this page assumes you're secure on these GCSE and Year 12 ideas. If any of them feels shaky, revise it before you start.
- GCSE: a population is all the organisms of one species in a habitat; a community is all the populations of different species living in that habitat.
- GCSE: biodiversity is the variety of all the different species of organisms on Earth, or within an ecosystem.
- GCSE: random sampling with quadrats to estimate the abundance of a species, and why more samples give a more representative mean.
- GCSE: hedgerows and field margins help to keep biodiversity on farmland, but farmers also need high yields.
- Year 12 (AQA 3.4.5): two organisms belong to the same species if they are able to produce fertile offspring.
Key terms
These words come up in the questions and mark schemes. Examiners expect you to use them exactly.
- Biodiversity: the variety of living organisms; it can relate to a range of habitats, from a small local habitat to the Earth.
- Community: all the populations of different species living in the same place at the same time.
- Population: all the organisms of one species in a habitat; species richness is never measured 'in a population'.
- Species richness: a measure of the number of different species in a community.
- Index of diversity: describes the relationship between the number of species in a community and the number of individuals in each species.
- N: in d = N(N − 1) ÷ Σn(n − 1), the total number of organisms of all species.
- n: the total number of organisms of each species; Σn(n − 1) adds up n(n − 1) for every species.
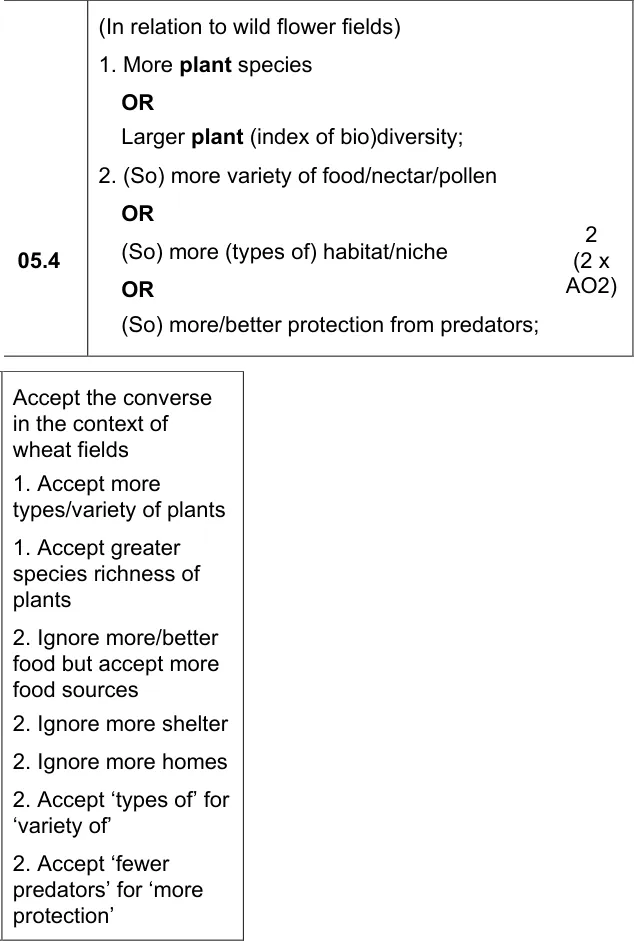
- Habitats or niches: more plant species give animals more habitats or niches and a greater variety of food sources; 'homes' and 'shelter' don't score.
- Conservation: protecting species and habitats; it has to be balanced against farming, where a lower yield means less food or less profit.
- Significant difference: a difference between two means that is unlikely to be due to chance, for example P less than 0.05, or standard deviations that don't overlap.
What these questions cover (AQA 3.4.6)
The questions test these statements from the AQA AS and A-level Biology specification (7401/7402):
- Biodiversity: Biodiversity can relate to a range of habitats, from a small local habitat to the Earth. (the rainforest question is the only part that asks about biodiversity across a whole ecosystem)
- Species richness: Species richness is a measure of the number of different species in a community.
- Index of diversity: An index of diversity describes the relationship between the number of species in a community and the number of individuals in each species.
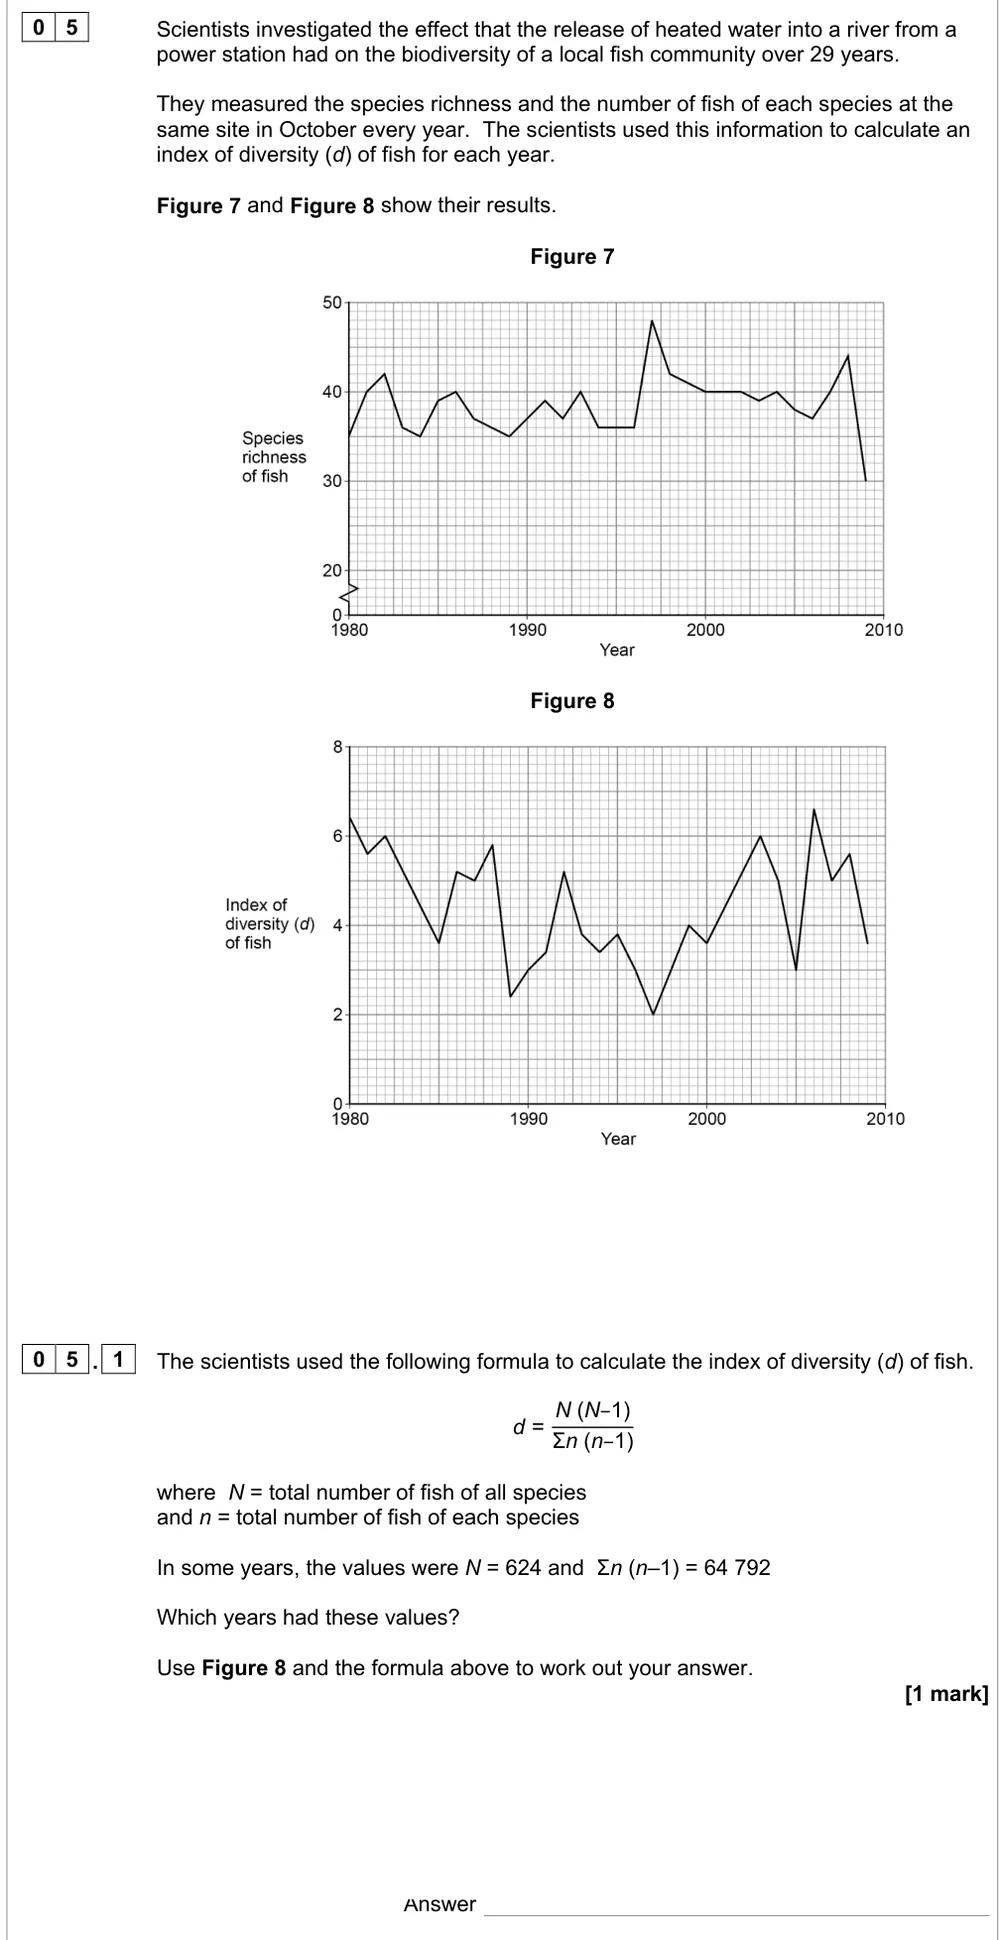
- Calculation of an index of diversity (d) from the formula d = N(N − 1) ÷ Σn(n − 1), where N = total number of organisms of all species and n = total number of organisms of each species. (the 2023 fish question asks you to work backwards from N and Σn(n − 1) to find the years on a graph)
- Farming and conservation: Farming techniques reduce biodiversity. The balance between conservation and farming.
How to use this page
Write your answer on paper before you open the mark scheme. Allow about 1.3 minutes per mark: the 18 questions are worth 38 marks, so about 49 minutes in total. Then mark your answer strictly against the mark scheme and read the examiners' tip underneath it. If you'd rather print the questions, download the PDF pack.
Species richness and index of diversity (3.4.6)
Question 1
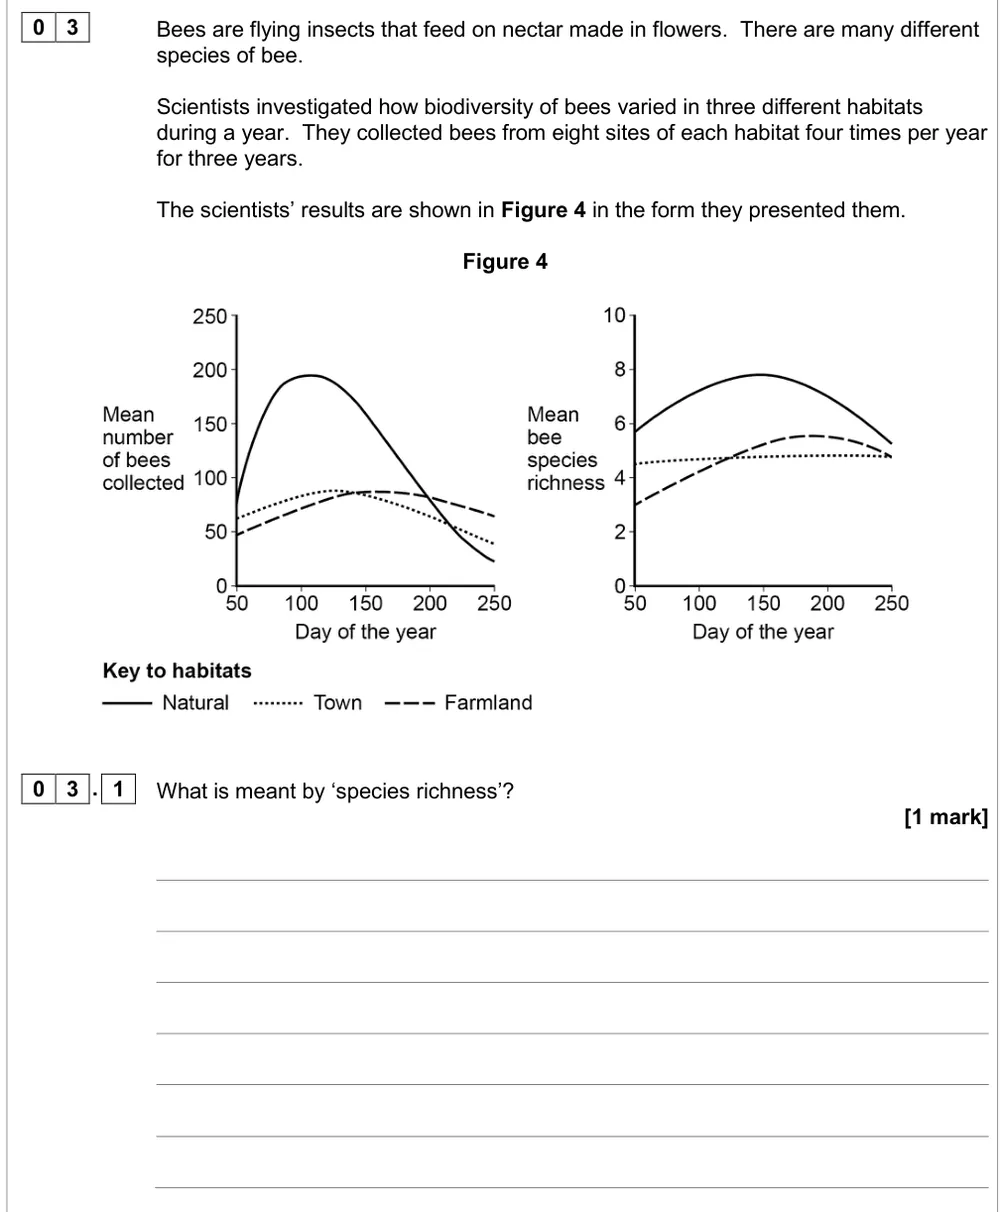
A level Paper 1 · June 2018 · Q03.1 · 1 mark · Easy
Explain what is meant by species richness.
Show the mark scheme

Tap an image to open it full size.
From the examiners' report: 67.1% got it. Say community, not population, and don't mix species richness up with the index of diversity.
Question 2
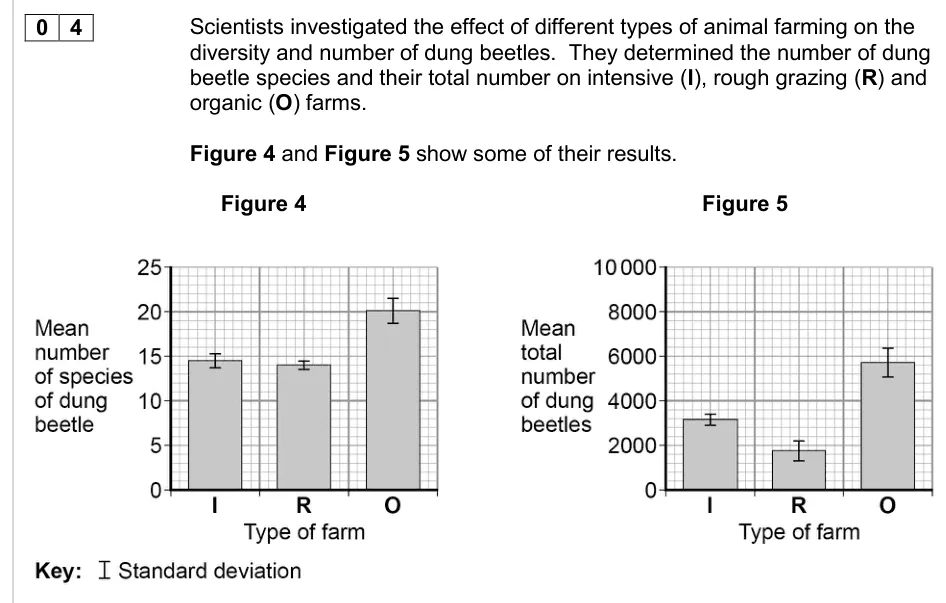
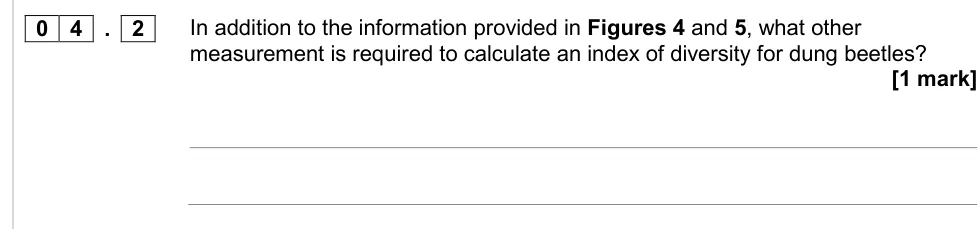
AS Paper 2 · June 2016 · Q04.2 · 1 mark · Medium
State what other measurement is needed to calculate an index of diversity for dung beetles.
Information from earlier in this question:
Show the mark scheme

Tap an image to open it full size.
From the examiners' report: Fewer than 50% got it. The total number of beetles is already in Figure 5; you need the number of individuals in each species.
Question 3
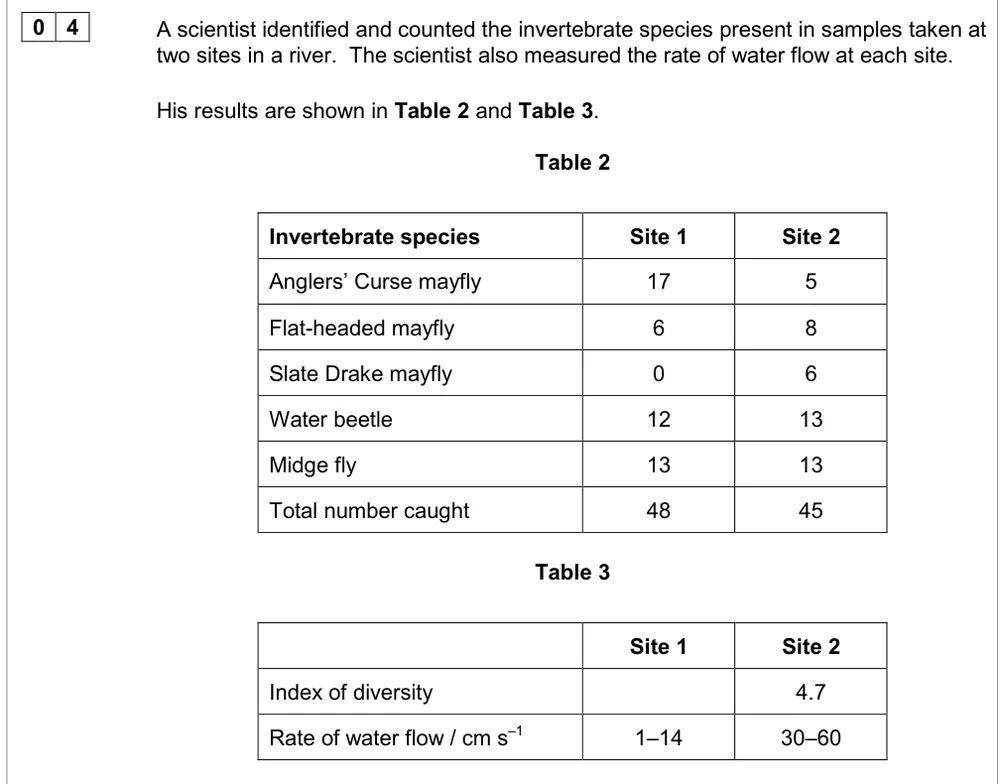
AS Paper 1 · June 2019 · Q04.2 · 2 marks
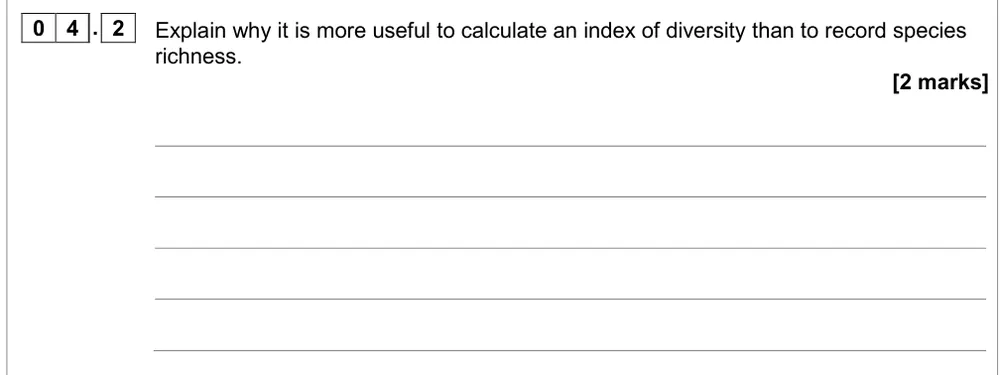
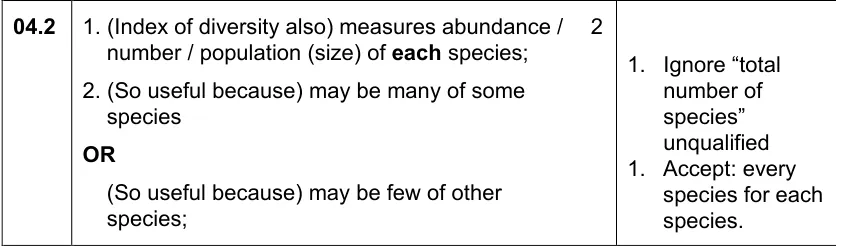
Explain why an index of diversity is more useful than species richness.
Information from earlier in this question:
Show the mark scheme
Tap an image to open it full size.
From the examiners' report: No examiners' report for this paper. The mark scheme wants the number of individuals of each species, then why that matters: some species may be common and others rare.
Question 4
A level Paper 3 · June 2017 · Q04.2 · 3 marks
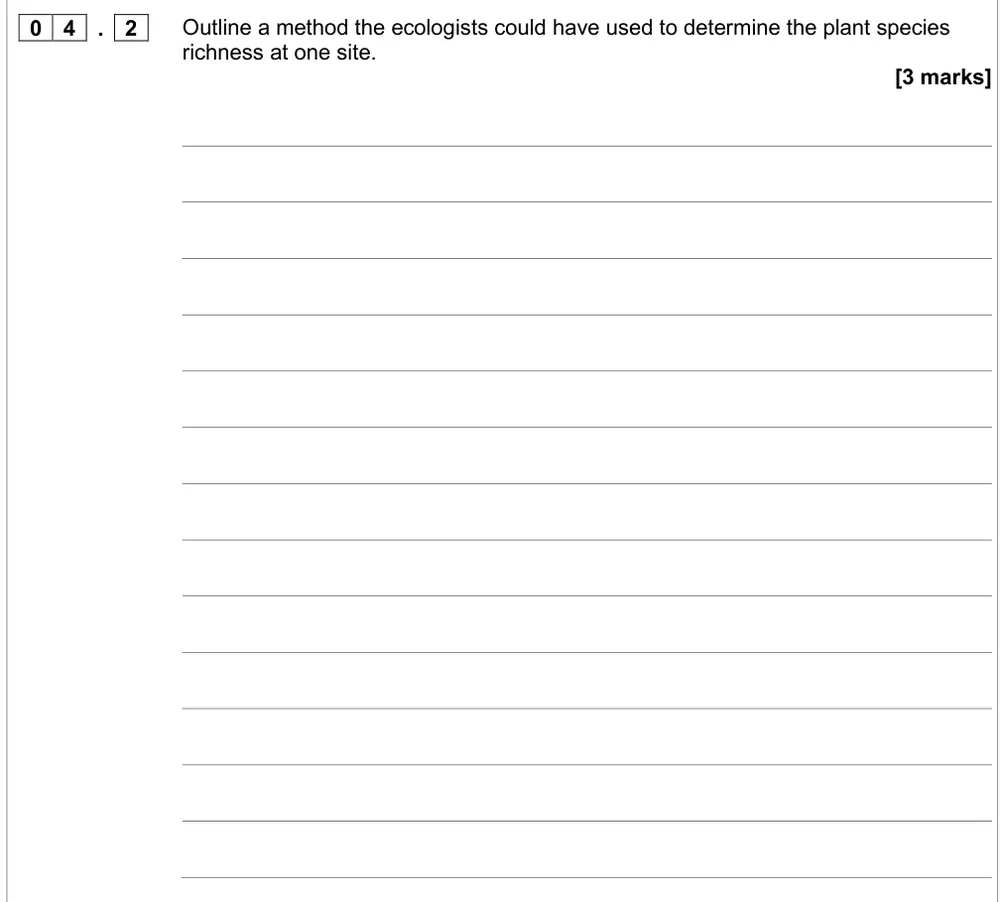
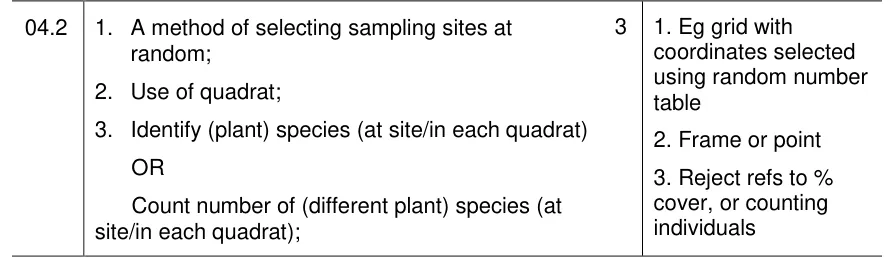
Outline a method to determine plant species richness at one site.
Information from earlier in this question:

Show the mark scheme
Tap an image to open it full size.
From the examiners' report: The commonest error was counting individuals or the percentage cover of each species. For species richness you only identify and count the species; mention both and you lose the mark.
Question 5
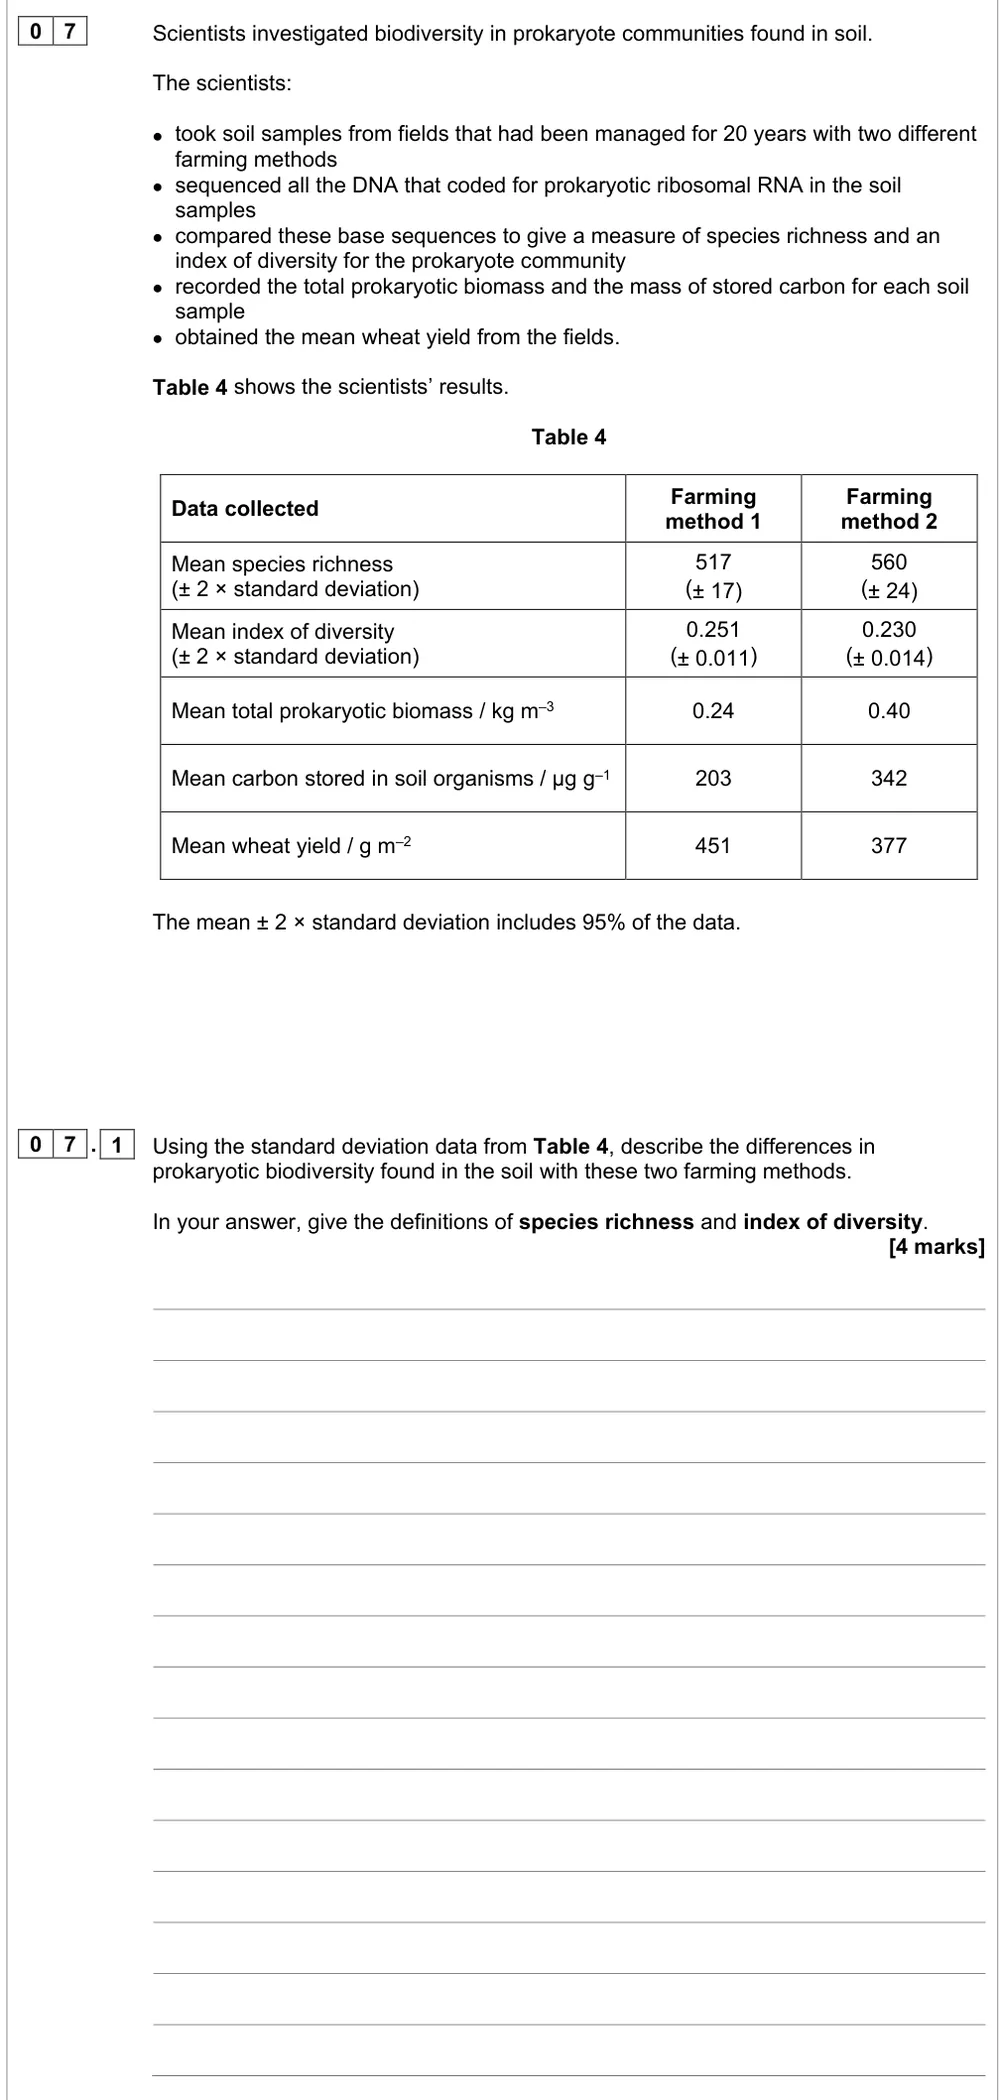
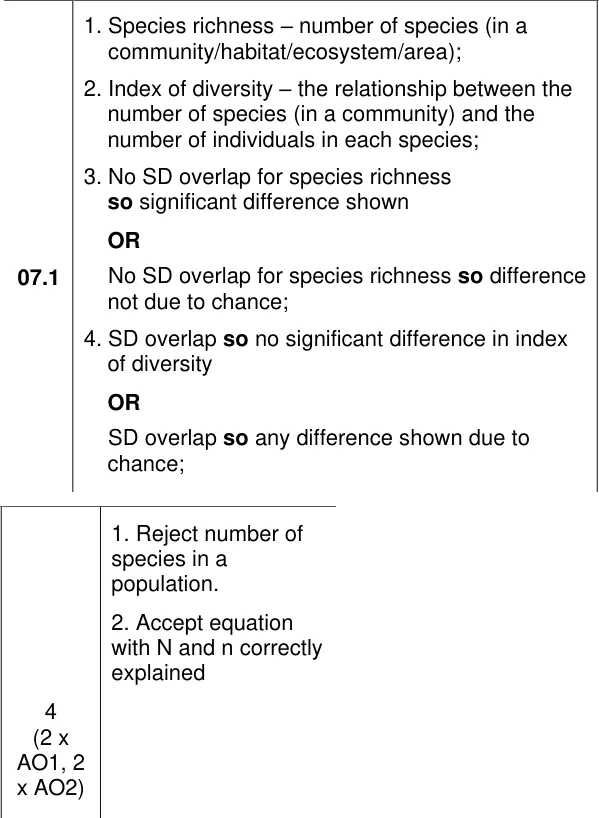
AS Paper 1 · June 2023 · Q07.1 · 4 marks
Define species richness and index of diversity and use SDs to compare two farming methods.
Show the mark scheme
Tap an image to open it full size.
From the examiners' report: The index of diversity was defined less well than species richness. 'Number of species in a population' was wrong. No overlap of SDs means a significant difference; overlap means the difference may be due to chance.
Biodiversity, habitats and farming (3.4.6)
Question 6
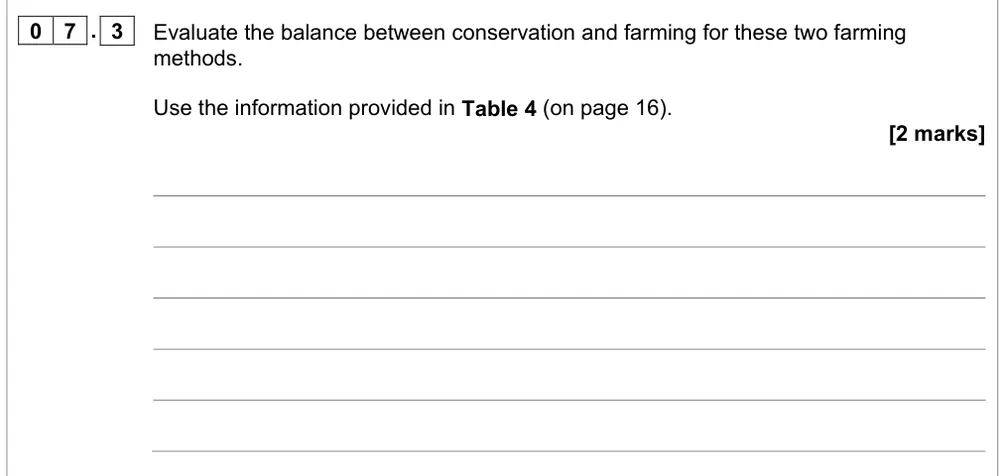
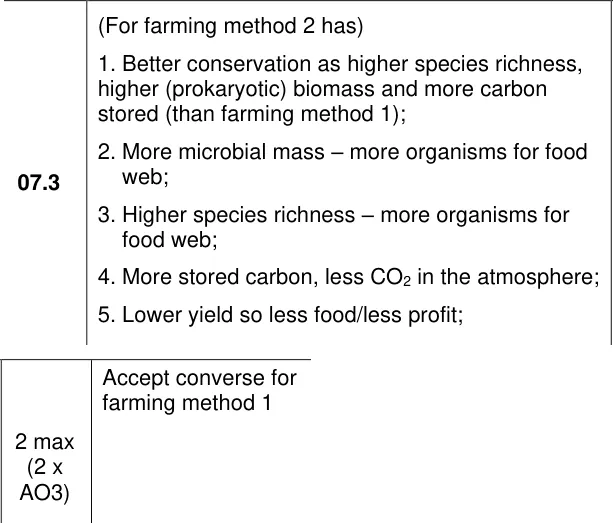
AS Paper 1 · June 2023 · Q07.3 · 2 marks · Hard
Evaluate the balance between conservation and farming for two farming methods.
Show the mark scheme
Tap an image to open it full size.
From the examiners' report: Students struggled. Use all three conservation measures for method 2, then finish each point: more stored carbon means less CO2 in the atmosphere, and a lower yield means less food or less profit.
Question 7
A level Paper 2 · June 2025 · Q10.1 · 3 marks · Medium
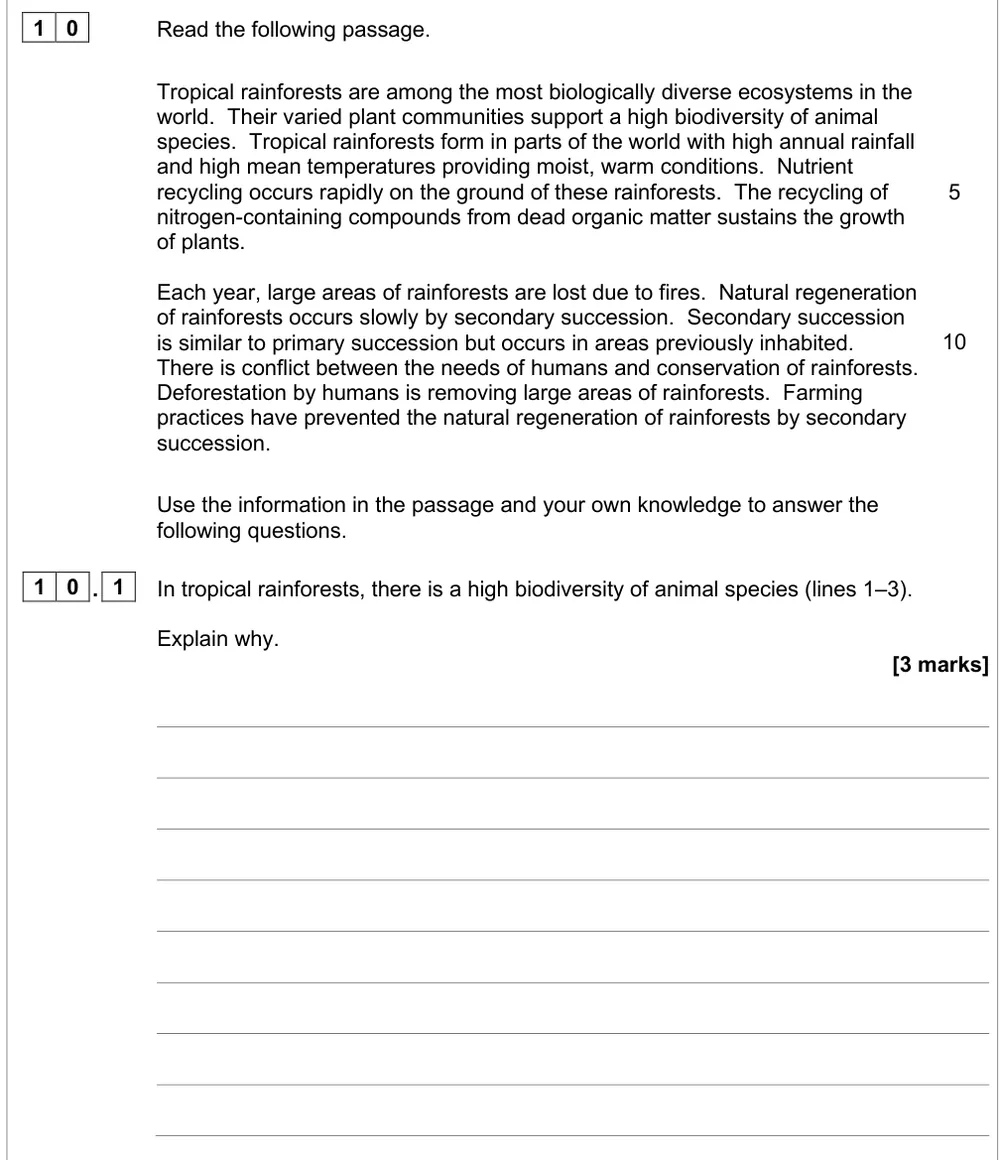
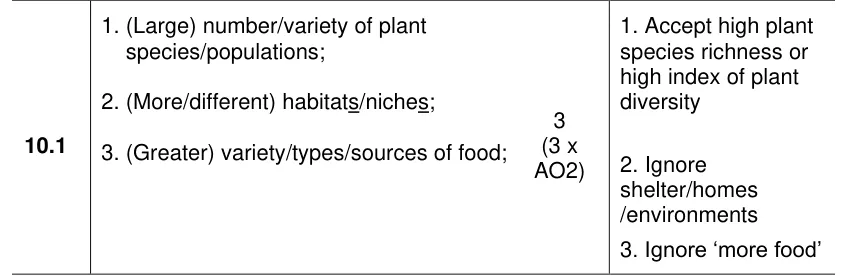
Explain why tropical rainforests have a high biodiversity of animal species.
Show the mark scheme
Tap an image to open it full size.
From the examiners' report: Under 10% got all three. Start from the varied plants: many plant species give more habitats or niches and more types of food. 'More food' didn't score, and some wrote about succession instead.
Question 8
AS Paper 2 · June 2016 · Q04.5 · 3 marks · Medium
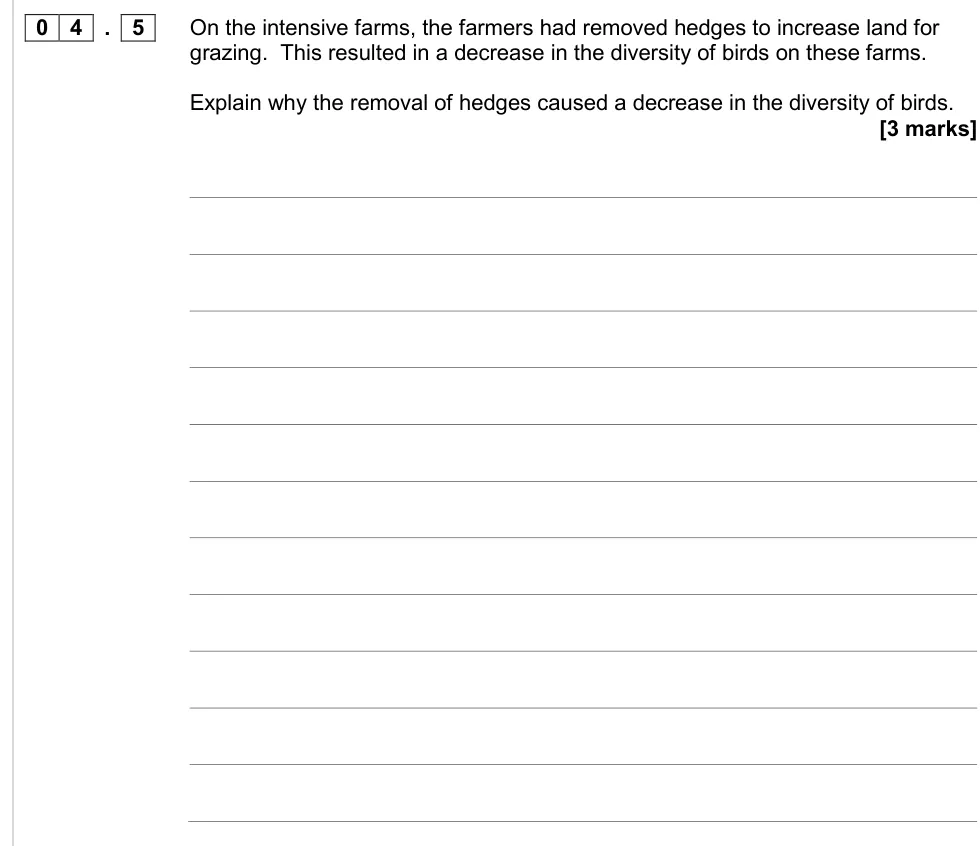
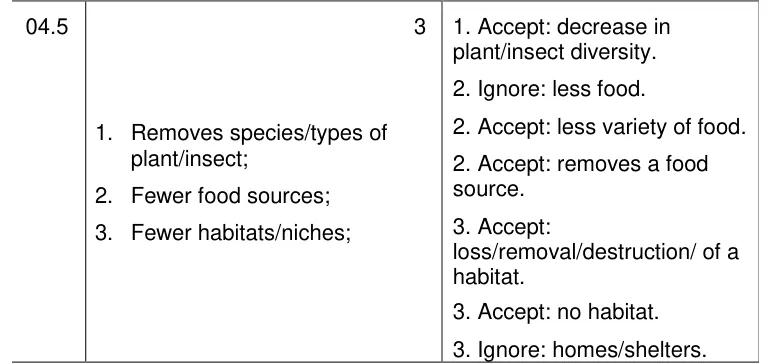
Explain why removing hedges decreased the diversity of birds on farms.
Information from earlier in this question:
Show the mark scheme
Tap an image to open it full size.
From the examiners' report: Most got a mark for habitat loss, but few linked removing hedges to losing plant and insect species. 'Less food', 'less homes' and 'less shelters' didn't score, and this is about species, not genetic diversity.
Question 9
AS Paper 1 · June 2024 · Q05.4 · 2 marks · Hard
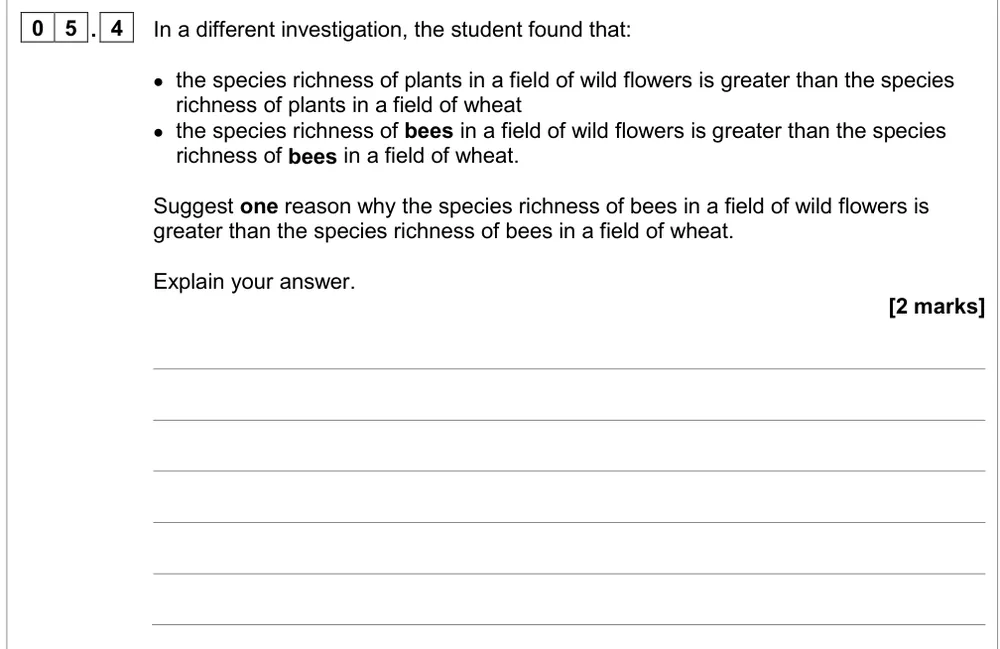
Explain why bee species richness is greater in a wild flower field than in a wheat field.
Show the mark scheme
Tap an image to open it full size.
From the examiners' report: Many found this hard. The first mark is for the higher plant diversity in the wild flower field; link it to more types of nectar or pollen as food for the bees.
Question 10
A level Paper 1 · June 2019 · Q03.4 · 2 marks
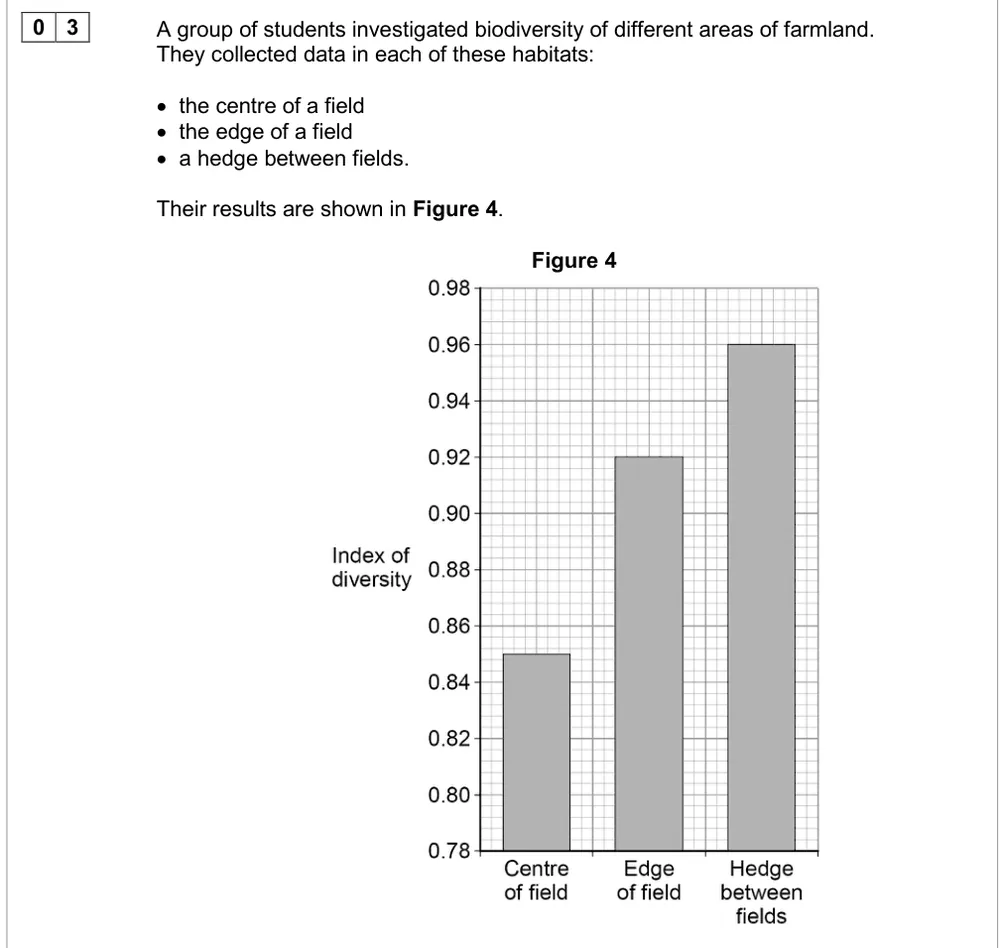
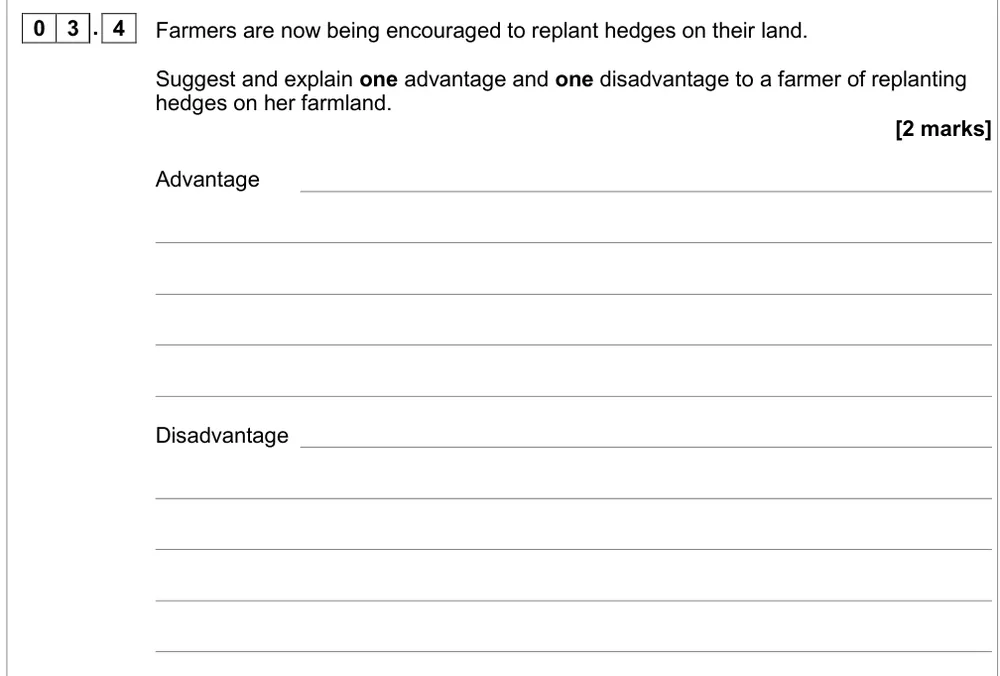
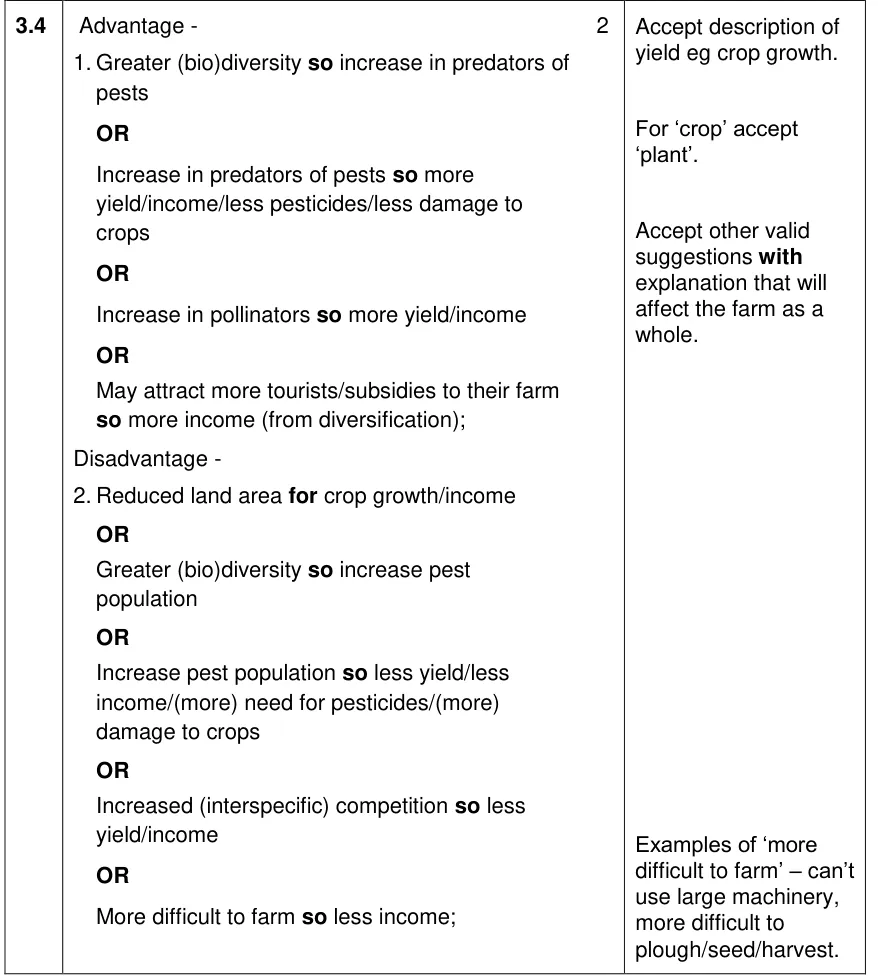
Suggest one advantage and one disadvantage to a farmer of replanting hedges.
Information from earlier in this question:
Show the mark scheme
Tap an image to open it full size.
From the examiners' report: No examiners' report for this paper. Each point needs a suggestion and its effect on the farm, for example more predators of pests so a higher yield, or less land for crops so less income.
Interpreting biodiversity data (3.4.6)
Question 11
AS Paper 1 · June 2017 · Q09.3 · 3 marks · Hard
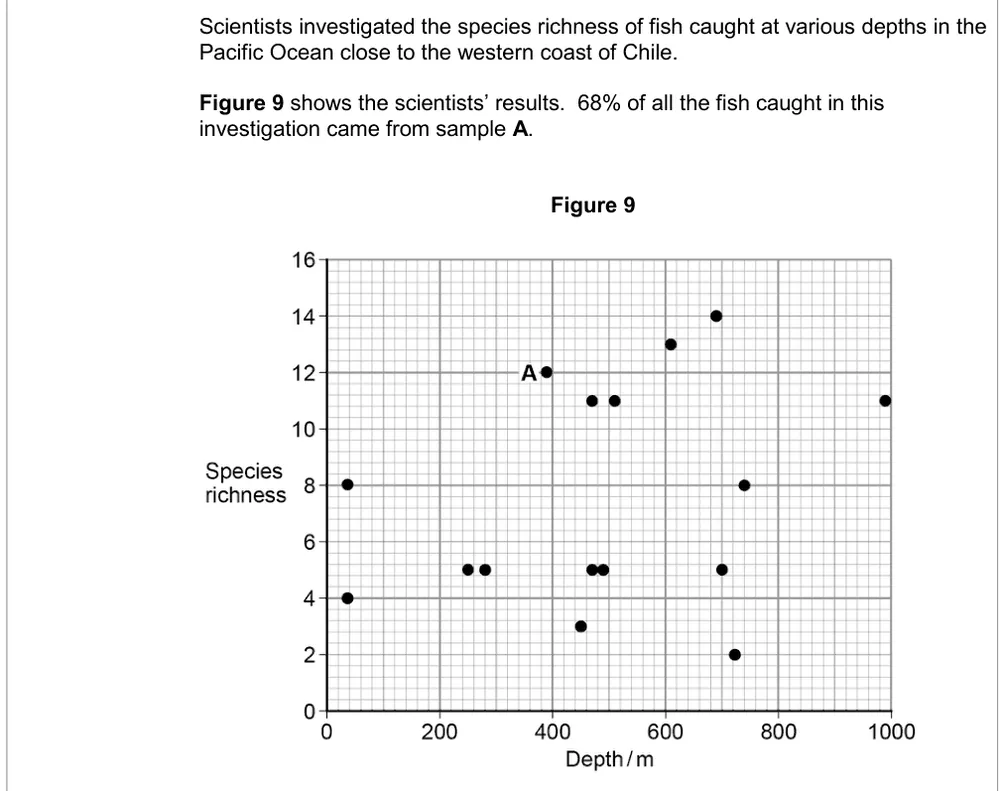
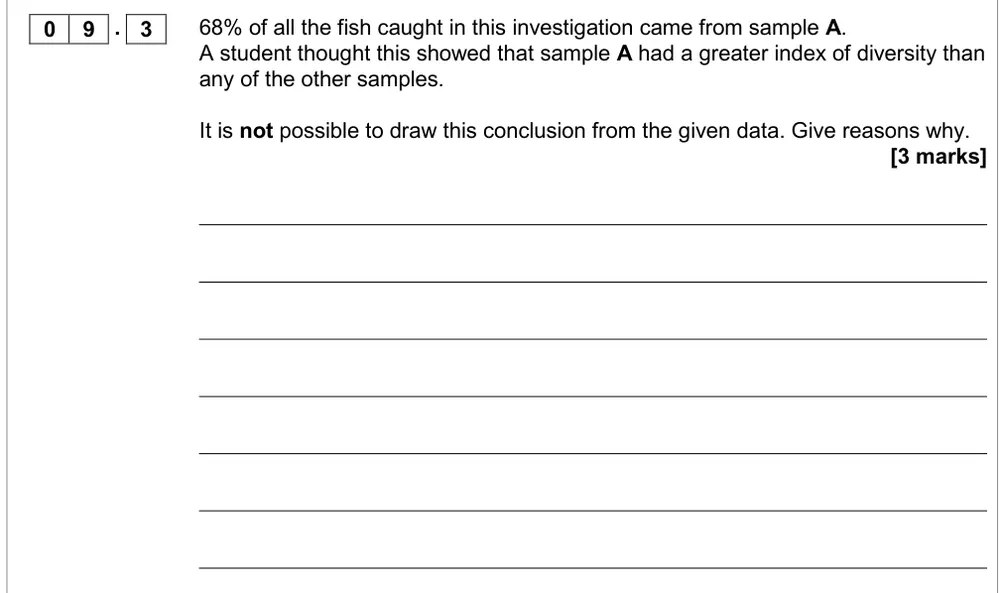
Explain why 68% of fish in one sample doesn't show it had the highest index of diversity.
Information from earlier in this question:
Show the mark scheme
Tap an image to open it full size.
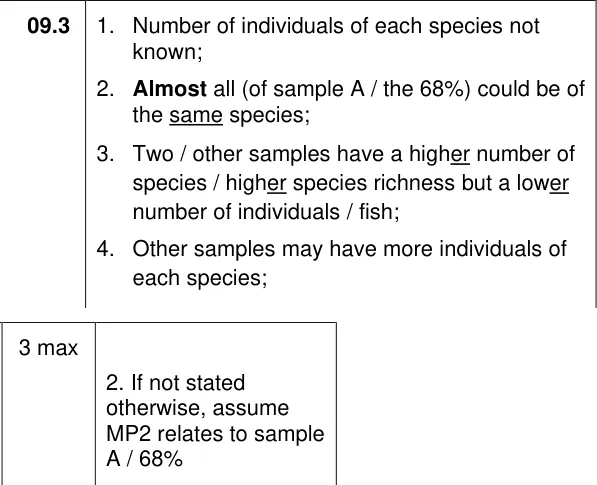
From the examiners' report: 62% scored zero and only 0.2% got all three. Generic answers about fair tests, repeats or sample size didn't score. Use the definition: the index needs the number of individuals of each species, which isn't given.
Question 12
A level Paper 3 · June 2017 · Q04.3 · 3 marks · Medium
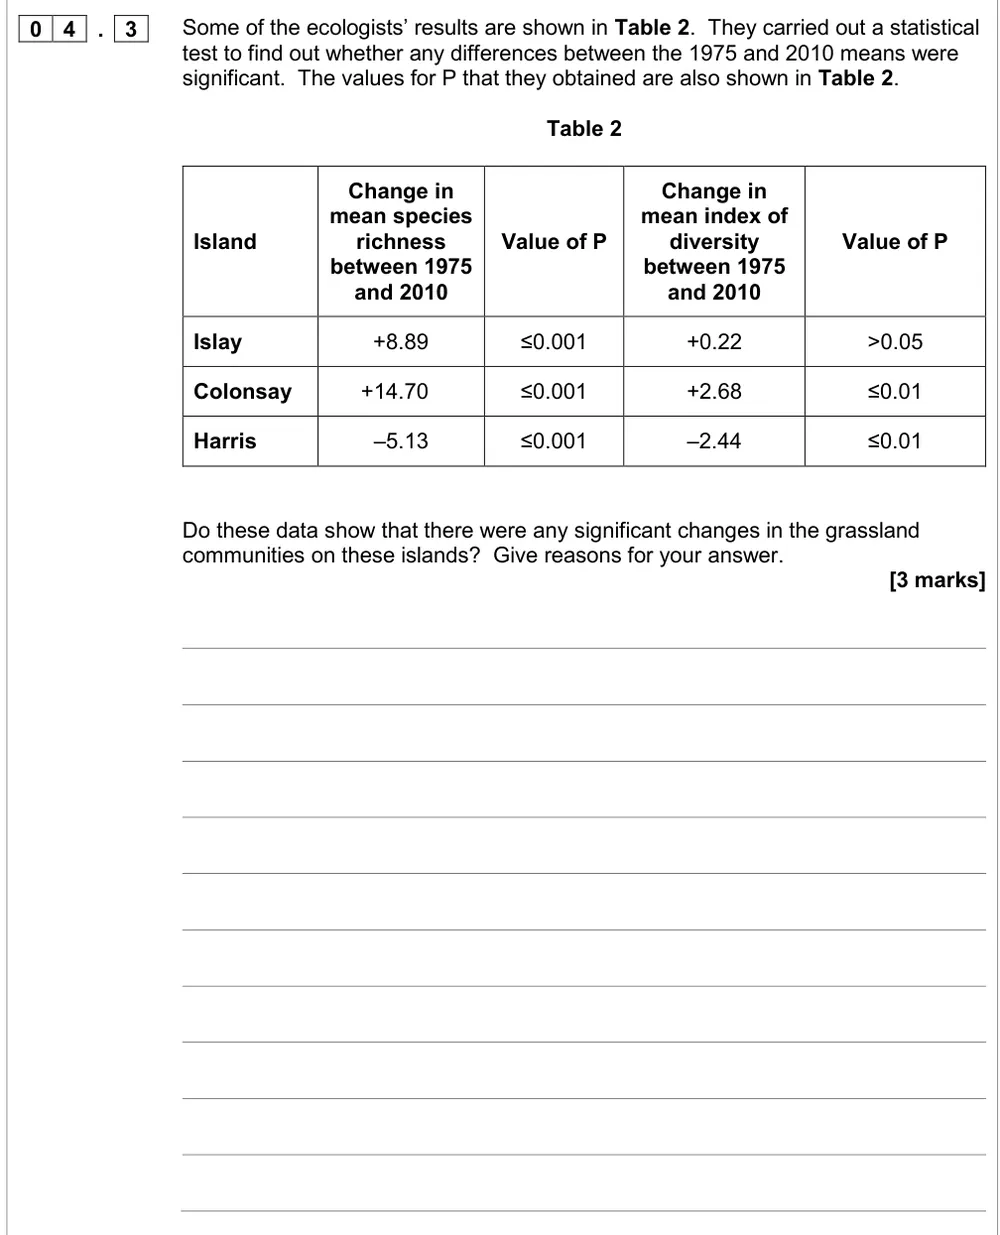
Use P values to decide whether changes in species richness and index of diversity were significant.
Information from earlier in this question:
Show the mark scheme
Tap an image to open it full size.
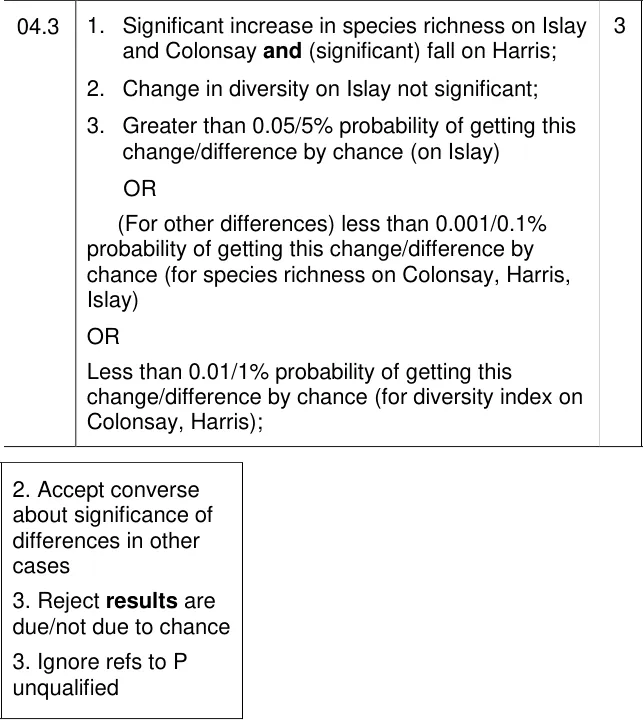
From the examiners' report: 46% scored zero. The test shows whether the difference between two means is significant, not whether the data are accurate. Read ≤ and > carefully, and say which changes were increases and which was a fall.
Question 13
A level Paper 1 · June 2022 · Q01.3 · 1 mark · Hard
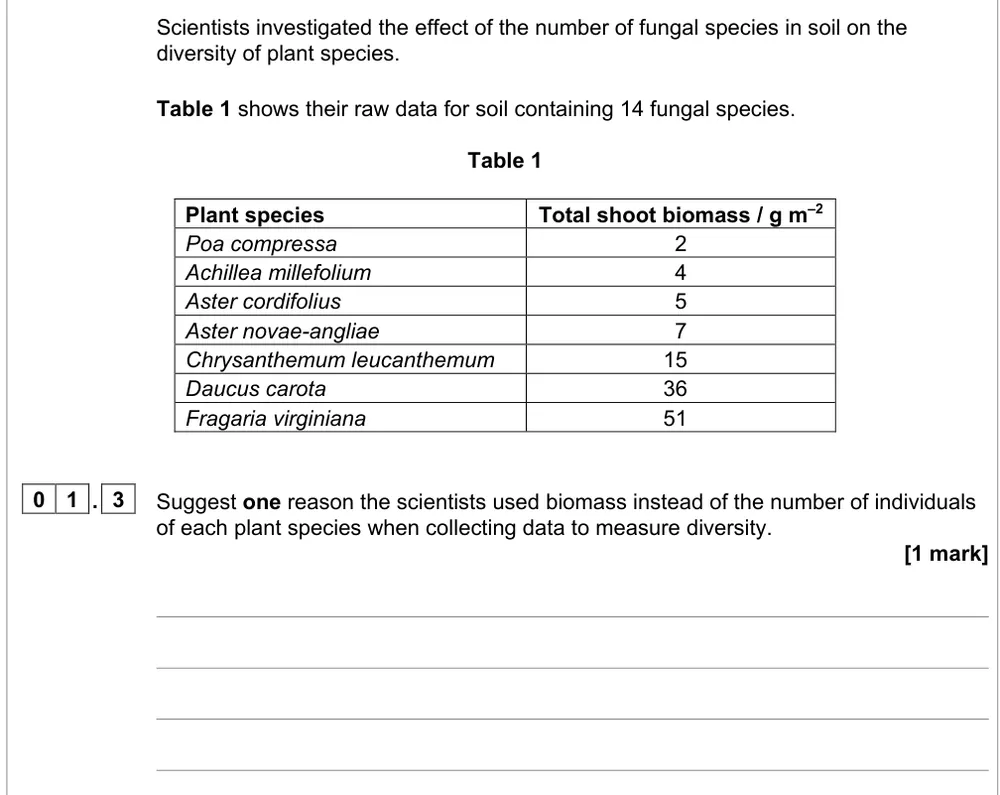
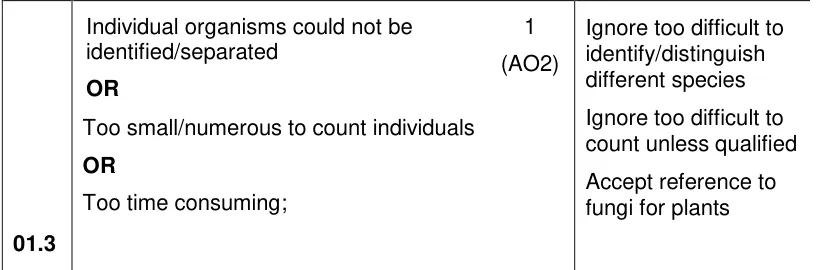
Suggest why biomass was used instead of numbers of individuals to measure plant diversity.
Show the mark scheme
Tap an image to open it full size.
From the examiners' report: Many compared it with a pyramid of biomass, which isn't the point. Say why individuals can't be counted: they can't be separated, or they are too small or too numerous.
Calculating an index of diversity (3.4.6)
Question 14
AS Paper 1 · June 2024 · Q05.3 · 2 marks · Medium
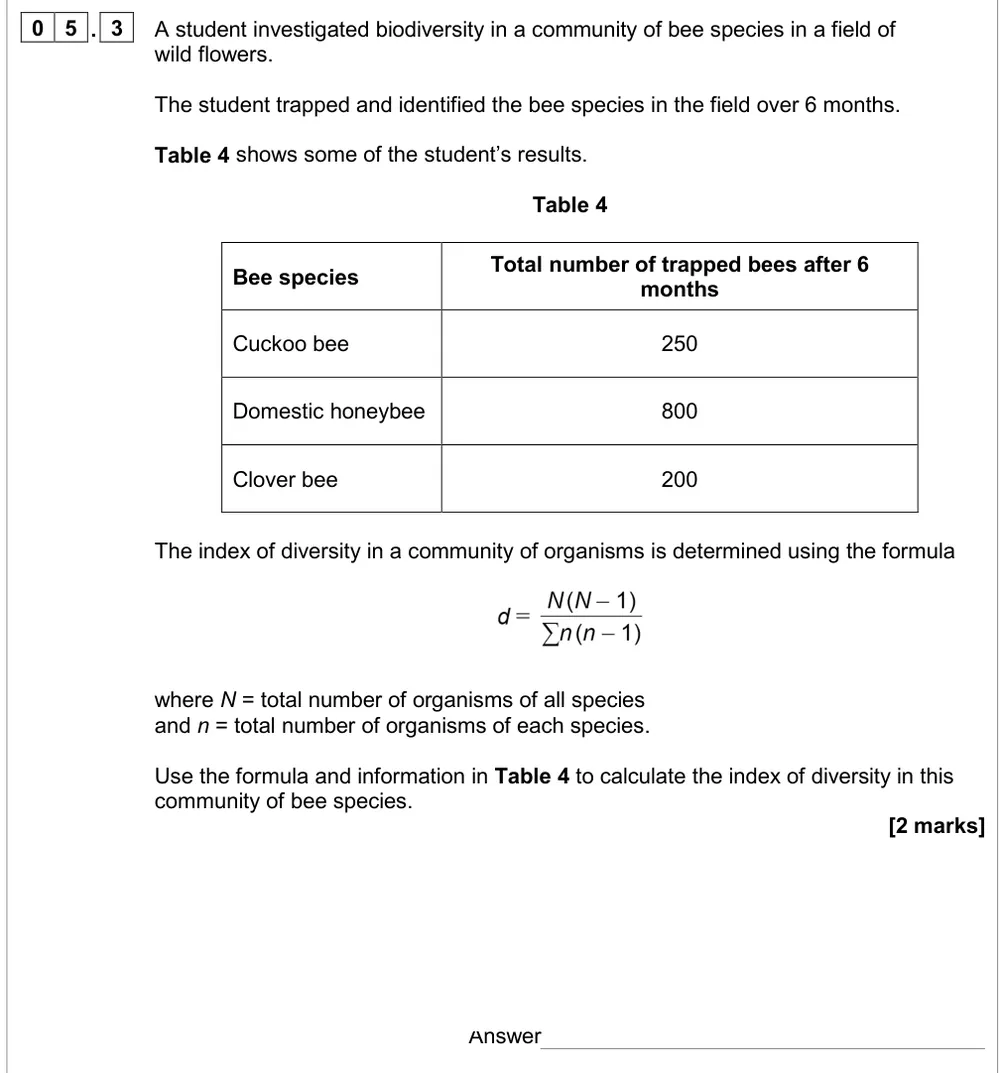
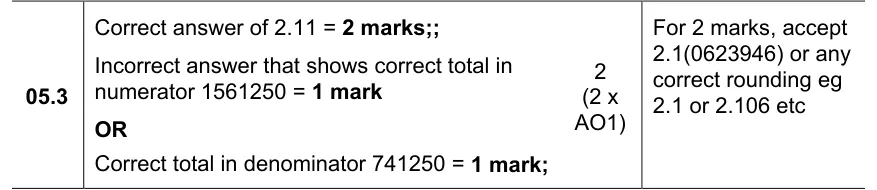
Calculate the index of diversity for three bee species.
Show the mark scheme
Tap an image to open it full size.
From the examiners' report: Three-quarters scored at least 1 mark. Each half of the formula earns a mark, so show N(N − 1) and Σn(n − 1) before you divide.
Question 15
AS Paper 1 · November 2021 · Q07.1 · 2 marks
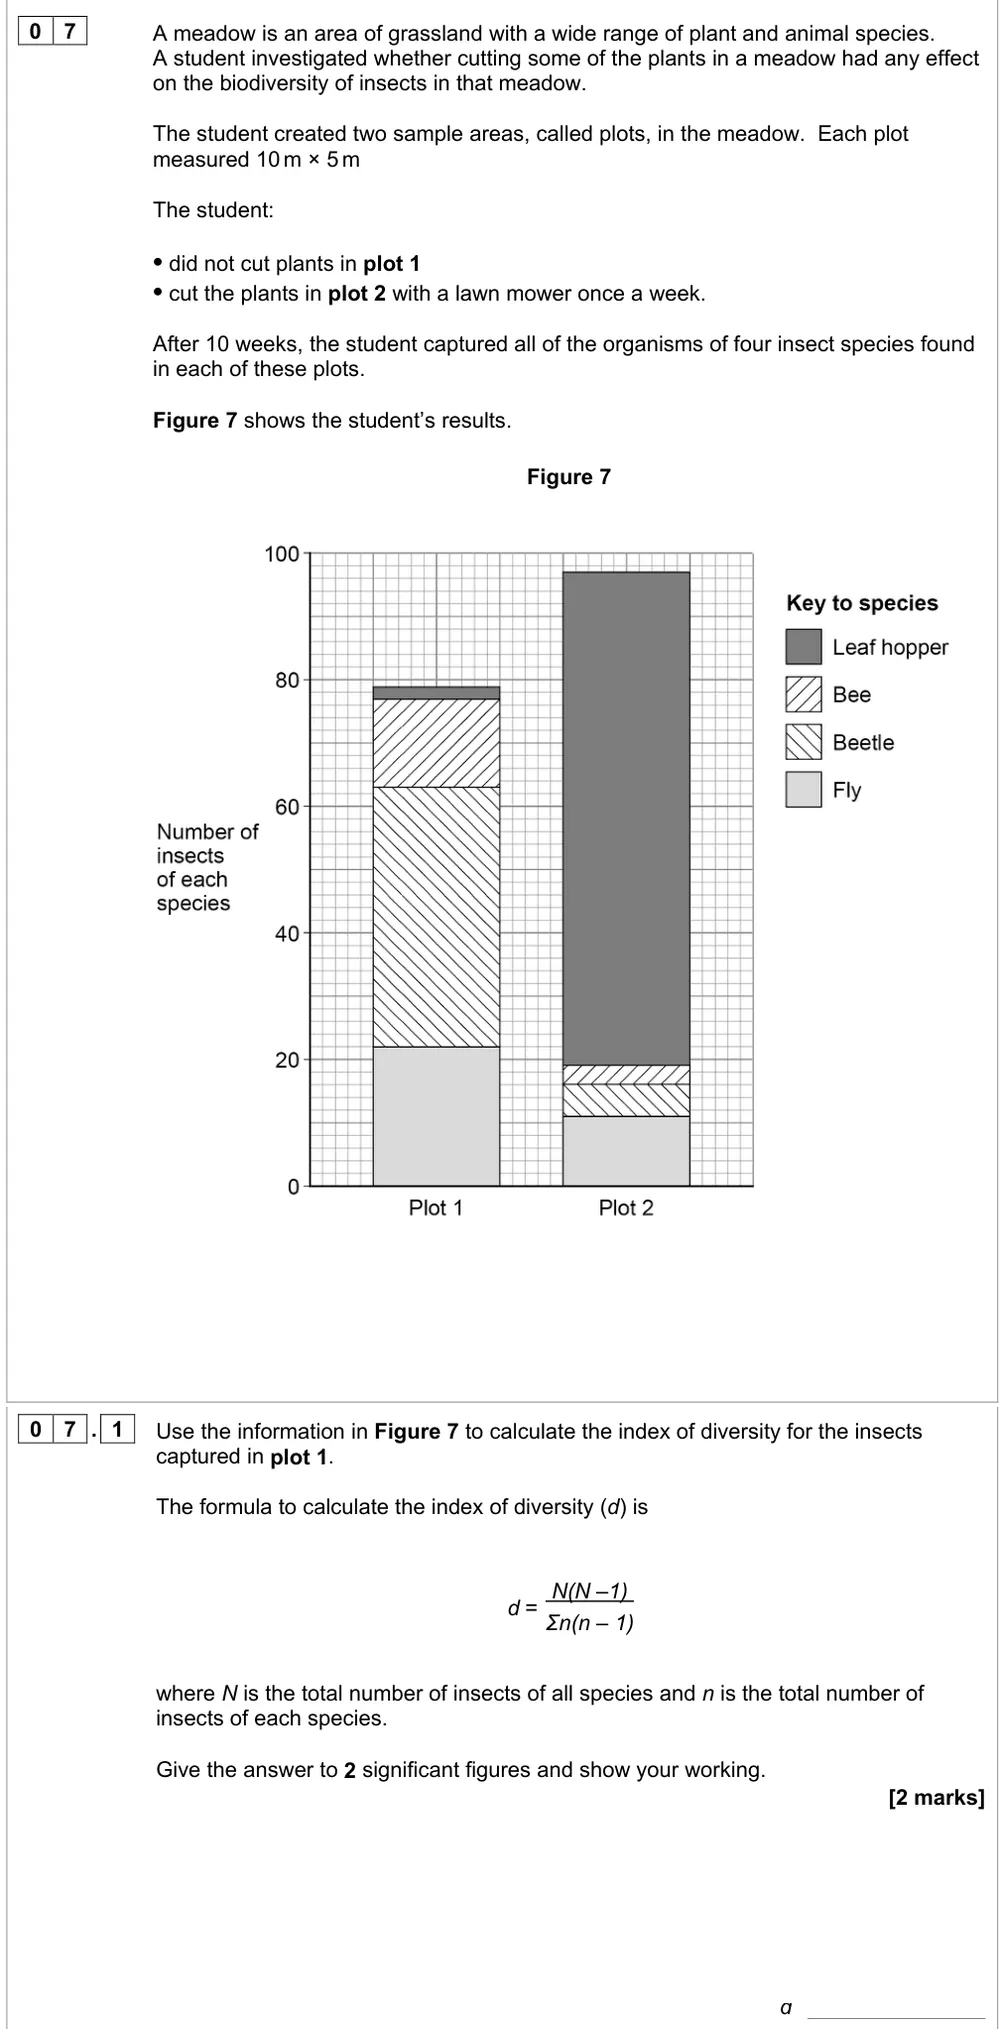
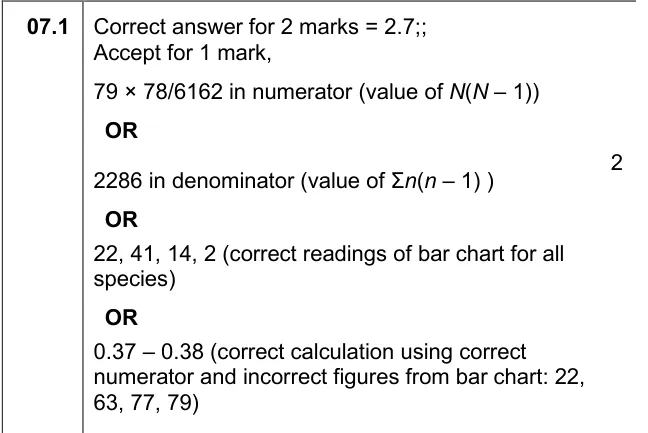
Calculate the index of diversity for insects from a stacked bar chart.
Show the mark scheme
Tap an image to open it full size.
From the examiners' report: No examiners' report for this paper. The mark scheme expects readings of 22, 41, 14 and 2 for each species: read each segment of the stacked bar, not the running totals 22, 63, 77 and 79.
Question 16
AS Paper 1 · November 2021 · Q07.2 · 1 mark
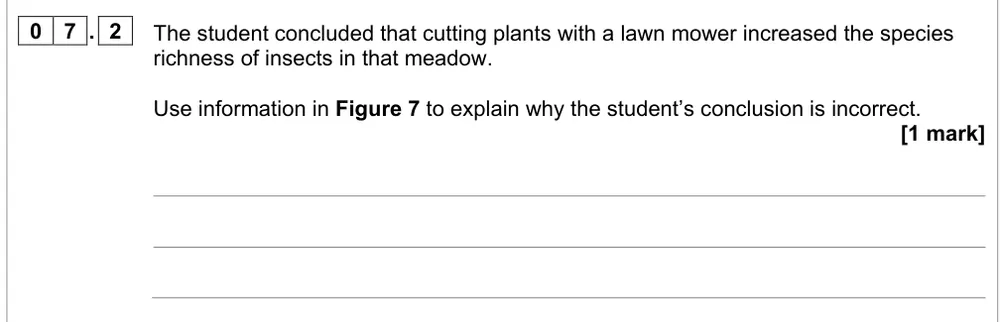
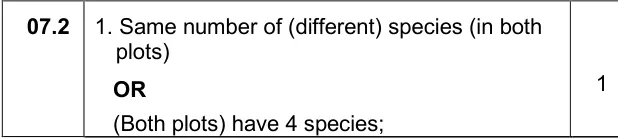
Explain why mowing didn't increase insect species richness.
Show the mark scheme
Tap an image to open it full size.
From the examiners' report: No examiners' report for this paper. Species richness is the number of species, and both plots have four; plot 2 has more insects, not more species.
Question 17
A level Paper 3 · June 2023 · Q05.1 · 1 mark · Medium
Use N and Σn(n − 1) to find which years had a given index of diversity.
Show the mark scheme

Tap an image to open it full size.
From the examiners' report: 40% got it. The values give d = 6. Give only the years where a plotted point is at 6, not every place the line crosses 6, and read the x-axis scale carefully.
Question 18
A level Paper 3 · June 2023 · Q05.2 · 2 marks · Hard
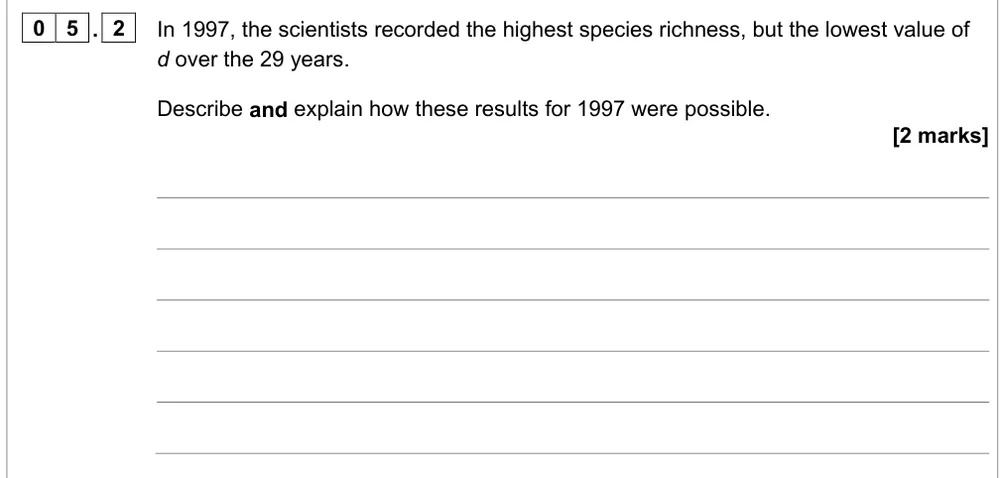
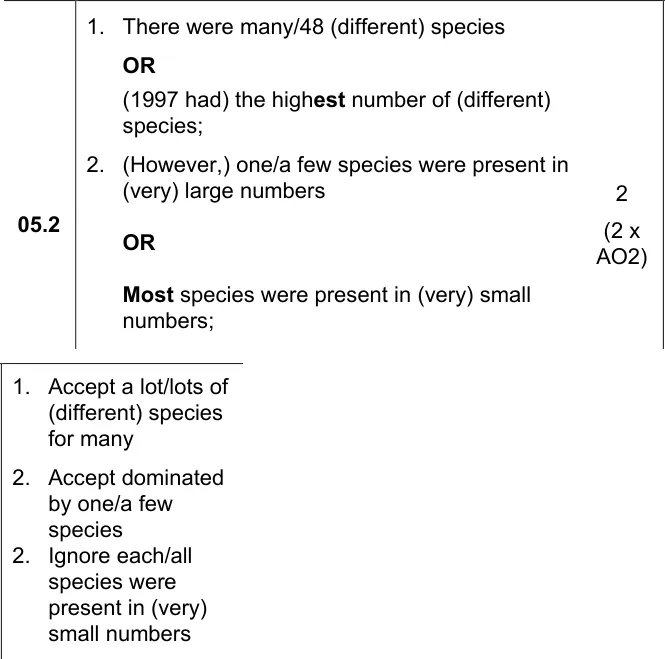
Explain how a year had the highest species richness but the lowest index of diversity.
Show the mark scheme
Tap an image to open it full size.
From the examiners' report: Only 7% got both. Nearly half got the first mark, but 'all species were in small numbers' is wrong: the index is low because one or a few species dominate.
Where students lose marks (from AQA examiners' reports and mark schemes)
Each point below is followed by wording that gained marks.
Count the individuals in each species: Fewer than 50% knew what else was needed to calculate an index of diversity for dung beetles. Many asked for the total number of beetles, which the graph already gave.
✔ Gains credit: "Number (of individuals) in each species" or "population of each species".
Species richness is for a community, not a population: 67.1% defined species richness, but many confused population with community and species richness with the index of diversity. 'The number of species in a population' and 'the variety of alleles in a community' were both wrong.
✔ Gains credit: "(A measure of) the number of (different) species in a community."
For richness, only count the species: On the method for plant species richness, the commonest error was counting the number or percentage cover of each species. Writing about counting both species and individuals lost the mark too.
✔ Gains credit: "Select sampling sites at random; use a quadrat; identify or count the number of different plant species."
A few common species pull the index down: Only 7% explained how 1997 had the highest species richness but the lowest index of diversity. Nearly half got the first mark, but many said each or all species were present in small numbers.
✔ Gains credit: "Many (48) different species; but one or a few species were present in very large numbers."
Variety of food sources, not 'more food': Under 10% got all three marks on rainforest animal diversity, and few started from the variety of plant species. 'More food' wasn't credited; on the hedge question 'less food', 'less homes' and 'less shelters' didn't score either.
✔ Gains credit: "Large variety of plant species; more habitats or niches; greater variety of food sources."
Finish the conservation and farming argument: On evaluating two farming methods, many noted the lower wheat yield without saying it means less food or less profit, and noted more stored carbon without linking it to less carbon dioxide in the atmosphere.
✔ Gains credit: "Better conservation as higher species richness, biomass and stored carbon; more stored carbon, less CO2 in the atmosphere; lower yield so less food or profit."
A statistical test compares the two means: 46% scored zero on the island P values. Many thought the test shows whether the data are accurate or reliable, mixed up ≤ and >, or missed that species richness rose on two islands and fell on Harris.
✔ Gains credit: "Significant increase in species richness on Islay and Colonsay and fall on Harris; change in diversity on Islay not significant; greater than 0.05 probability that the difference is due to chance."
Lots of fish in one sample says nothing about d: 62% scored zero and only 0.2% got all three marks when told 68% of the fish came from sample A. Answers like 'not a fair test', 'no repeats' or 'not representative' didn't score.
✔ Gains credit: "Number of individuals of each species not known; other samples have a higher species richness but fewer fish."
Download the questions
Download the PDF pack (18 questions, mark schemes at the end)
Keep practising
- Investigating diversity: AQA A Level Biology exam questions by topic
- Handling data (MS 1): AQA A Level Biology exam questions by topic
- Species and taxonomy: AQA A Level Biology exam questions by topic
- Genetic diversity and adaptation: AQA A Level Biology exam questions by topic
- AQA A Level Biology masterclasses
Questions, mark schemes and examiners' report extracts © AQA.