

Handling data is the biggest block of maths in AQA A Level Biology, and it turns up on every paper, often inside an evaluation question about a drug trial or an ecology survey. The MS 1 skills in the specification cover significant figures, means, frequency diagrams, probability, sampling, mean, median and mode, scatter diagrams, order of magnitude, the three statistical tests (chi-squared, Student's t-test and correlation coefficient), standard deviation and range, and uncertainty.
The examiners' reports show that students rarely lose these marks on the arithmetic. They lose them by writing that 'the results are significant' instead of the difference, reading a high P value as a high risk, ignoring whether standard deviations overlap, forgetting the chance of having a son, choosing the mean when there are outliers, and giving ±0.5 mm for a ruler measurement. Every question below is from a real AQA paper, with the mark scheme and the examiners' comments turned into advice.
Answer each question on paper with a calculator before you open the mark scheme, and use the words probability, chance and difference in your conclusions. If you'd like help with maths skills, my AQA masterclasses run online on Tuesdays at 5.15pm for Year 12 and on Wednesdays or Thursdays at 6.30pm for Year 13.
What you need from GCSE
Each question on this page assumes you're secure on these GCSE ideas. If any of them feels shaky, look it up before you start.
- GCSE: the mean, median, mode and range of a set of data, and that an outlier affects the mean more than the median.
- GCSE: rounding to a given number of significant figures or decimal places.
- GCSE: probabilities as fractions, decimals or percentages, multiplying independent probabilities, and using a Punnett square to predict offspring.
- GCSE: positive, negative and no correlation on a scatter graph, and that a correlation doesn't prove one variable causes the other.
- GCSE: random sampling with quadrats, and why repeats and a large sample make a mean more reliable.
Key terms
These words come up in the questions and mark schemes. Examiners expect you to use them exactly.
- Significant figures: the digits that carry meaning in a number, counted from the first non-zero digit. A calculated answer can only be as precise as the least precise measurement.
- Mean, median and mode: the mean is the total divided by the number of values; the median is the middle value when the data are in rank order; the mode is the most frequent value.
- Range: the difference between the largest and smallest values: a simple measure of spread that an outlier can distort.
- Standard deviation: a measure of how spread out the data are around the mean. About 95% of values lie within ± 2 SD; if the ± 2 SD of two means don't overlap, the difference is significant.
- Probability: how likely an outcome is, from 0 (impossible) to 1 (certain); for independent events, multiply the probabilities.
- Random sample: a sample where every individual or position has an equal chance of being chosen, for example using a random number generator, so there is no bias.
- Correlation: a relationship between two variables, shown on a scatter diagram and measured by a correlation coefficient from −1 to +1. It doesn't show cause.
- Null hypothesis: the statement a statistical test assumes: there is no difference between means, no difference between observed and expected, or no correlation.
- P value and significance level: the probability that a difference or correlation is due to chance. If P is less than 0.05 (5%), it is significant and you reject the null hypothesis.
- Chi-squared, t-test, correlation coefficient: the three AQA tests: chi-squared compares observed and expected frequencies, Student's t-test compares two means, and a correlation coefficient tests a relationship.
- Uncertainty and percentage error: uncertainty is the range a measurement could be out by (± half the smallest division for one reading); percentage error = uncertainty ÷ measured value × 100.
What these questions cover (AQA maths skills MS 1: handling data)
The questions test these mathematical skills from the AQA AS and A-level Biology specification (7401/7402):
- MS 1.1 Use an appropriate number of significant figures
- MS 1.2 Find arithmetic means
- MS 1.3 Construct and interpret frequency tables and diagrams, bar charts and histograms
- MS 1.4 Understand simple probability
- MS 1.5 Understand the principles of sampling as applied to scientific data (the only MS 1.5 part available)
- MS 1.6 Understand the terms mean, median and mode
- MS 1.7 Use a scatter diagram to identify a correlation between two variables (the r = −0.98 question in MS 1.9 also tests correlation)
- MS 1.8 Make order of magnitude calculations
- MS 1.9 Select and use a statistical test
- MS 1.10 Understand measures of dispersion, including standard deviation and range (standard deviation is read from tables and graphs; no available part asks you to calculate one)
- MS 1.11 Identify uncertainties in measurements and use simple techniques to determine uncertainty when data are combined
How to use this page
Write your answer on paper before you open the mark scheme. Allow about 1.3 minutes per mark: the 18 questions are worth 36 marks, so about 47 minutes in total. Then mark your answer strictly against the mark scheme and read the examiners' tip underneath it. If you'd rather print the questions, download the PDF pack.
Significant figures and means (MS 1.1, MS 1.2)
Question 1
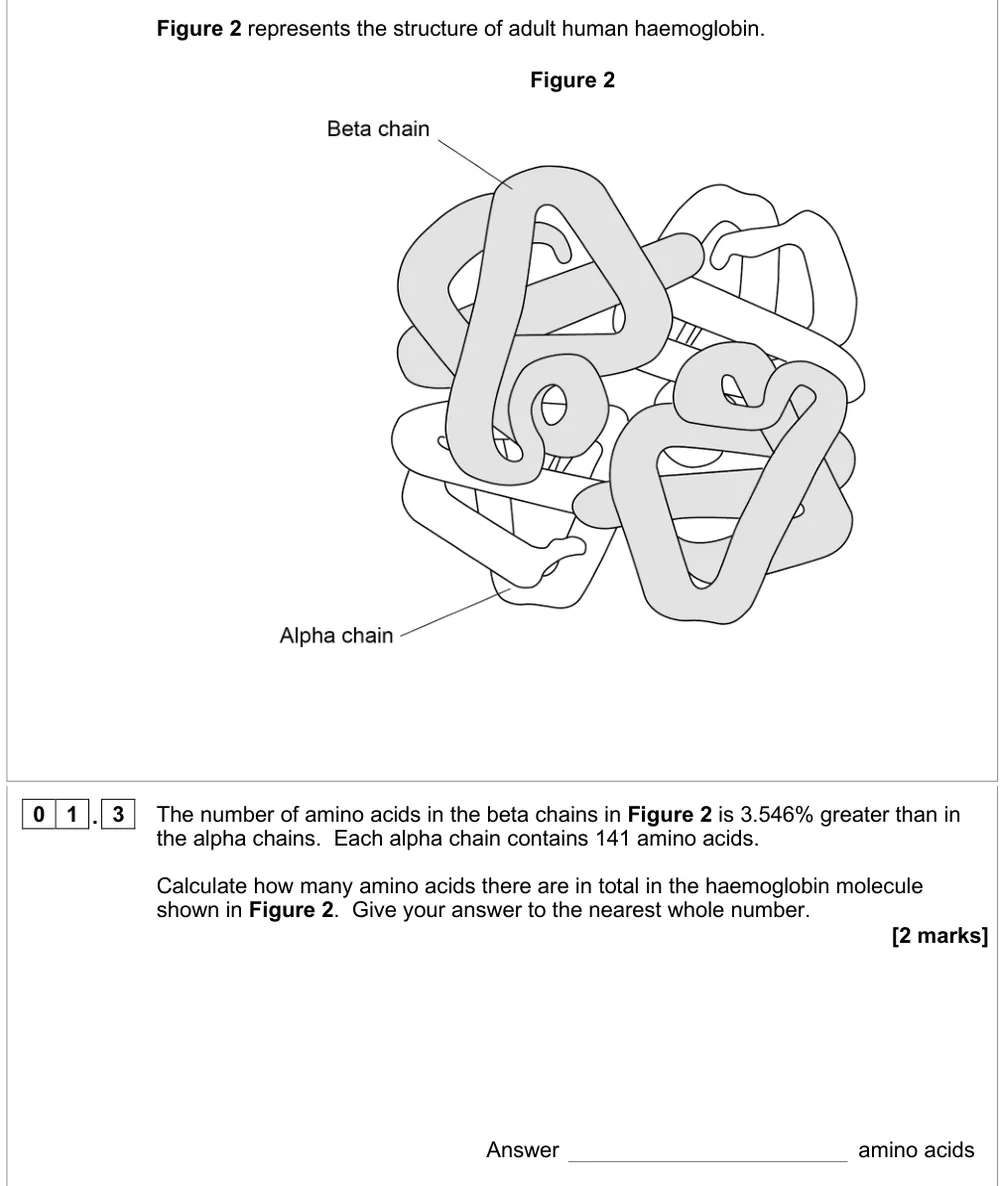
A level Paper 3 · June 2022 · Q01.3 · 2 marks · Medium
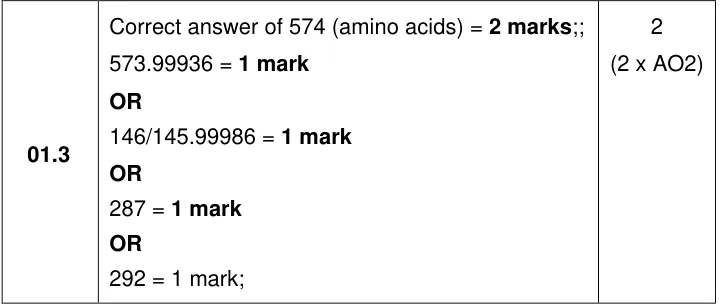
Calculate the total number of amino acids in haemoglobin, to the nearest whole number.
Show the mark scheme
Tap an image to open it full size.
From the examiners' report: Just under half got both marks. Most who got 1 forgot there are two alpha and two beta chains. Round only at the end, to the whole number asked for.
Question 2
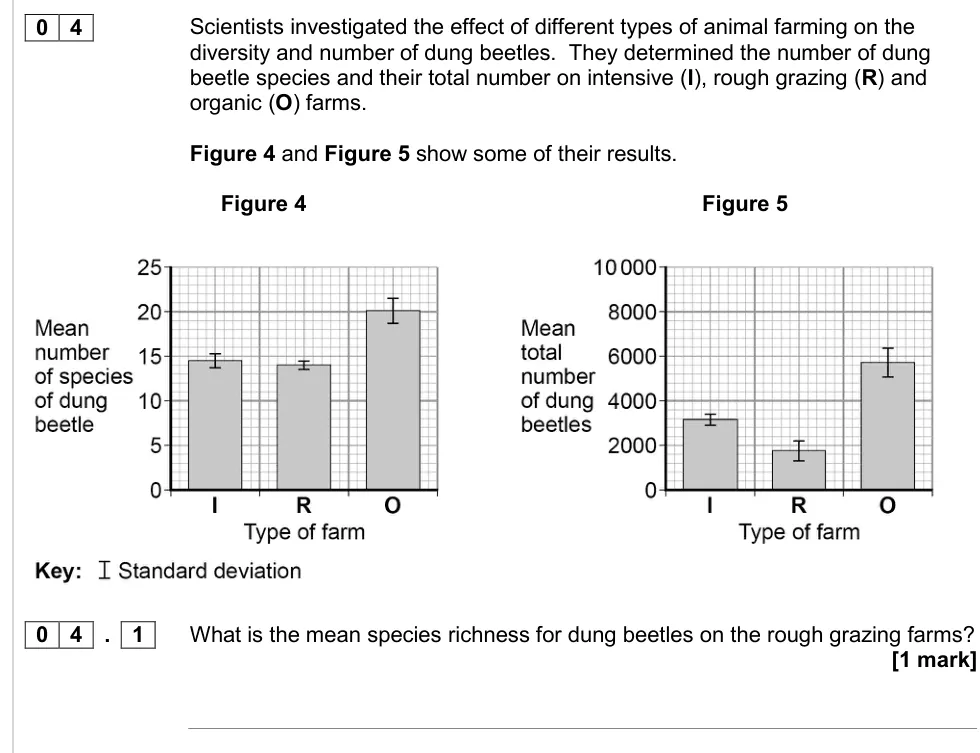
AS Paper 2 · June 2016 · Q04.1 · 1 mark · Easy
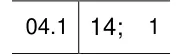
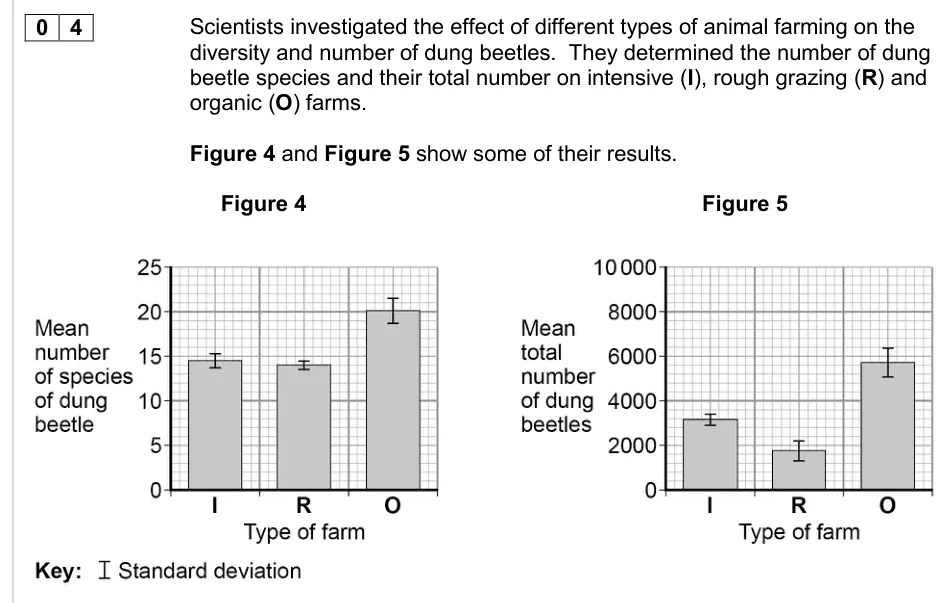
Read the mean species richness of dung beetles on rough grazing farms from a bar chart.
Show the mark scheme
Tap an image to open it full size.
From the examiners' report: 70% got this. Make sure you read the right figure: Figure 4 shows species richness, Figure 5 shows total numbers.
Tables, frequency diagrams and averages (MS 1.3, MS 1.6)
Question 3
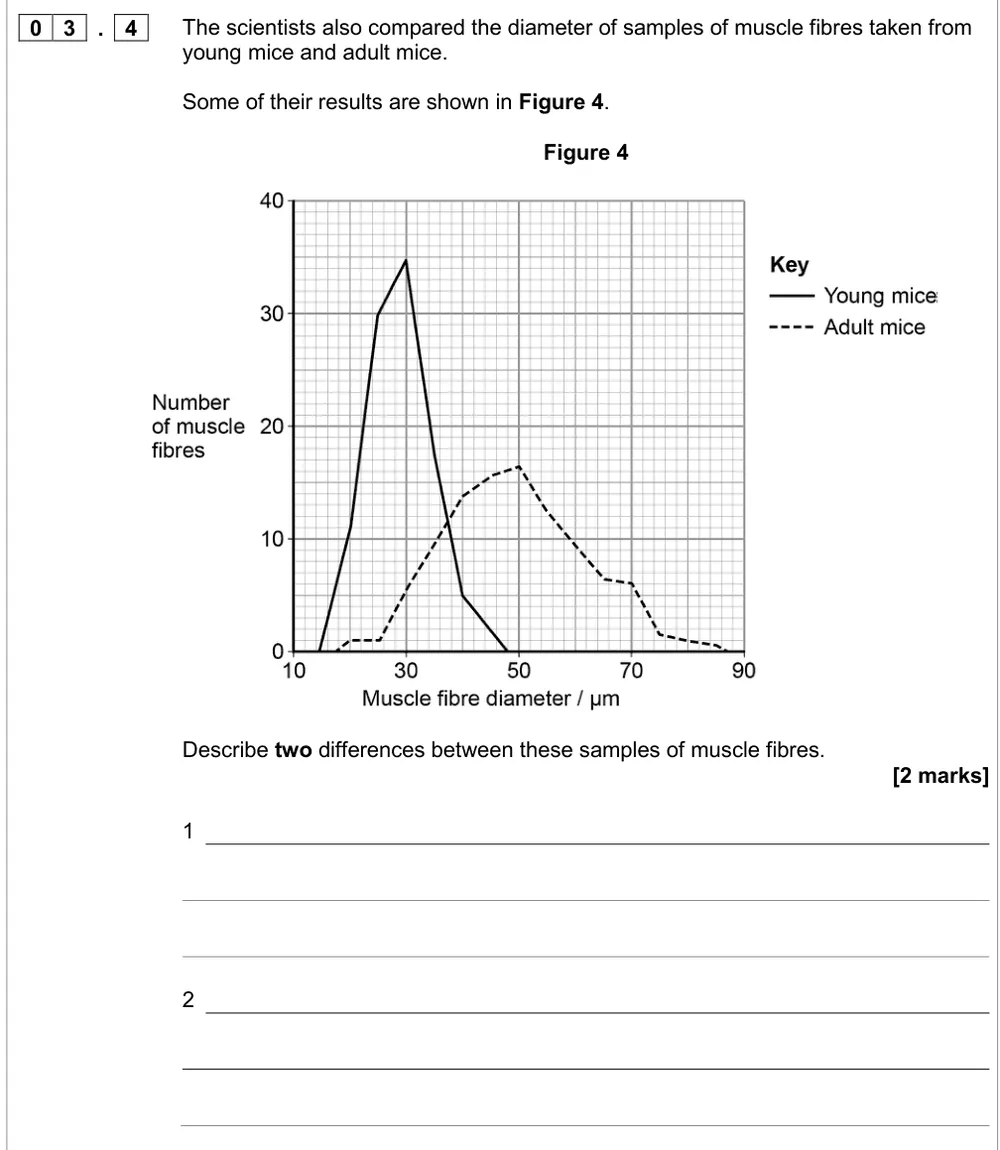
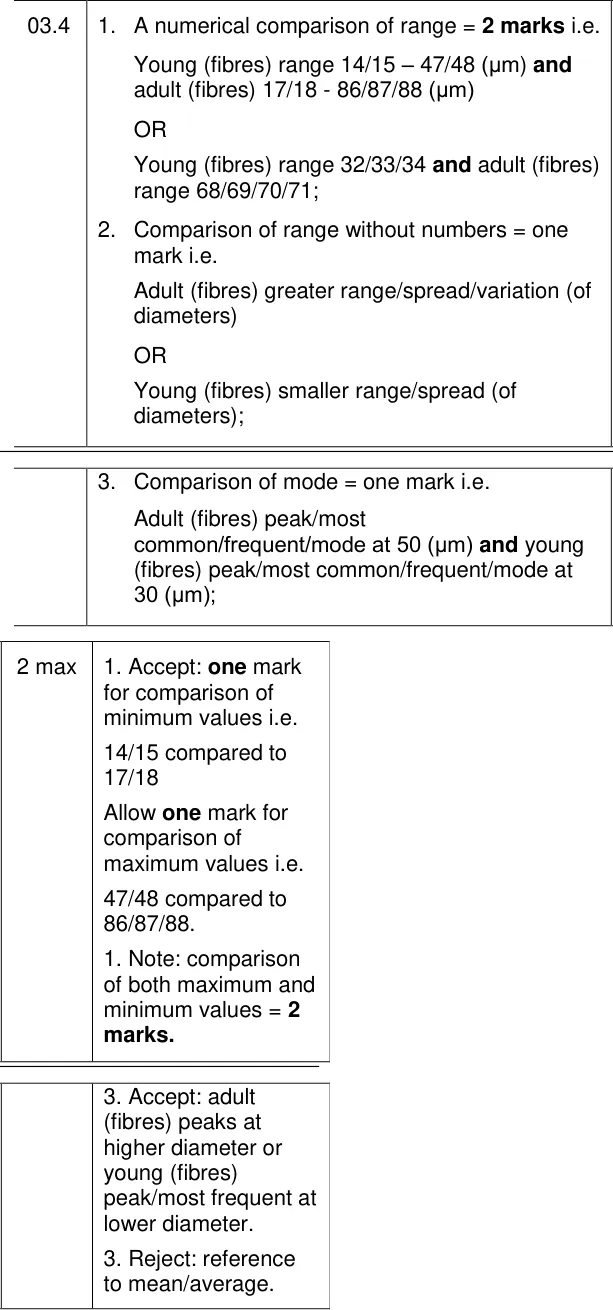
A level Paper 2 · June 2017 · Q03.4 · 2 marks · Easy
Describe two differences between frequency diagrams of muscle fibre diameter in young and adult mice.
Show the mark scheme
Tap an image to open it full size.
From the examiners' report: Most got 1 mark for the wider range in adults. Quote values read accurately from the graph for the second mark, and call the peak the mode, not the mean.
Question 4
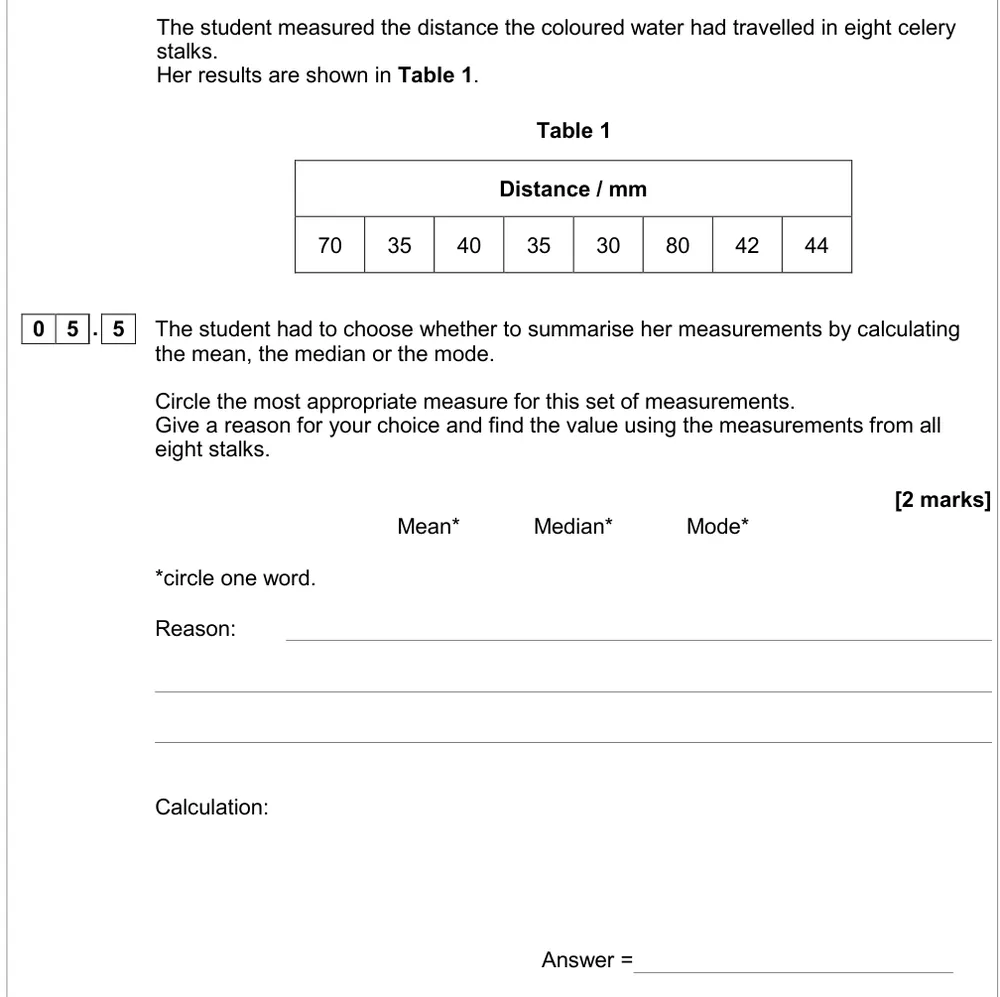
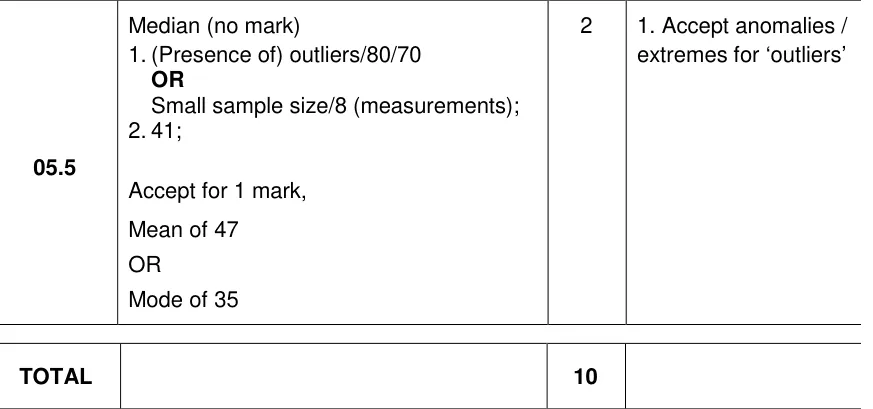
AS Paper 2 · June 2019 · Q05.5 · 2 marks · Easy
Choose mean, median or mode for a set of celery measurements, give a reason and find the value.
Show the mark scheme
Tap an image to open it full size.
From the examiners' report: Only 15% chose the median. The 70 and 80 are outliers that drag the mean up, so the median (41) is the better summary.
Question 5
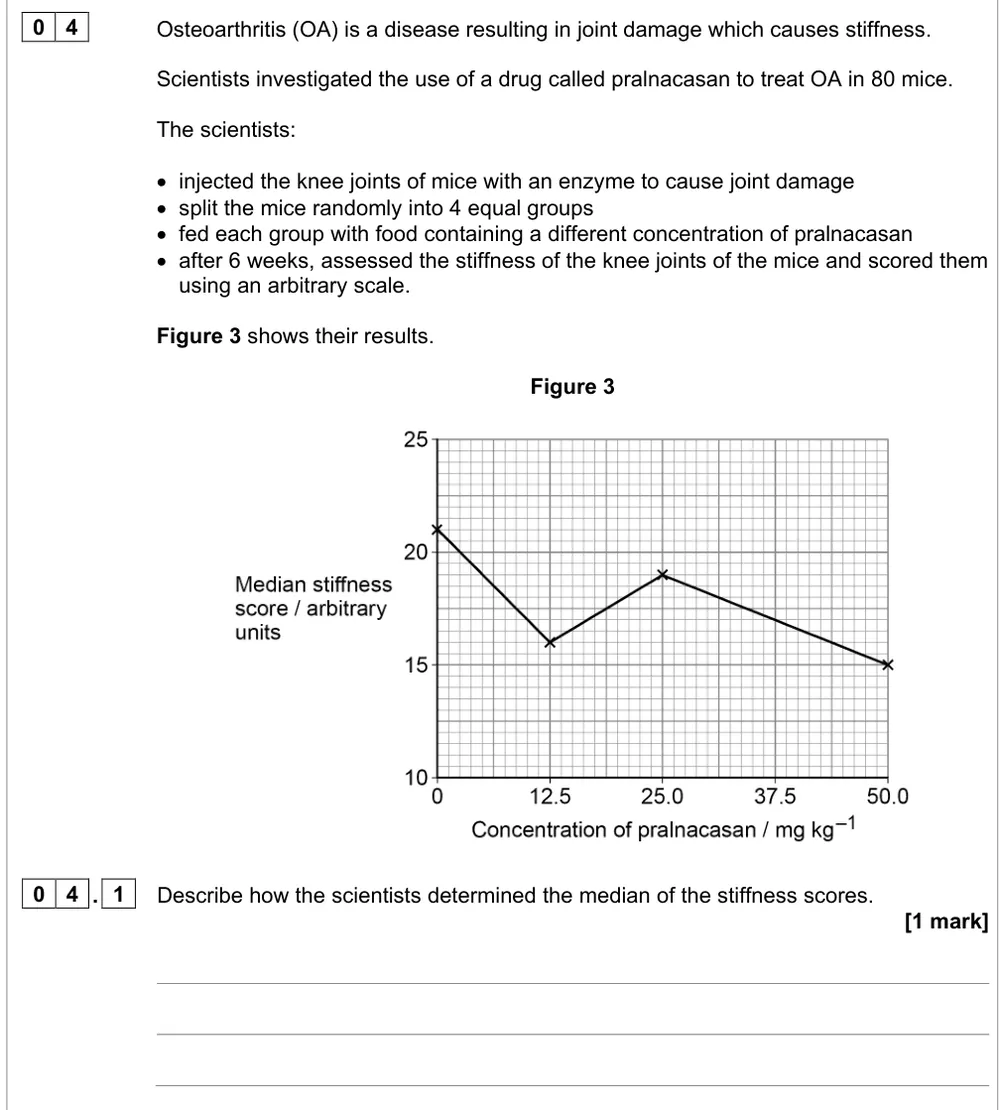
A level Paper 3 · June 2024 · Q04.1 · 1 mark · Easy
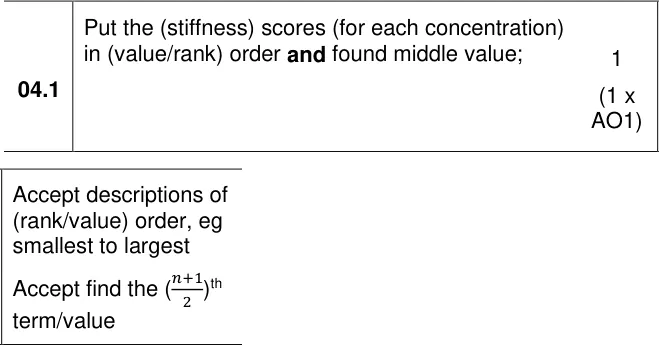
Describe how scientists found the median stiffness score for each group of mice.
Show the mark scheme
Tap an image to open it full size.
From the examiners' report: Just under two-thirds scored. 'Find the middle value' alone isn't enough: put the scores for each concentration in order of size first. Rank order, not 'chronological'.
Probability and sampling (MS 1.4, MS 1.5)
Question 6
A level Paper 2 · June 2022 · Q06.3 · 2 marks · Medium
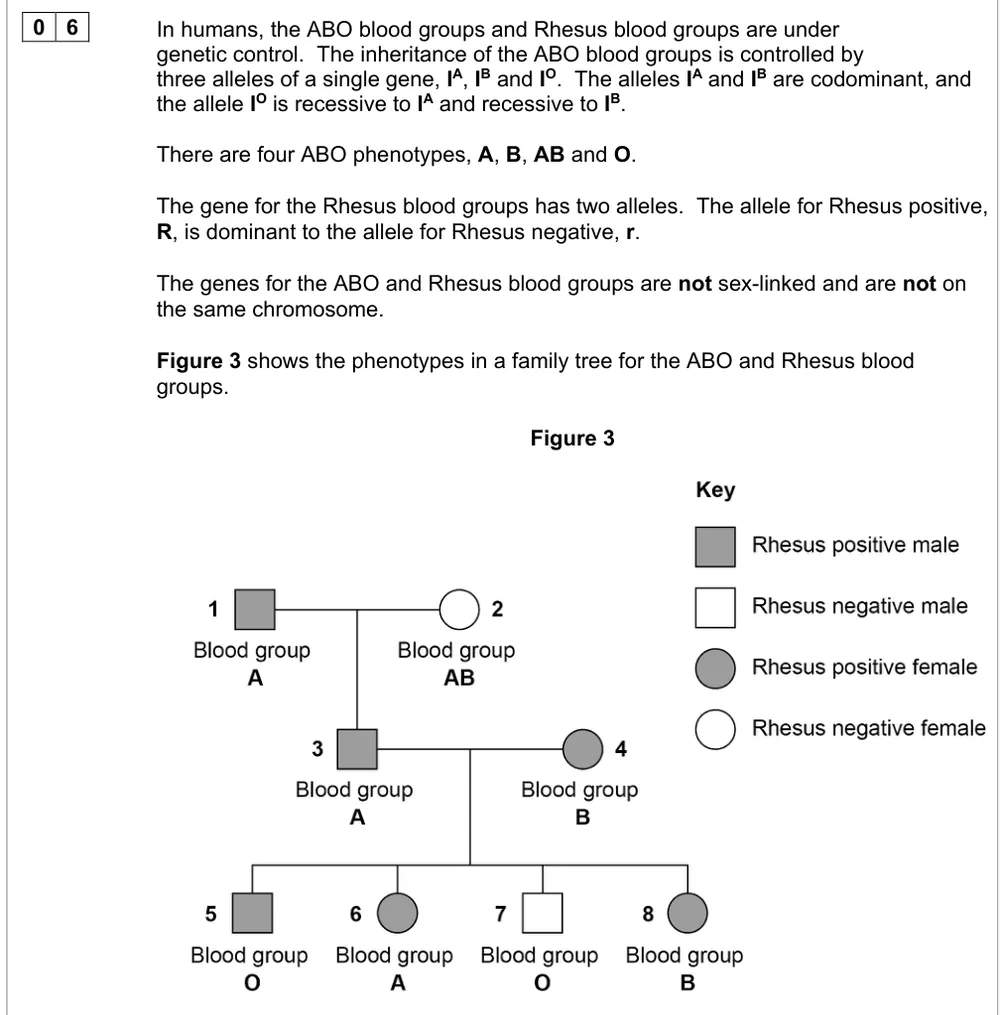
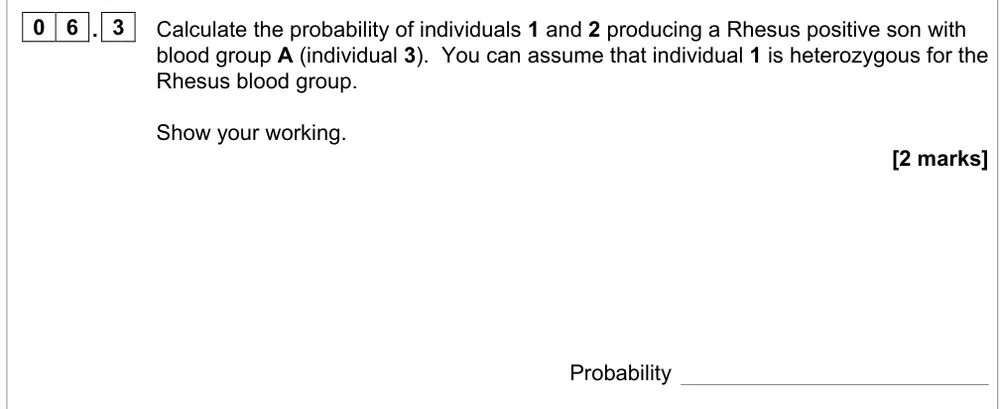
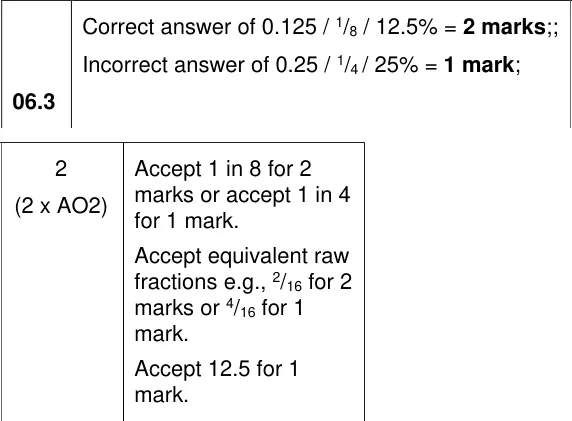
Calculate the probability of two parents having a Rhesus positive son with blood group A.
Information from earlier in this question:
Show the mark scheme
Tap an image to open it full size.
From the examiners' report: Only 23% got both marks; 38% gave 25% because they left out the ½ chance of a son. Multiply the separate probabilities: blood group A, Rhesus positive and male.
Question 7
AS Paper 2 · June 2016 · Q04.4 · 1 mark
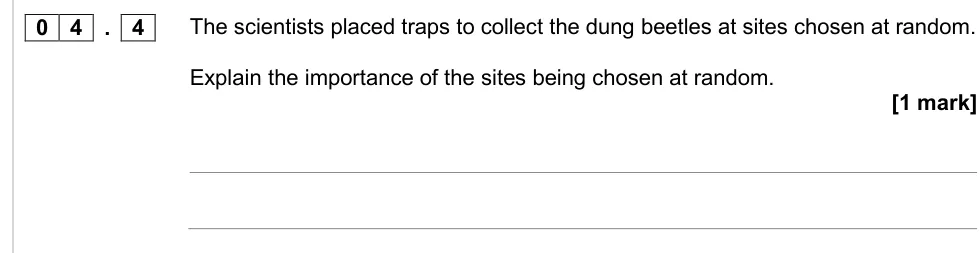
Explain why the dung beetle traps were placed at random sites.
Information from earlier in this question:
Show the mark scheme

Tap an image to open it full size.
From the examiners' report: Three out of four got this. Random sampling avoids bias; 'controlling variables' and 'a fair test' don't score.
Scatter diagrams and order of magnitude (MS 1.7, MS 1.8)
Question 8
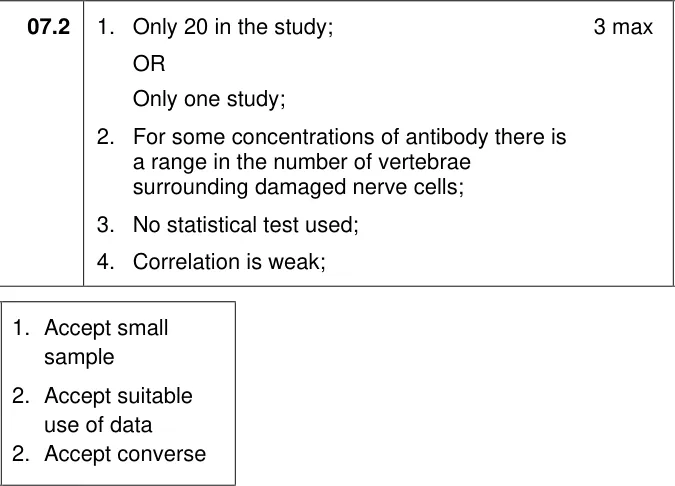
AS Paper 2 · June 2017 · Q07.2 · 3 marks
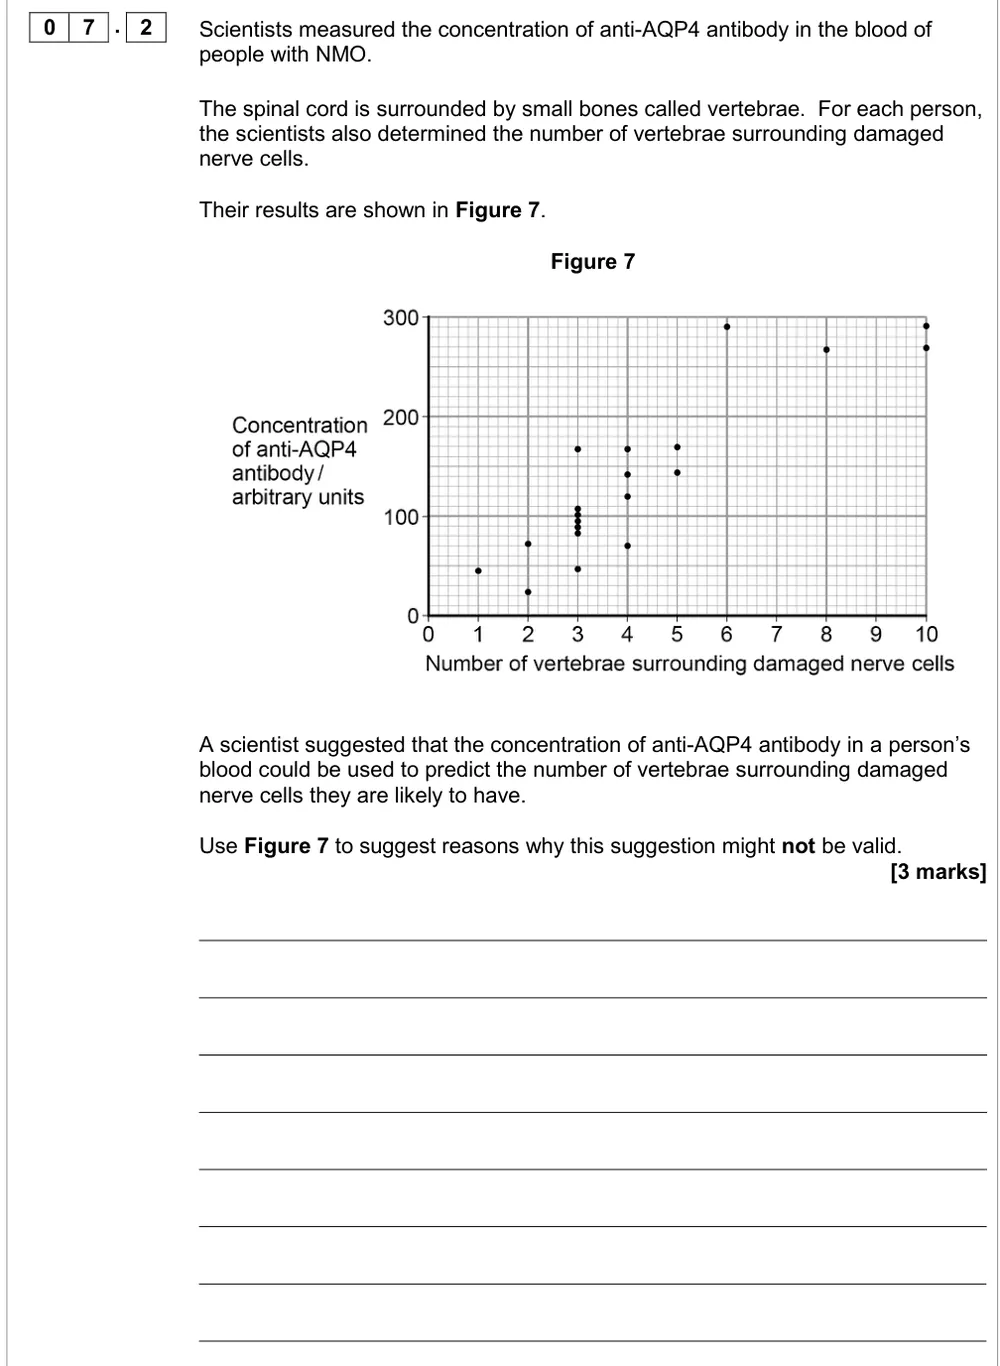
Use a scatter diagram to suggest why antibody concentration may not predict nerve damage.
Show the mark scheme
Tap an image to open it full size.
From the examiners' report: No examiners' report for this paper. The mark scheme wants points from the graph: a weak correlation, a spread of values at the same concentration, only 20 people and no statistical test.
Question 9
A level Paper 3 · June 2017 · Q02.2 · 2 marks · Hard
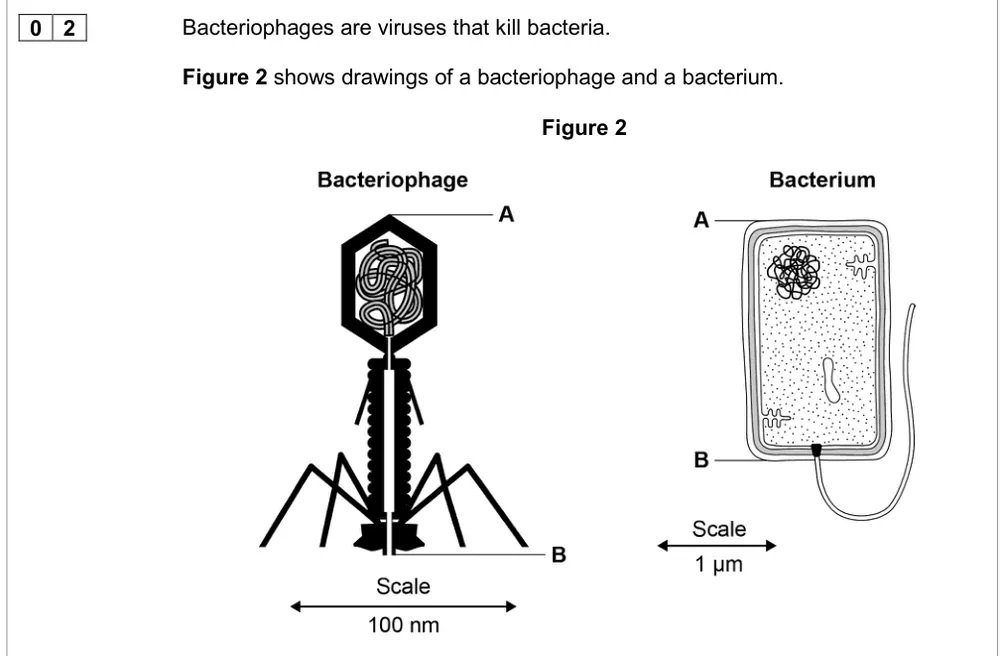
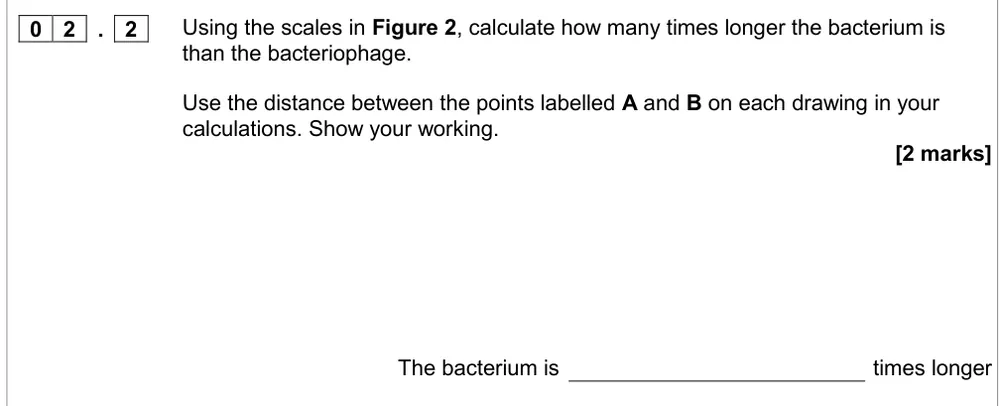
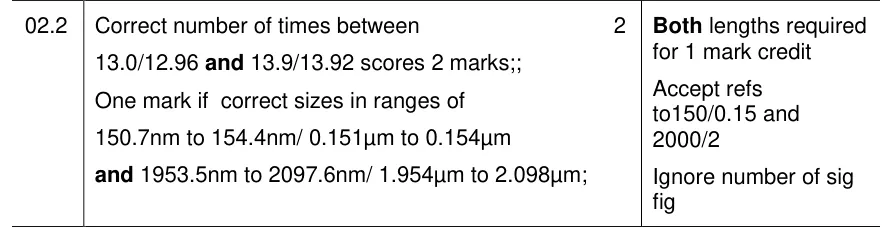
Use scale bars to calculate how many times longer a bacterium is than a bacteriophage.
Information from earlier in this question:
Show the mark scheme
Tap an image to open it full size.
From the examiners' report: About 30% got both marks. The main problem was converting between mm, µm and nm: put both lengths in the same unit before you divide.
Statistical tests (MS 1.9)
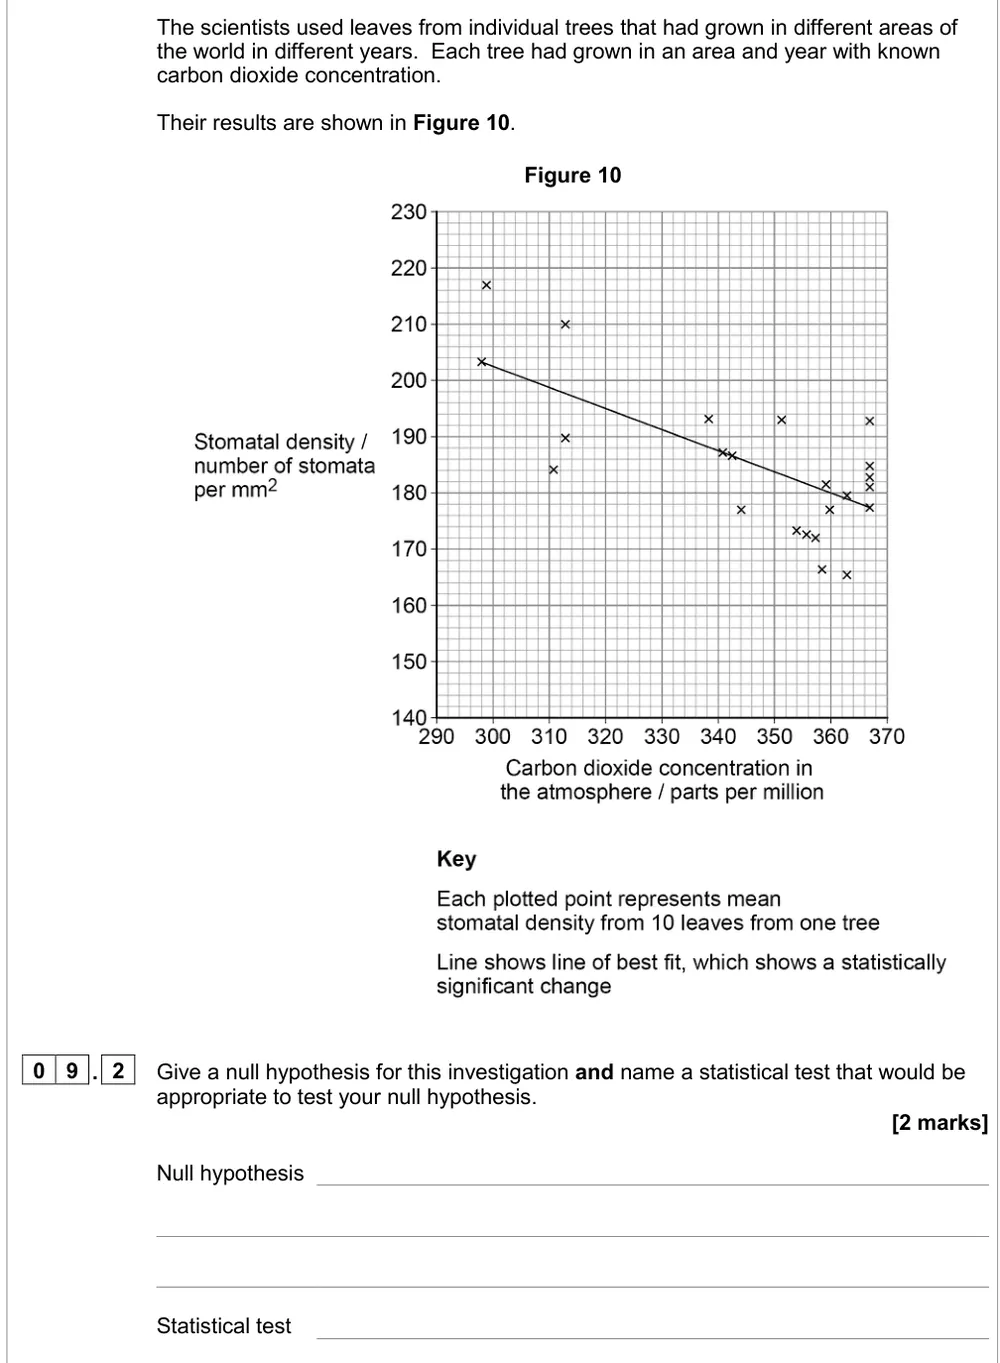
Question 10
A level Paper 1 · November 2020 · Q09.2 · 2 marks · Medium
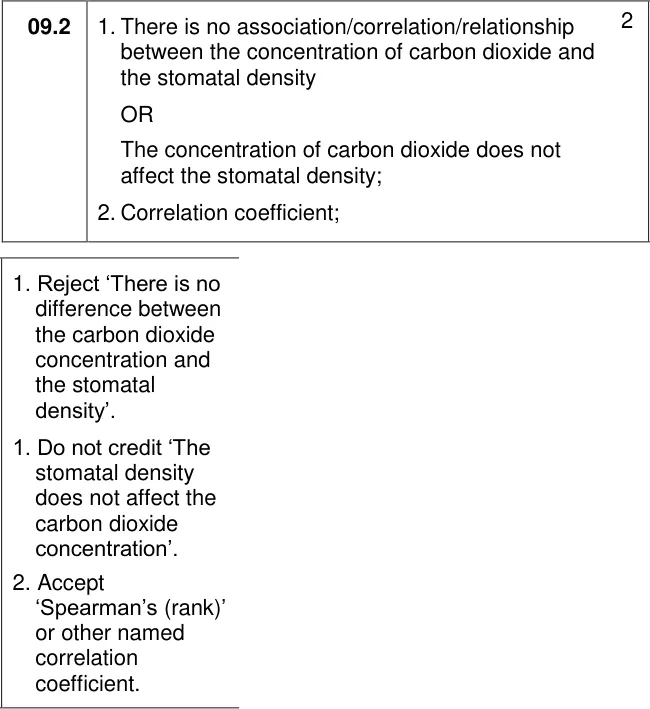
Give a null hypothesis and name a suitable statistical test for stomatal density and carbon dioxide data.
Show the mark scheme
Tap an image to open it full size.
From the examiners' report: Only 22% got both marks. Many gave a hypothesis, or the learned 'no difference' form, which doesn't fit two variables. For a relationship, the null hypothesis is 'no correlation' and the test is a correlation coefficient.
Question 11
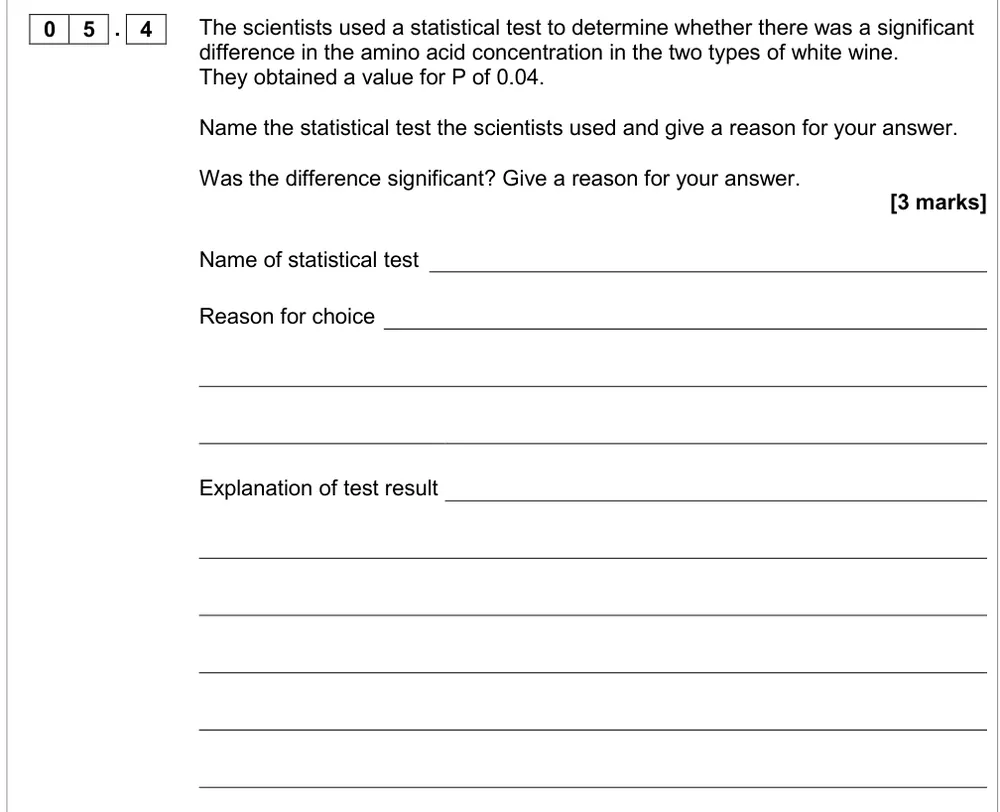
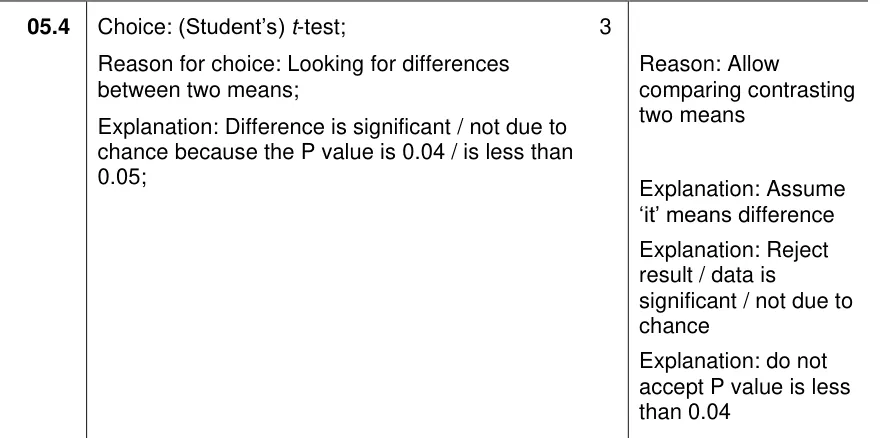
AS Paper 1 · June 2017 · Q05.4 · 3 marks · Hard
Name the test used to compare two means of amino acid concentration and interpret P = 0.04.
Show the mark scheme
Tap an image to open it full size.
From the examiners' report: 50% scored zero and only 4.6% got all three. Some thought P = 0.04 meant the means differed by 0.04. The sign test isn't in the AQA specification.
Question 12
A level Paper 1 · June 2018 · Q06.3 · 2 marks · Easy
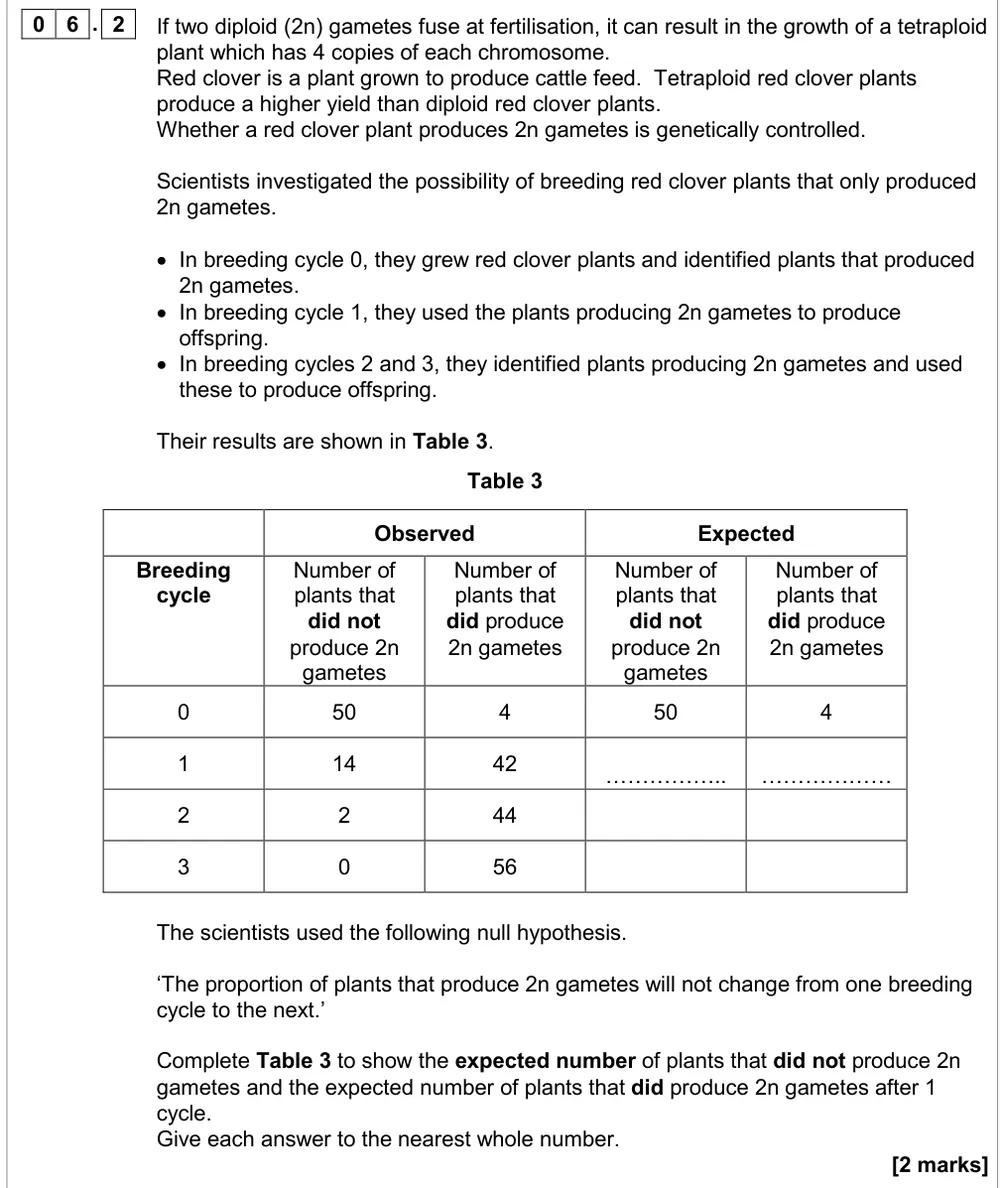
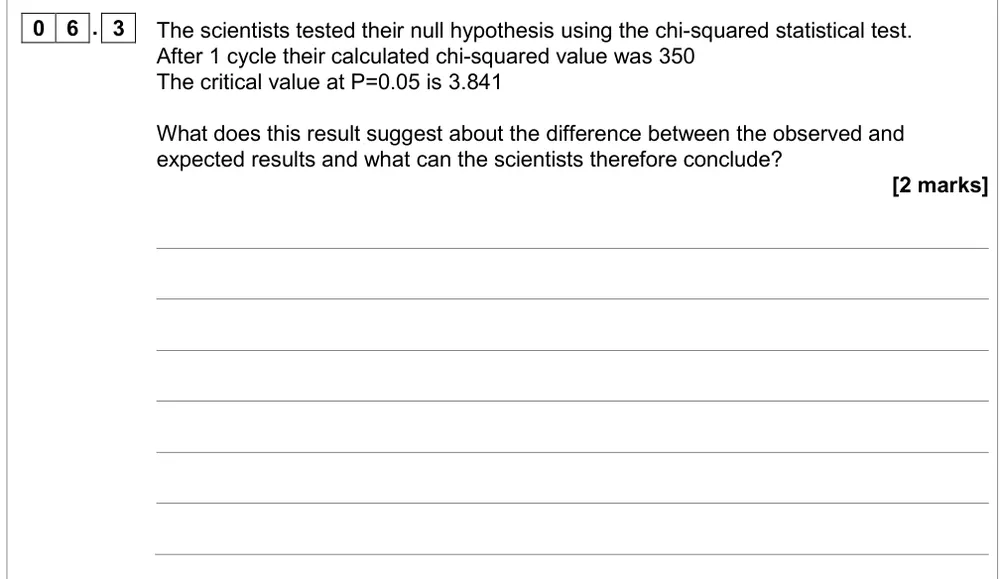
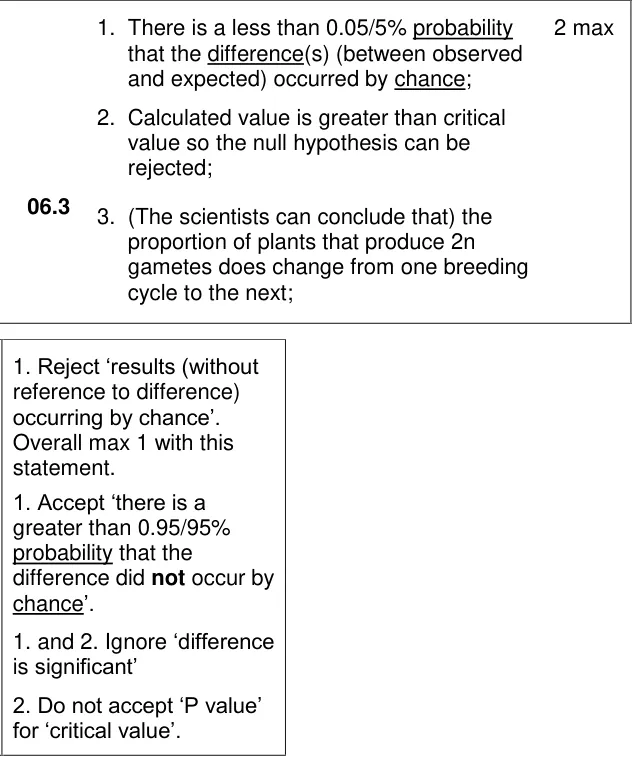
Interpret a chi-squared value of 350 against a critical value of 3.841.
Information from earlier in this question:
Show the mark scheme
Tap an image to open it full size.
From the examiners' report: P values are still not answered well. Say it is the difference between observed and expected that is (or isn't) due to chance, not the results, then compare with the critical value and reject the null hypothesis.
Question 13
A level Paper 1 · June 2025 · Q08.2 · 2 marks · Easy
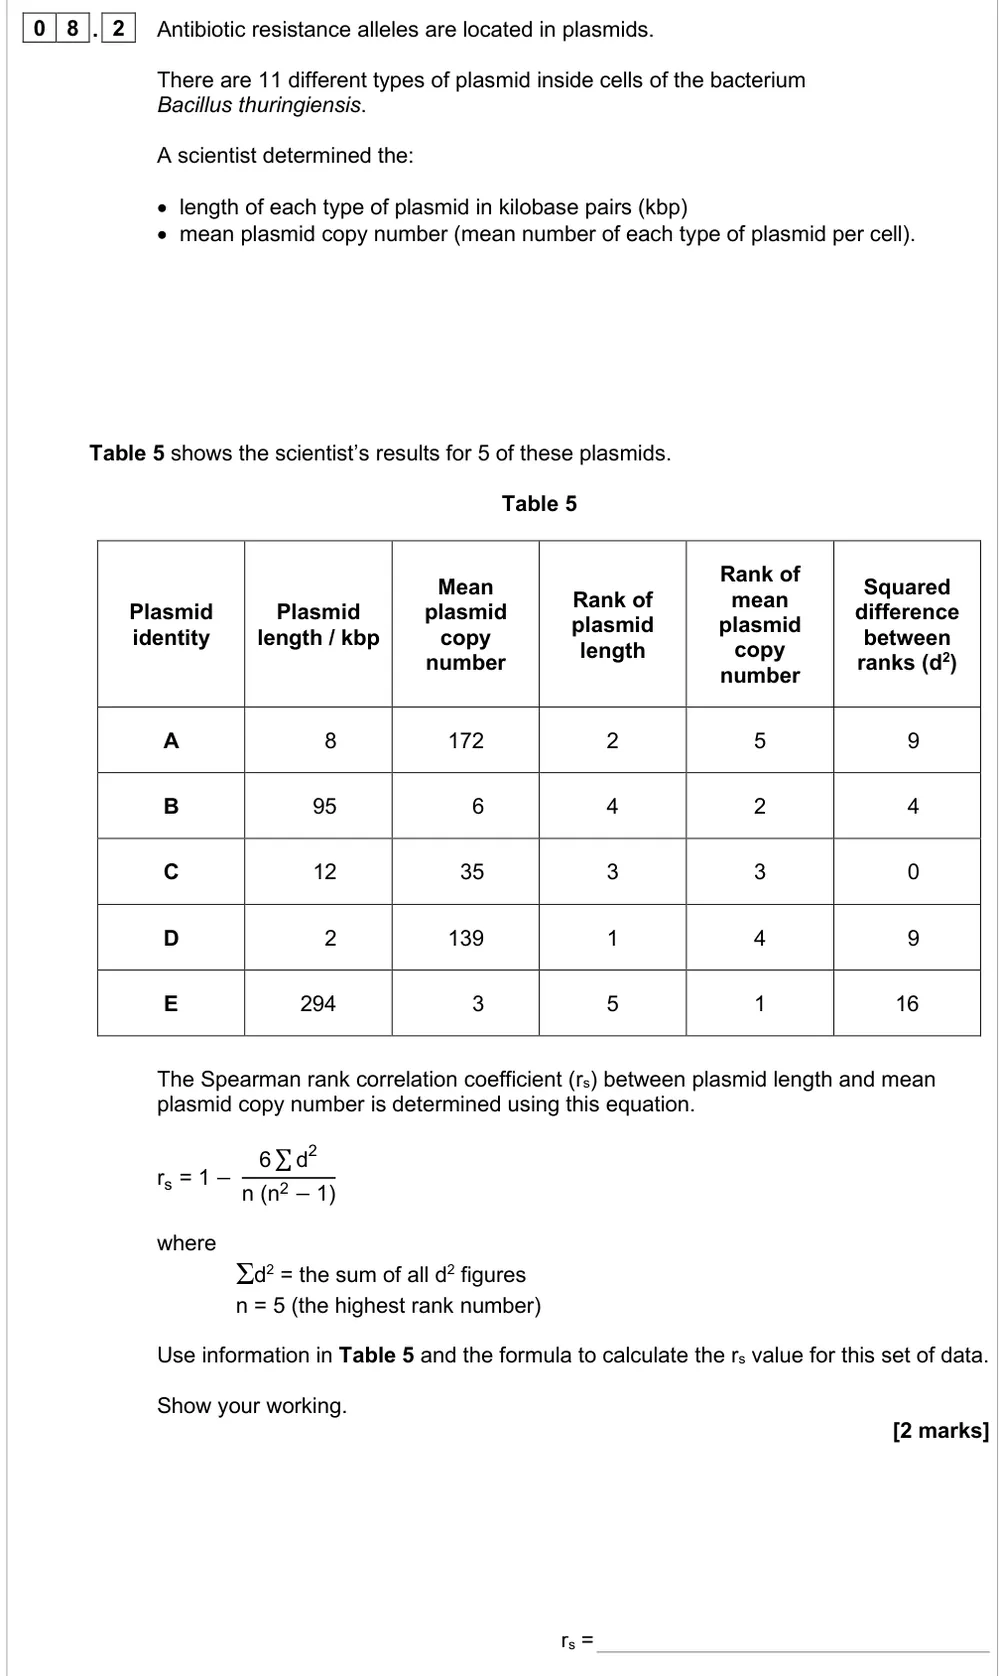
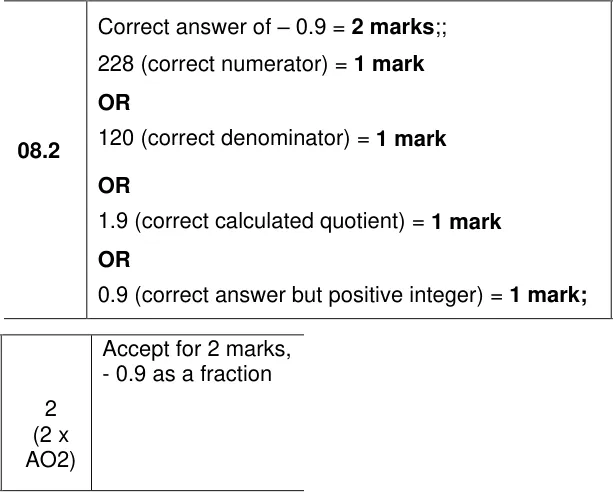
Use the Spearman rank formula to calculate a correlation coefficient for plasmid data.
Show the mark scheme
Tap an image to open it full size.
From the examiners' report: About 70% got both marks. The d² values are already squared, so add them (38). Keep the 1 − outside the fraction, and show your working so you can get a method mark.
Question 14
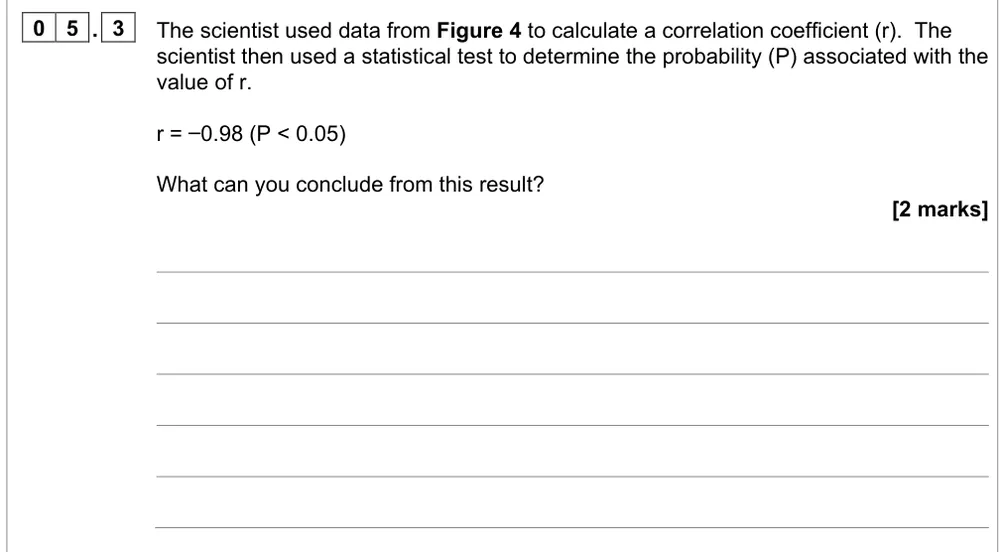
A level Paper 1 · June 2024 · Q05.3 · 2 marks
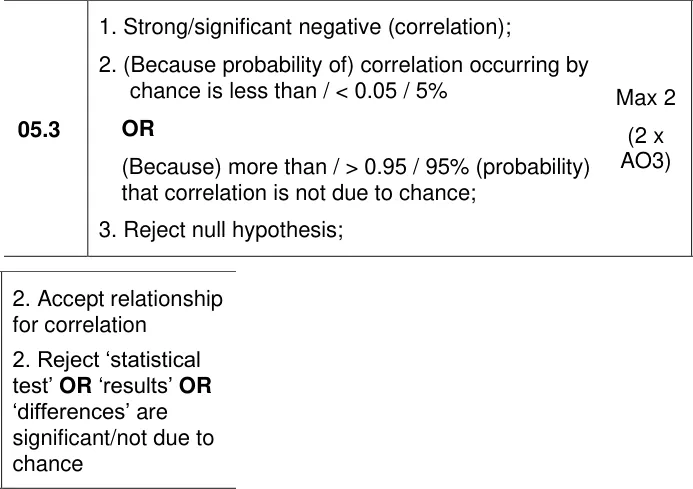
Draw a conclusion from a correlation coefficient of −0.98 with P < 0.05.
Show the mark scheme
Tap an image to open it full size.
From the examiners' report: Many saw a negative correlation but didn't say strong or significant. Link P to the correlation and to chance. Don't compare r with P.
Standard deviation (MS 1.10)
Question 15
A level Paper 2 · November 2020 · Q09.3 · 2 marks · Medium
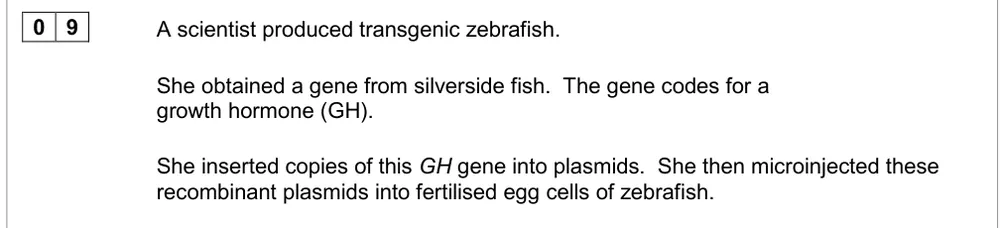
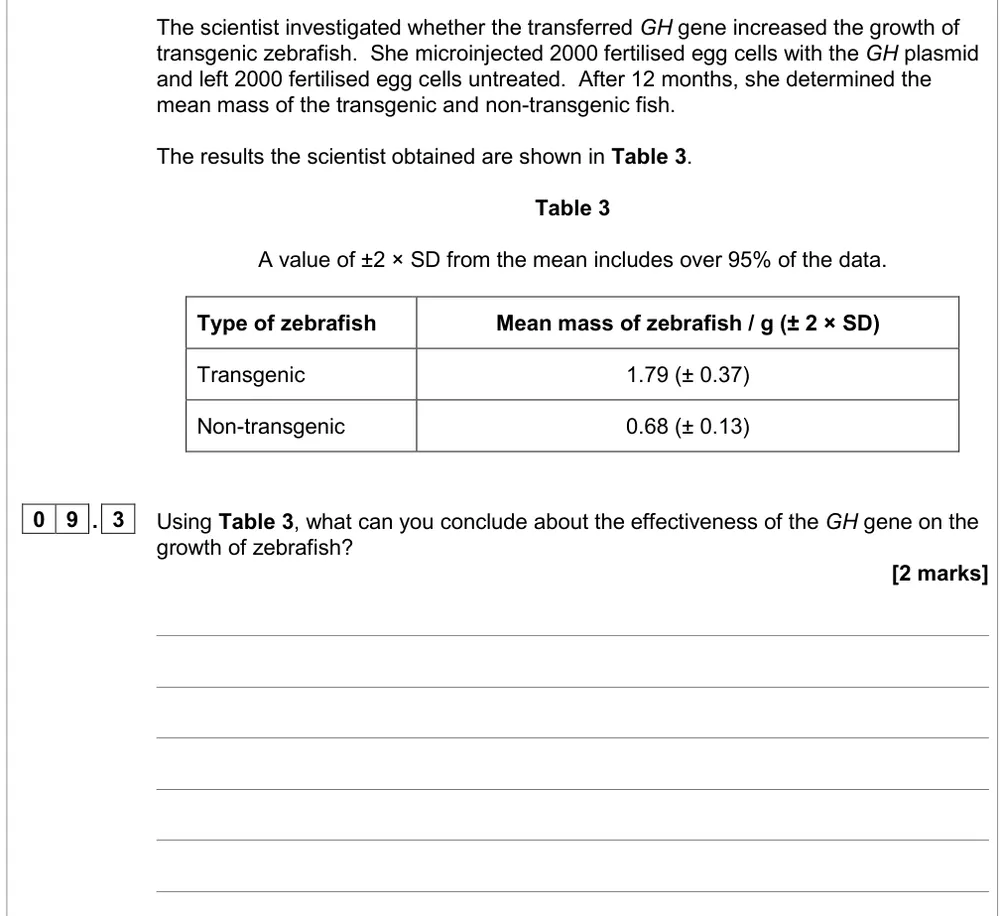
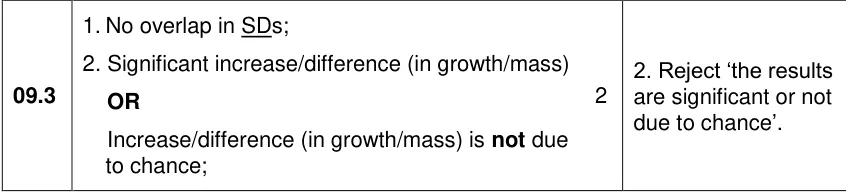
Use means ± 2 SD to conclude whether a growth hormone gene increased zebrafish growth.
Information from earlier in this question:
Show the mark scheme
Tap an image to open it full size.
From the examiners' report: 40% got both marks; 27% said the SDs don't overlap but didn't say what it means. Work out the ranges (1.42–2.16 and 0.55–0.81), then say the increase is significant.
Question 16
AS Paper 2 · June 2019 · Q01.2 · 3 marks · Medium
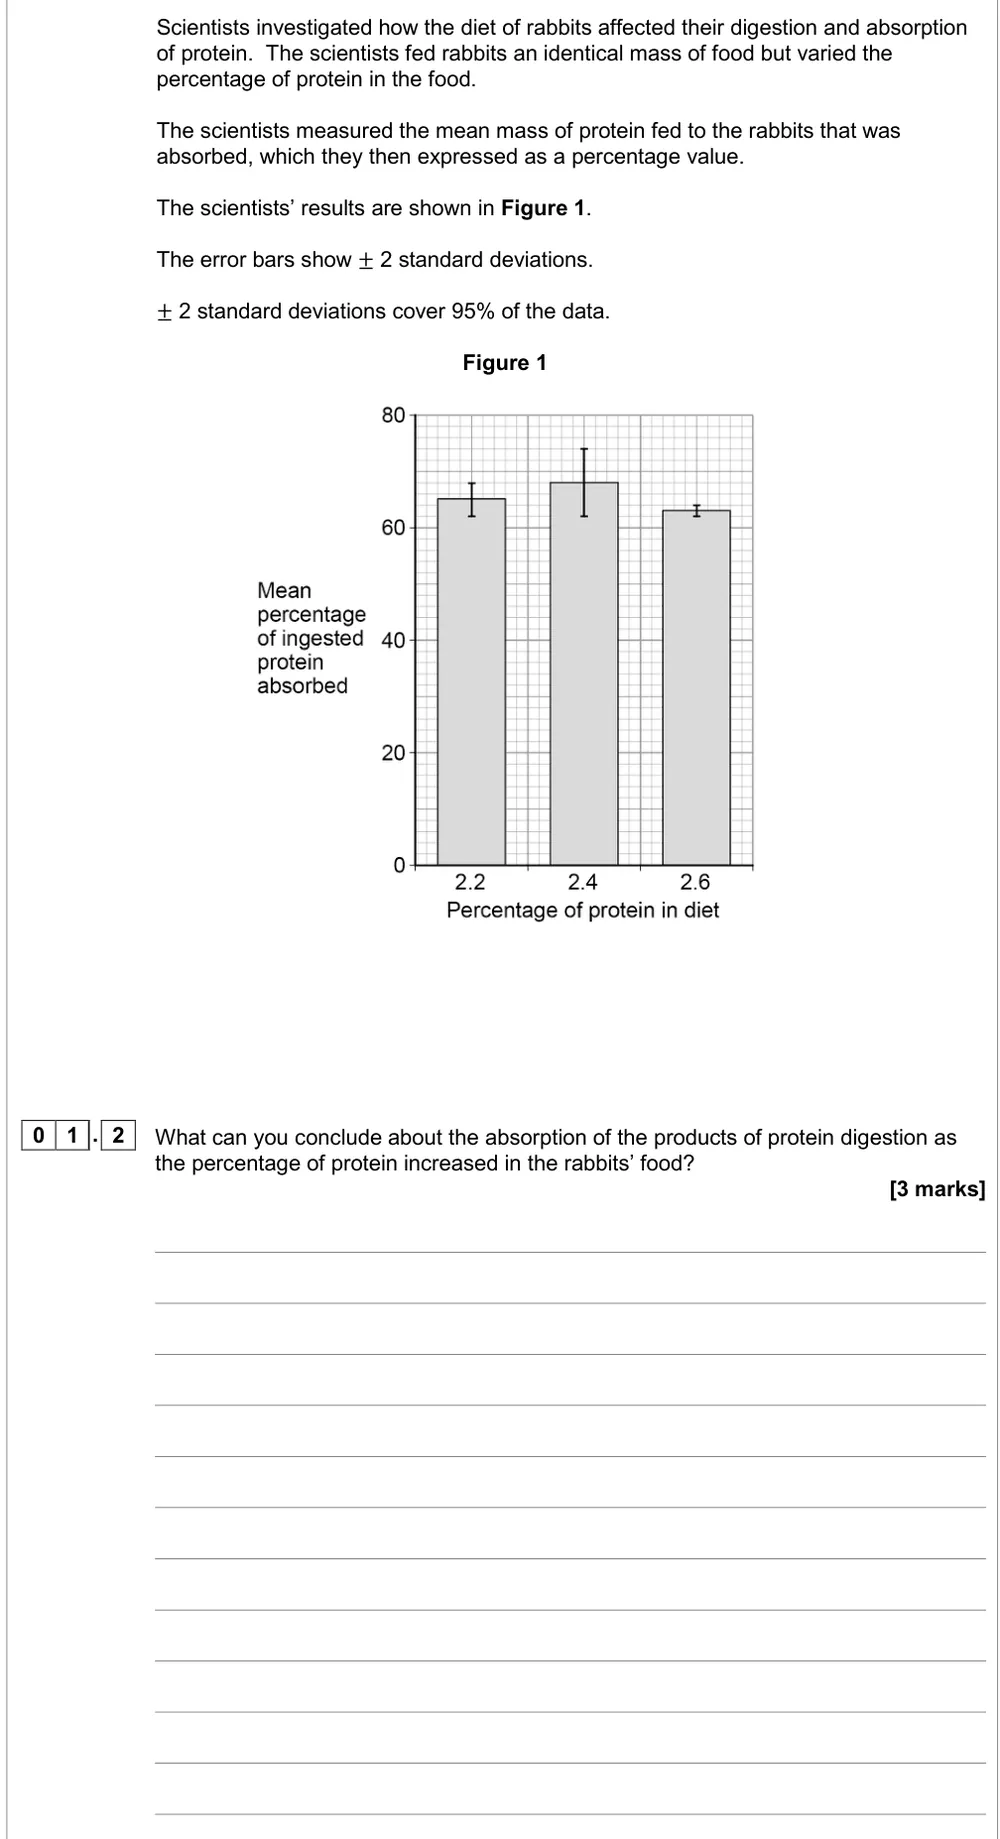
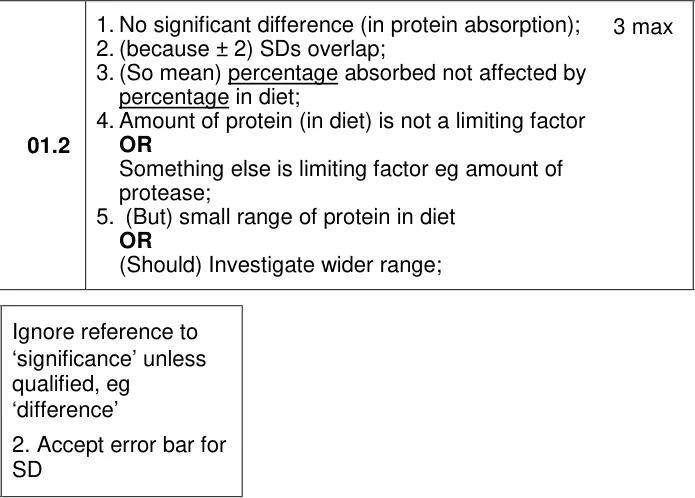
Use error bars of ± 2 SD to draw a conclusion about protein absorption in rabbits.
Show the mark scheme
Tap an image to open it full size.
From the examiners' report: About 10% got all 3. Don't describe the trend in the bar heights and ignore the error bars: overlapping ± 2 SDs mean no significant difference in the mean percentage absorbed.
Uncertainty (MS 1.11)
Question 17
AS Paper 2 · November 2020 · Q08.1 · 2 marks · Easy
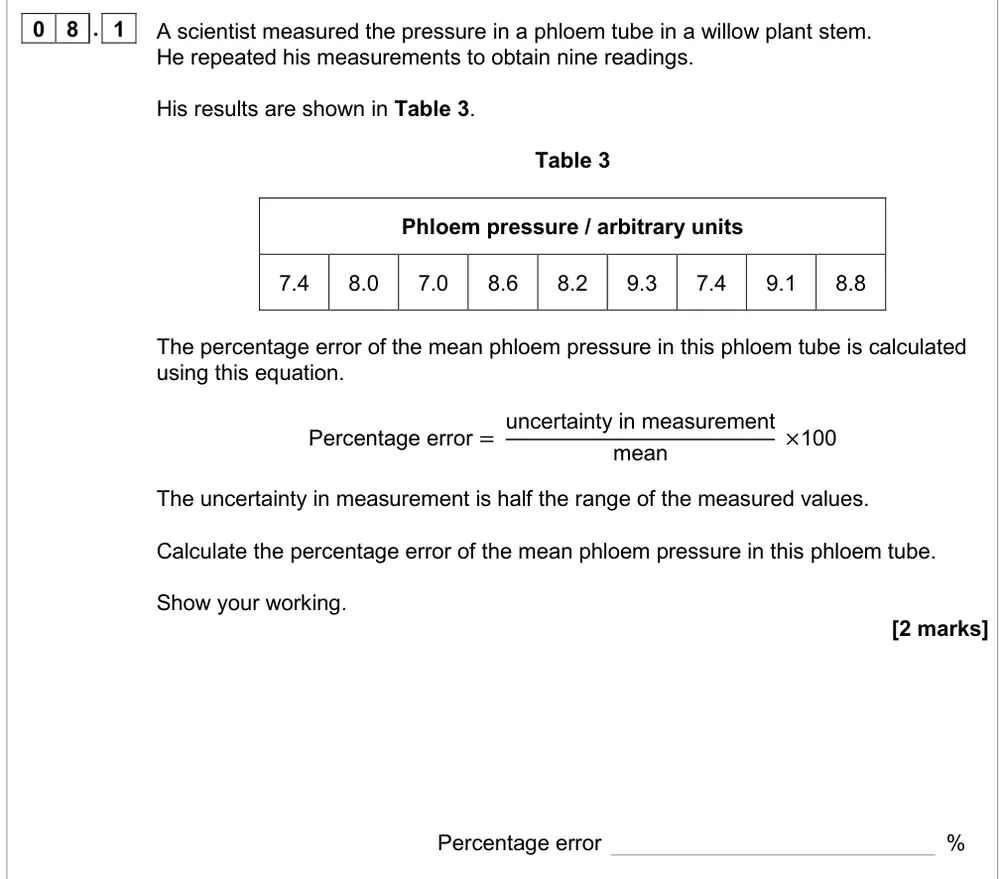
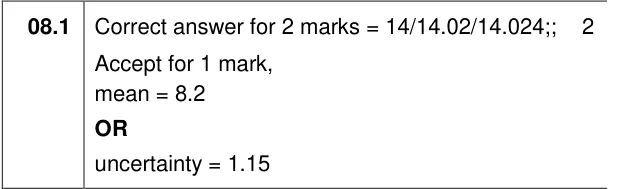
Calculate the percentage error of a mean phloem pressure from nine readings.
Show the mark scheme
Tap an image to open it full size.
From the examiners' report: Over 60% got both marks. Halve the range (9.3 − 7.0 = 2.3, so 1.15) as the question tells you, and work out the mean carefully.
Question 18
A level Paper 1 · June 2024 · Q03.5 · 2 marks · Hard
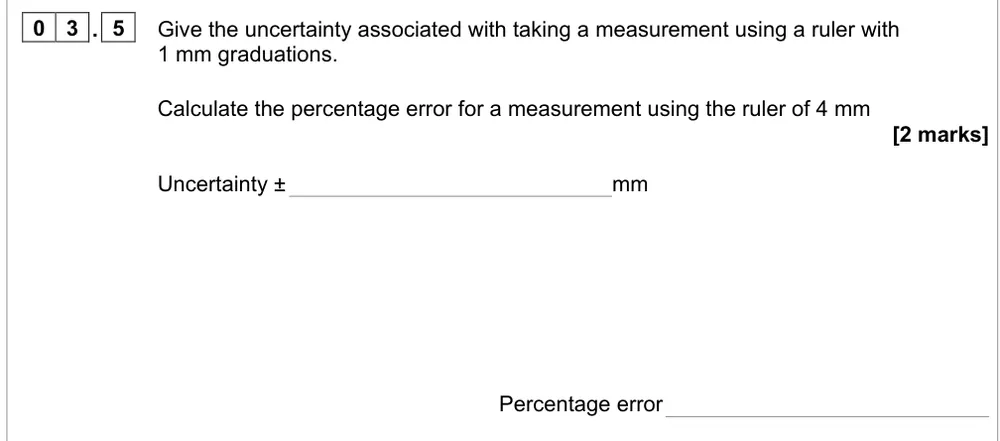
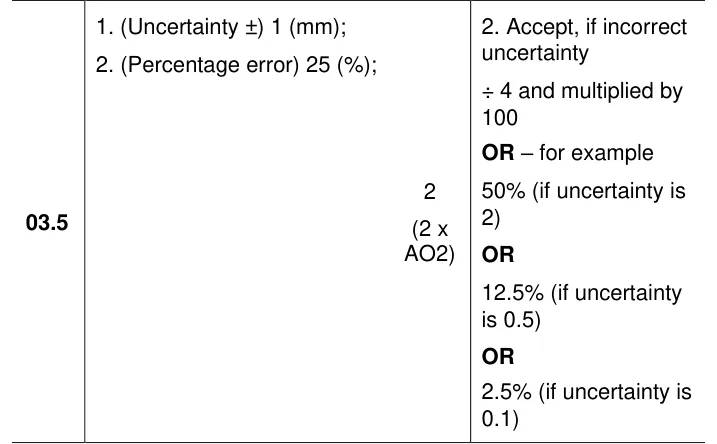
Give the uncertainty of a ruler measurement and calculate the percentage error for 4 mm.
Show the mark scheme
Tap an image to open it full size.
From the examiners' report: ±0.5 mm and 12.5% was a common answer that got 1 mark. A length needs two readings (each ±0.5 mm), so the uncertainty is ±1 mm.
Where students lose marks (from AQA examiners' reports and mark schemes)
Each point below is followed by wording that gained marks.
Significant difference, not significant results: Year after year examiners reject 'the results are significant' or 'the results are due to chance'. On the chi-squared question too many still wrote about the results; on P > 0.5 only 22.75% got both marks.
✔ Gains credit: "There is a less than 0.05 probability that the difference between observed and expected results occurred by chance, so reject the null hypothesis."
A high P value isn't a high risk: On the atrial fibrillation table many linked the highest P value (0.222) with the highest risk and scored zero. On the CAG repeat data fewer than 30% scored, with 'probability', 'chance' and 'risk' mixed up.
✔ Gains credit: "High LDL is not a significant risk factor (P = 0.222); age, high blood pressure and hyperthyroidism are significant, high blood pressure most significant."
Overlapping SDs mean no significant difference: Only about 10% got all 3 marks on the rabbit protein graph: many described the bar heights and ignored the ± 2 SD bars. On the zebrafish table 27% said the SDs didn't overlap but didn't say what that meant.
✔ Gains credit: "The ± 2 SDs overlap, so there is no significant difference in the mean percentage of protein absorbed."
Multiply by ½ for a son: Only about 30% got the haemophilia C probability; the most common wrong answer was 25%, because students left out the probability of a son.
✔ Gains credit: "¼ × ½ = 0.125 (12.5%, or 1 in 8)."
Outliers call for the median: Most students calculated a mean for the celery data, which limited them to 1 mark. Only 15% chose the median.
✔ Gains credit: "Median, because of the outliers (70 and 80); 41 mm."
A ruler length has two readings: An uncertainty of ±0.5 mm and a percentage error of 12.5% was common: that is the uncertainty of one reading, not of a length measured between two points.
✔ Gains credit: "Uncertainty ± 1 mm; percentage error = 1 ÷ 4 × 100 = 25%."
Match the null hypothesis to the data: Only 22% got both marks for the stomatal density data. Many gave a hypothesis, or the learned 'there is no difference between the two variables', which doesn't fit a relationship.
✔ Gains credit: "There is no correlation between carbon dioxide concentration and stomatal density; correlation coefficient (Spearman's rank)."
Random coordinates and lots of quadrats: Fewer than 7% got all 3 marks for finding mean percentage cover. Most didn't say how to choose positions at random, didn't use a large number of quadrats, and some suggested throwing quadrats.
✔ Gains credit: "Use a random number generator for coordinates; a large number of quadrats; divide the total percentage cover by the number of quadrats."
Download the questions
Download the PDF pack (18 questions, mark schemes at the end)
Keep practising
- Graph skills (MS 3): AQA A Level Biology exam questions
- Arithmetic and numerical skills (MS 0): AQA A Level Biology exam questions
- Required practical 2, mitosis: AQA A Level Biology exam questions
- Calculations and mathematical content in A level Biology, from AQA papers
- AQA A Level Biology masterclasses
Questions, mark schemes and examiners' report extracts © AQA.