

Core Practical 4 asks you to investigate the effect of enzyme and substrate concentrations on the initial rate of an enzyme-controlled reaction. You make up a range of concentrations of one of them, control the volumes, temperature and pH, and follow the reaction over time, for example by measuring the colour of starch with iodine in a colorimeter or the fall in substrate concentration. You then plot your results and find the initial rate from a tangent at the start of the curve. These questions come from real Edexcel A level Biology A (Salters-Nuffield) papers. Core practicals can be examined on any paper, but Paper 3 at A level tests practical skills most heavily. Questions marked AS are from the AS papers (8BN0); the rest are from the A level papers (9BN0).
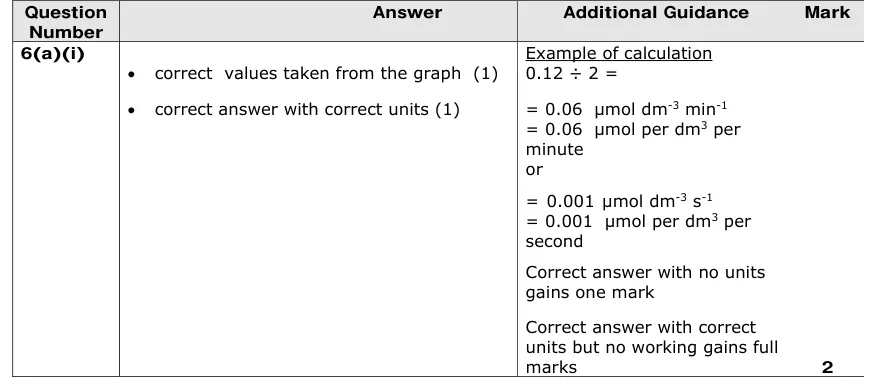
The examiners' biggest warning is that many students do not know the difference between the rate of reaction and the initial rate. Dividing the total change by the total time gives a mean rate; the initial rate comes from a tangent or gradient at time zero, and it needs a unit. When you plan an investigation, say how many concentrations you will use, work with the values, enzyme and apparatus given in the question rather than a method from a different practical, and keep the substrate in excess when you compare enzymes. And write colorimeter, not calorimeter.
Studying Edexcel SNAB and want more help? If you'd like to arrange one-to-one Edexcel tutoring, or to register your interest in an Edexcel group class, message Tom on WhatsApp using the link at the bottom of this page.
What you need first
Each question on this page assumes you're secure on these ideas. If any of them feels shaky, look it up before you start.
- Enzymes are biological catalysts: the substrate binds to the active site to form an enzyme-substrate complex.
- High temperatures and extreme pH change the shape of the active site and denature the enzyme.
- Rate of reaction is the change in the amount of substrate or product per unit time.
- The gradient of a straight line is the change in y divided by the change in x.
Key terms
These words come up in the questions and mark schemes. Examiners expect you to use them exactly.
- Initial rate of reaction: the rate at the very start of the reaction, found from a tangent or gradient at time zero, before the substrate becomes limiting.
- Tangent: a straight line that touches a curve at one point; its gradient gives the rate at that point.
- Limiting factor: the factor in shortest supply, which stops the rate of reaction rising any further.
- Substrate in excess: more substrate than the enzyme can use, so the enzyme works at its maximum rate.
- Colorimeter: an instrument that measures how much light a coloured solution absorbs (not a calorimeter, which measures energy).
- Buffer: a solution that keeps the pH at a set value.
- Denaturation: a permanent change in the shape of the active site, so the substrate no longer fits.
What these questions cover
Every question on this page is set on Core Practical 4 of the Pearson Edexcel A level Biology A (Salters-Nuffield) specification (9BN0).
- Core Practical 4: Investigate the effect of enzyme and substrate concentrations on the initial rates of reactions.
How to use this page
Write your answer on paper before you open the mark scheme. Allow about 1.2 minutes per mark: the 15 questions are worth 42 marks, so about 50 minutes in total. Then mark your answer strictly against the mark scheme and read the examiners' tip underneath it. If you'd rather print the questions, download the PDF pack.
Planning an enzyme investigation (CP4)
Question 1
AS Paper 1 · June 2017 · Q8(b)(ii) · 4 marks
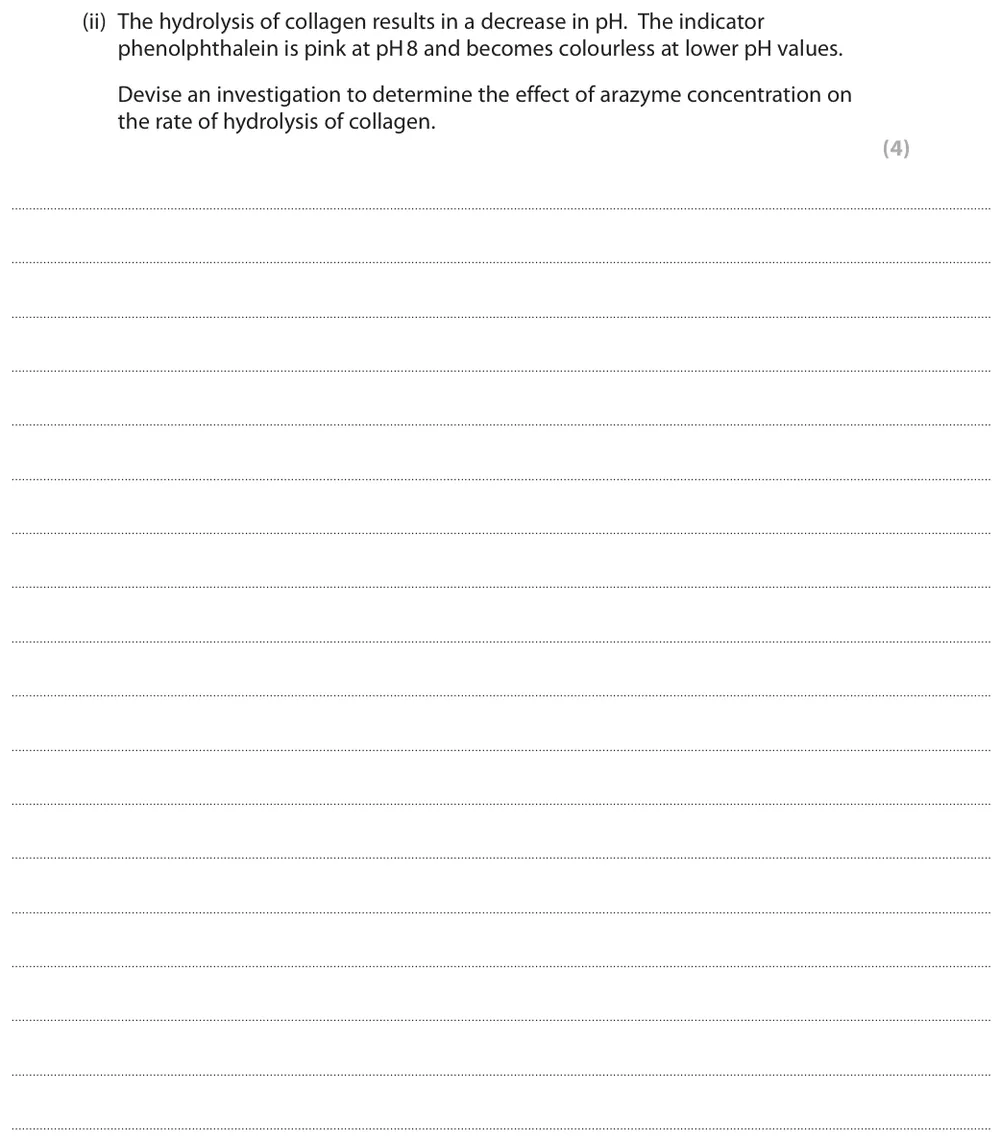
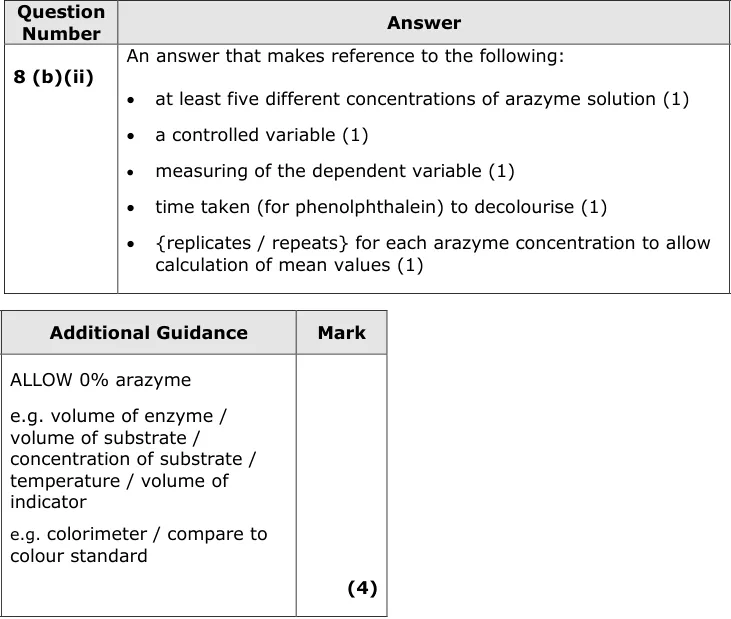
Devise an investigation into the effect of arazyme concentration on the rate of collagen hydrolysis, using the indicator phenolphthalein.
Information from earlier in this question:

Show the mark scheme
Tap an image to open it full size.
From the examiners' report: Say how many concentrations you would use (at least five), and change the enzyme's concentration, not its volume. The stem says the falling pH causes the colour change, so don't add buffers; few thought of a colorimeter or colour standard to judge the end point, and repeats must be for every concentration.
Question 2
AS Paper 1 · June 2022 · Q7(b) · 6 marks
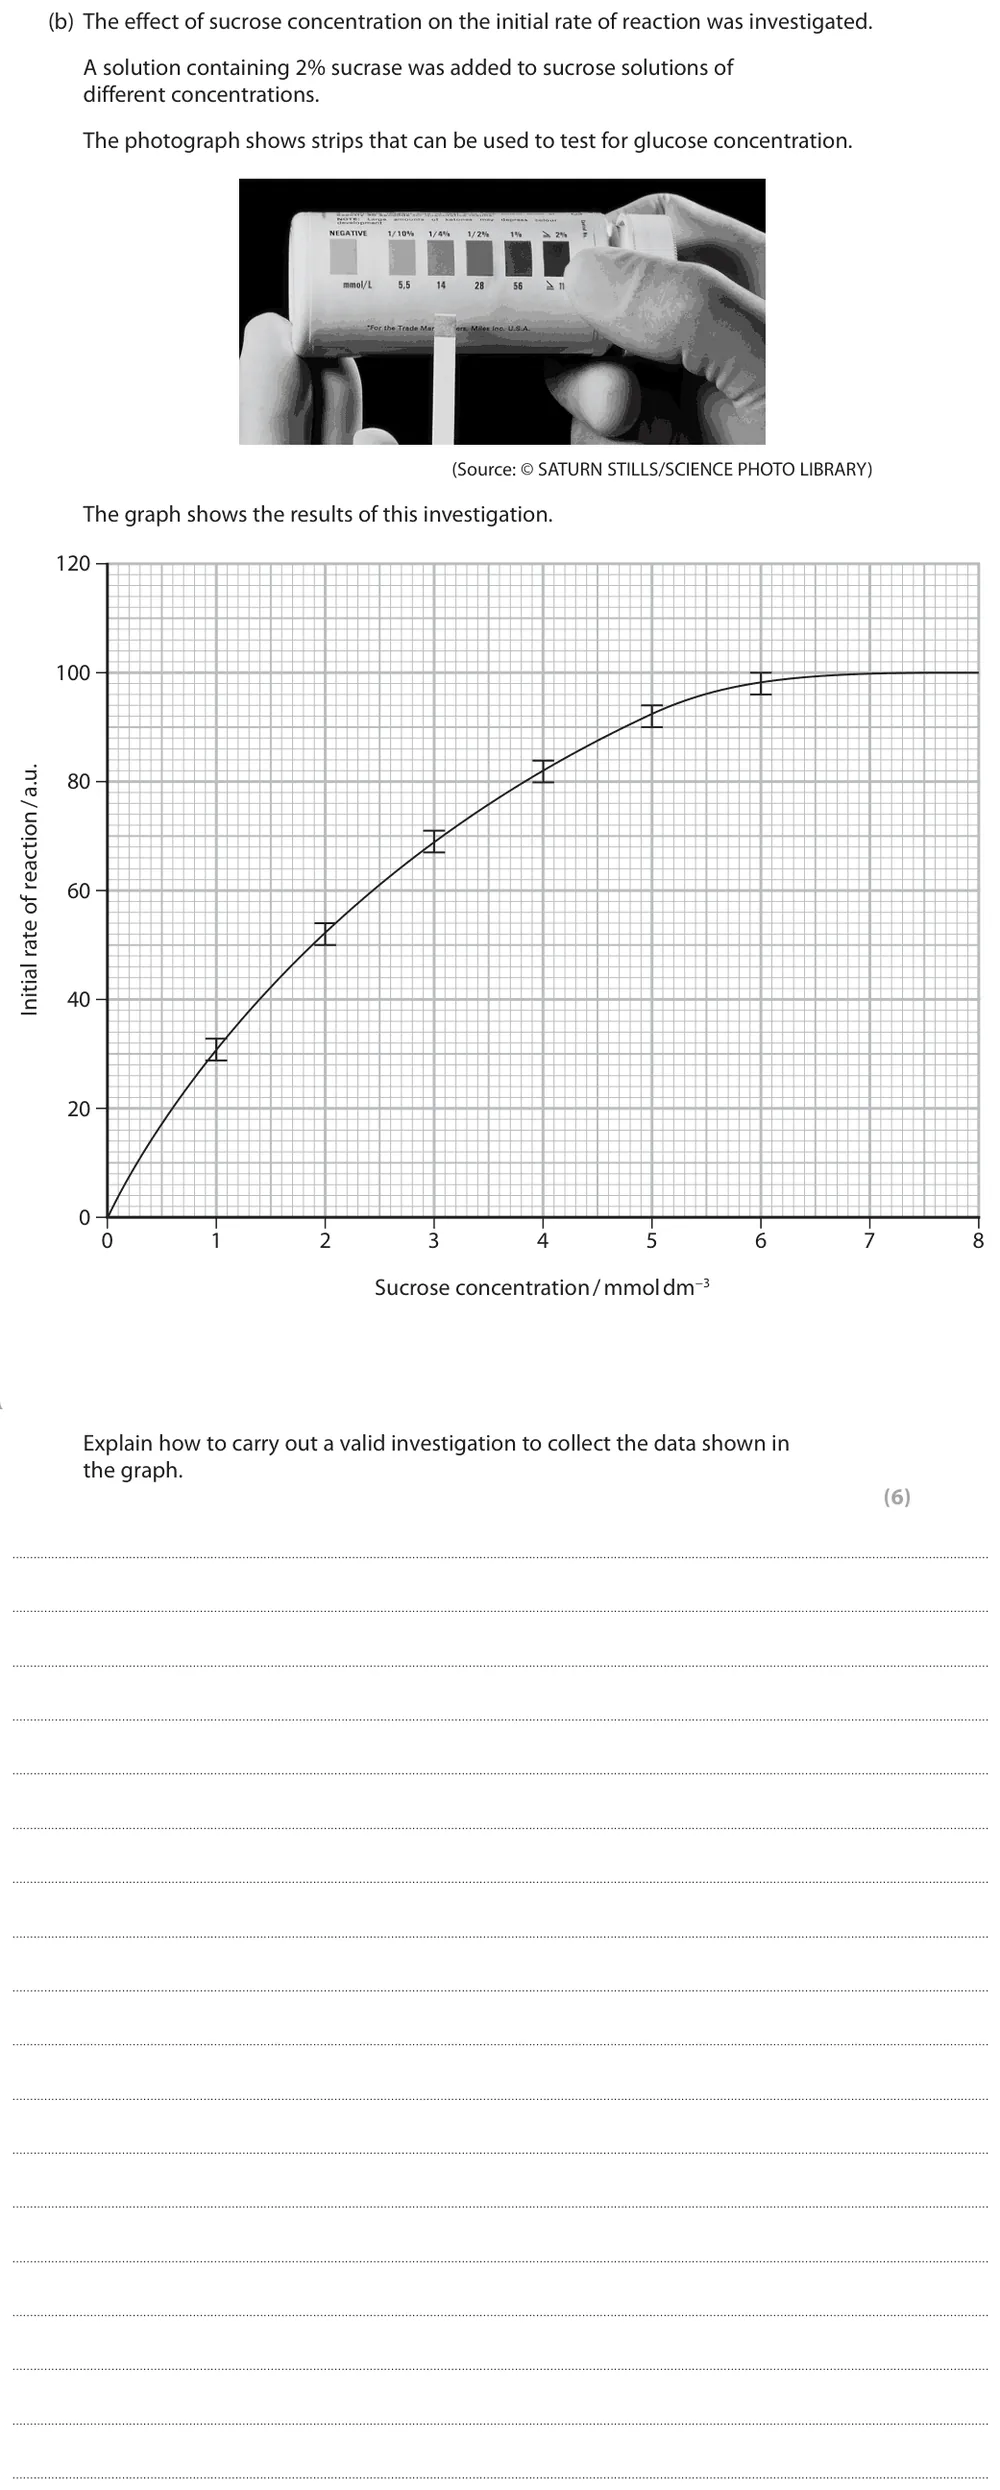
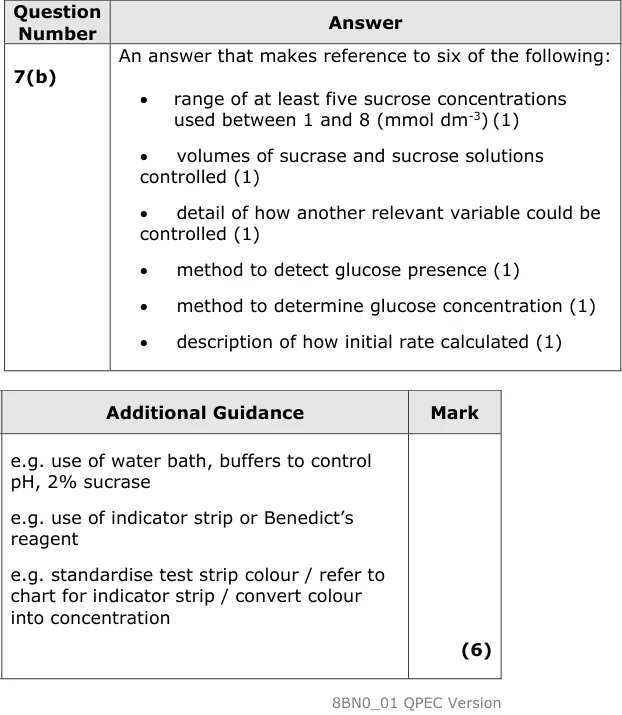
Explain how to carry out a valid investigation, using sucrase and glucose test strips, to collect the data shown in the graph.
Show the mark scheme
Tap an image to open it full size.
From the examiners' report: Use the sucrose concentrations on the graph (between 1 and 8 mmol dm⁻³), not 0%, 20%, 40%. Use the sucrase, the glucose test strips and the photograph you are given, not colorimeters or gas syringes from other enzyme practicals, and say how the initial rate is calculated.
Question 3
A level Paper 3 · June 2019 · Q6(c) · 4 marks · Hard
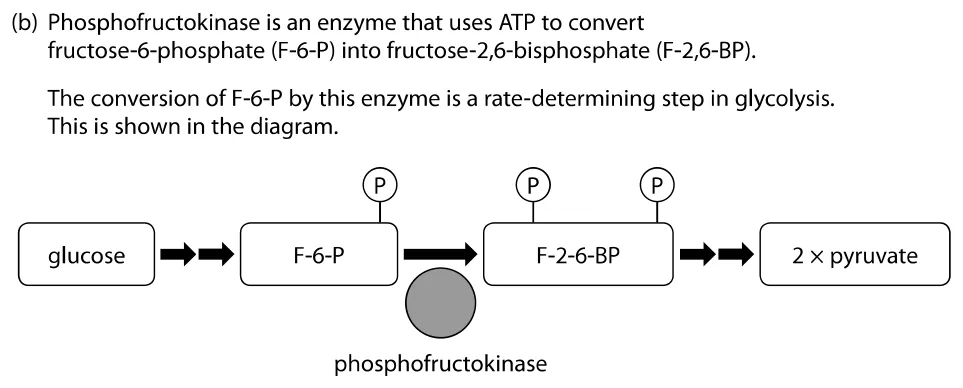
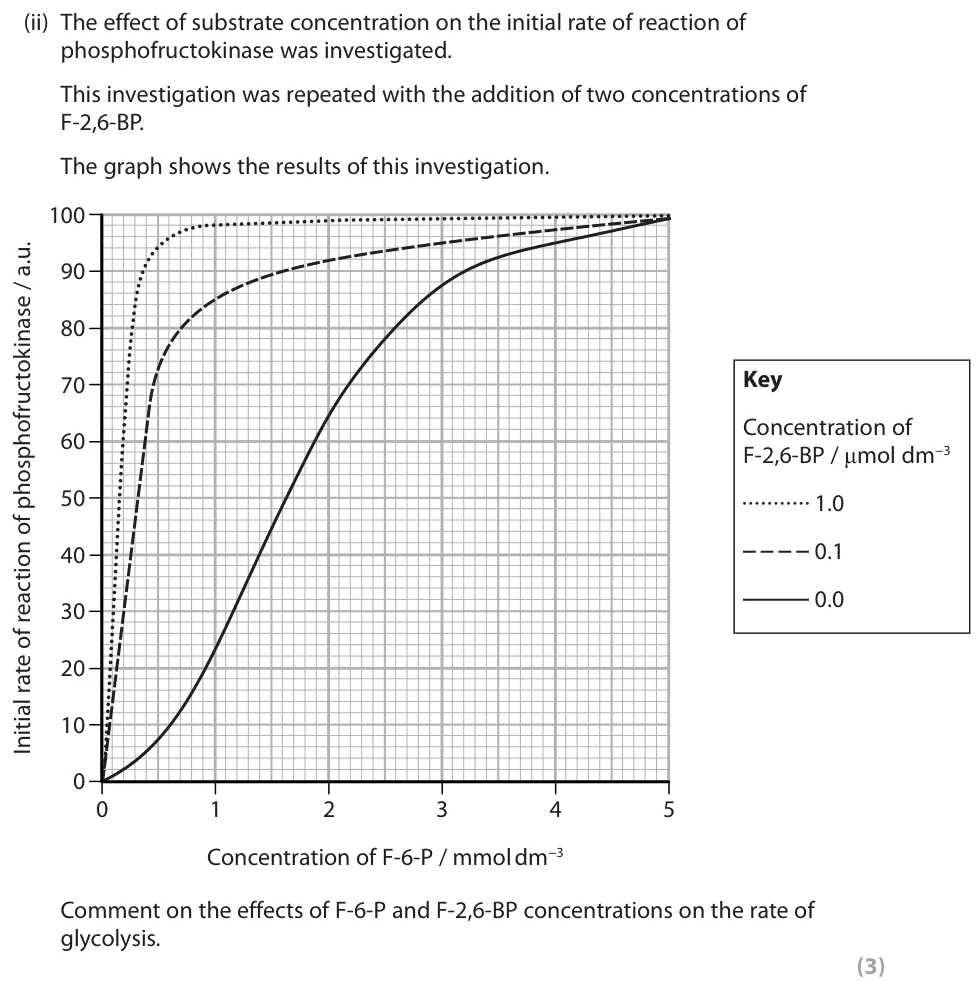
Devise an investigation into the effect of acidic conditions on the initial rate of reaction of phosphofructokinase.
Information from earlier in this question:

Show the mark scheme
Tap an image to open it full size.
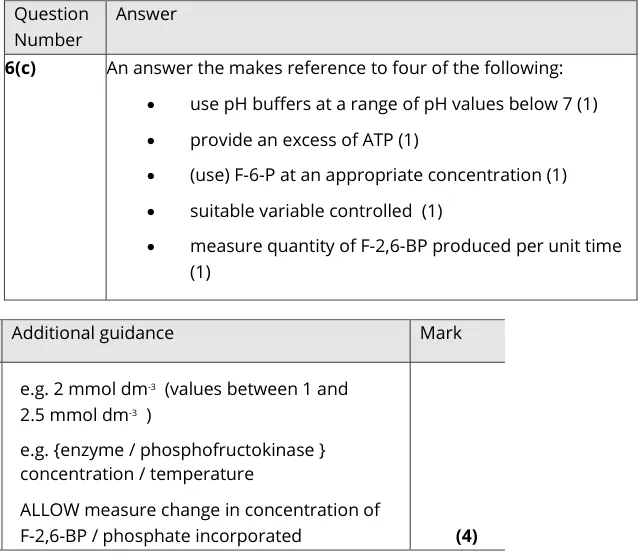
From the examiners' report: Use pH buffers, not just solutions of different pH. Give ATP in excess so it is not rate limiting, choose an F-6-P concentration from the data earlier in the question, and measure the F-2,6-BP produced per unit time.
Measuring the reaction (CP4)
Question 4
AS Paper 1 · November 2021 · Q7(a)(i) · 1 mark
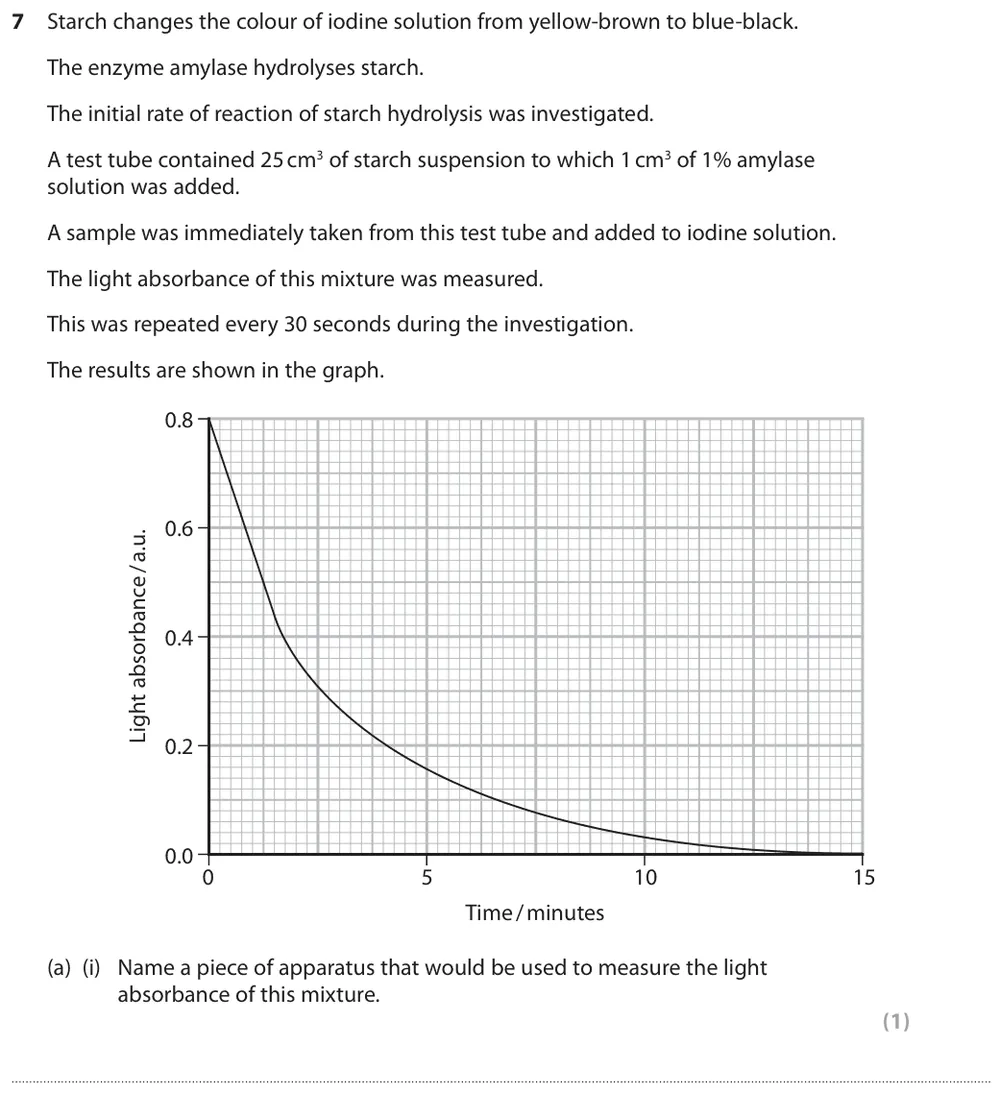
Name the apparatus used to measure the light absorbance of the starch and iodine mixture.
Show the mark scheme

Tap an image to open it full size.
From the examiners' report: A colorimeter. A significant number wrote calorimeter, which was not accepted.
Question 5
AS Paper 1 · November 2021 · Q7(b) · 3 marks
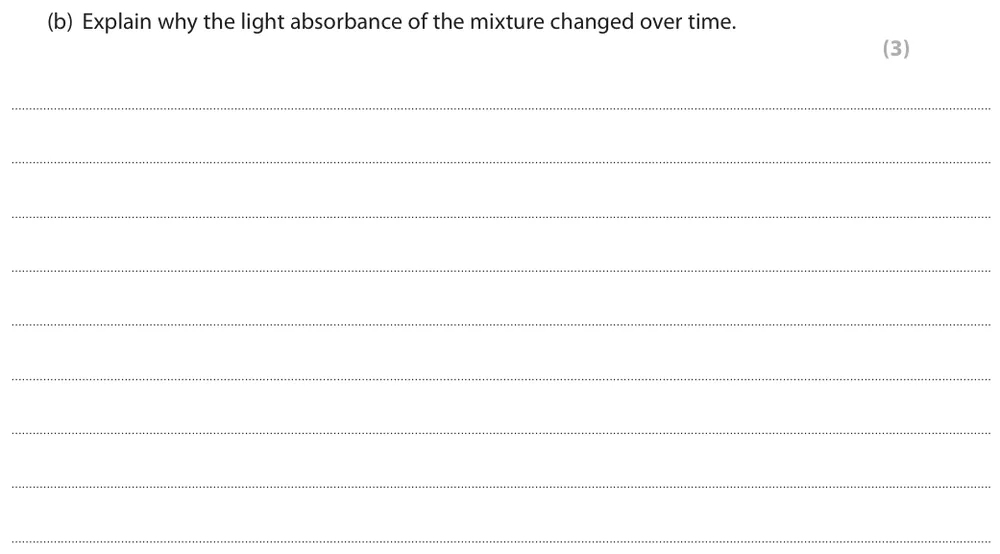
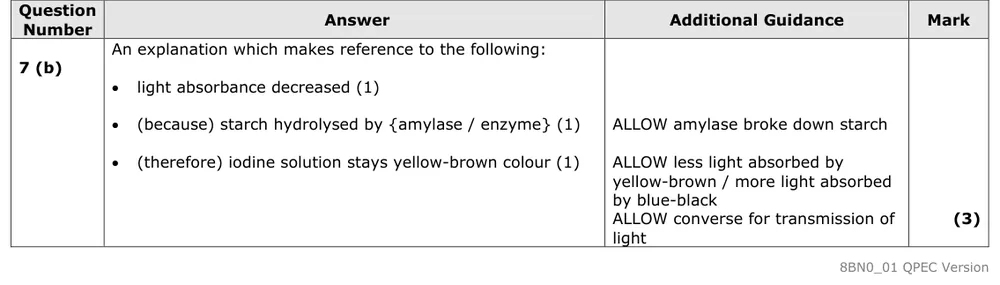
Explain why the light absorbance of the mixture changed over time.
Show the mark scheme
Tap an image to open it full size.
From the examiners' report: State that absorbance decreased because amylase hydrolysed the starch. Few linked this to the colour: iodine is blue-black with starch but stays yellow-brown without it, so less light is absorbed.
Calculating the initial rate (CP4)
Question 6
AS Paper 1 · November 2021 · Q7(a)(ii) · 3 marks
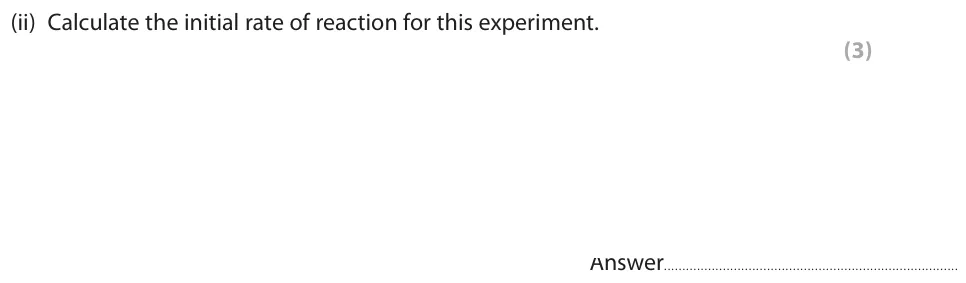
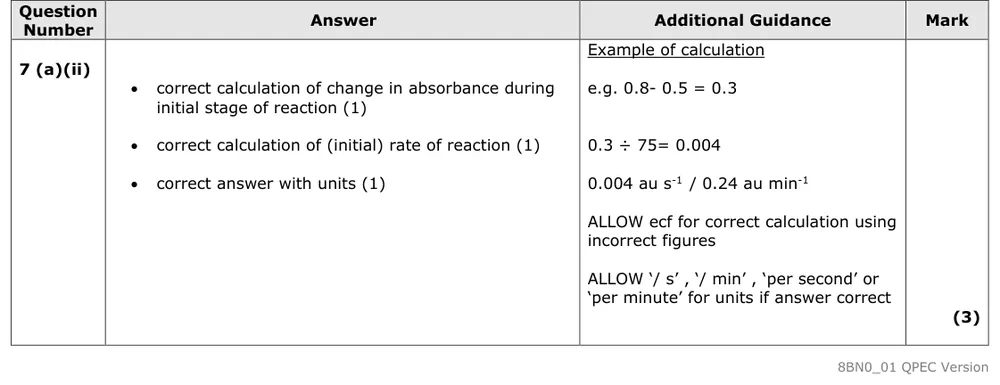
Calculate the initial rate of reaction from the absorbance graph, with units.
Show the mark scheme
Tap an image to open it full size.
From the examiners' report: Use the change in absorbance in the initial stage only, e.g. 0.3 ÷ 75 = 0.004 au s⁻¹. Many worked out 0.8 ÷ 15 or 1/t, and most gave no unit even though none was printed on the answer line.
Question 7
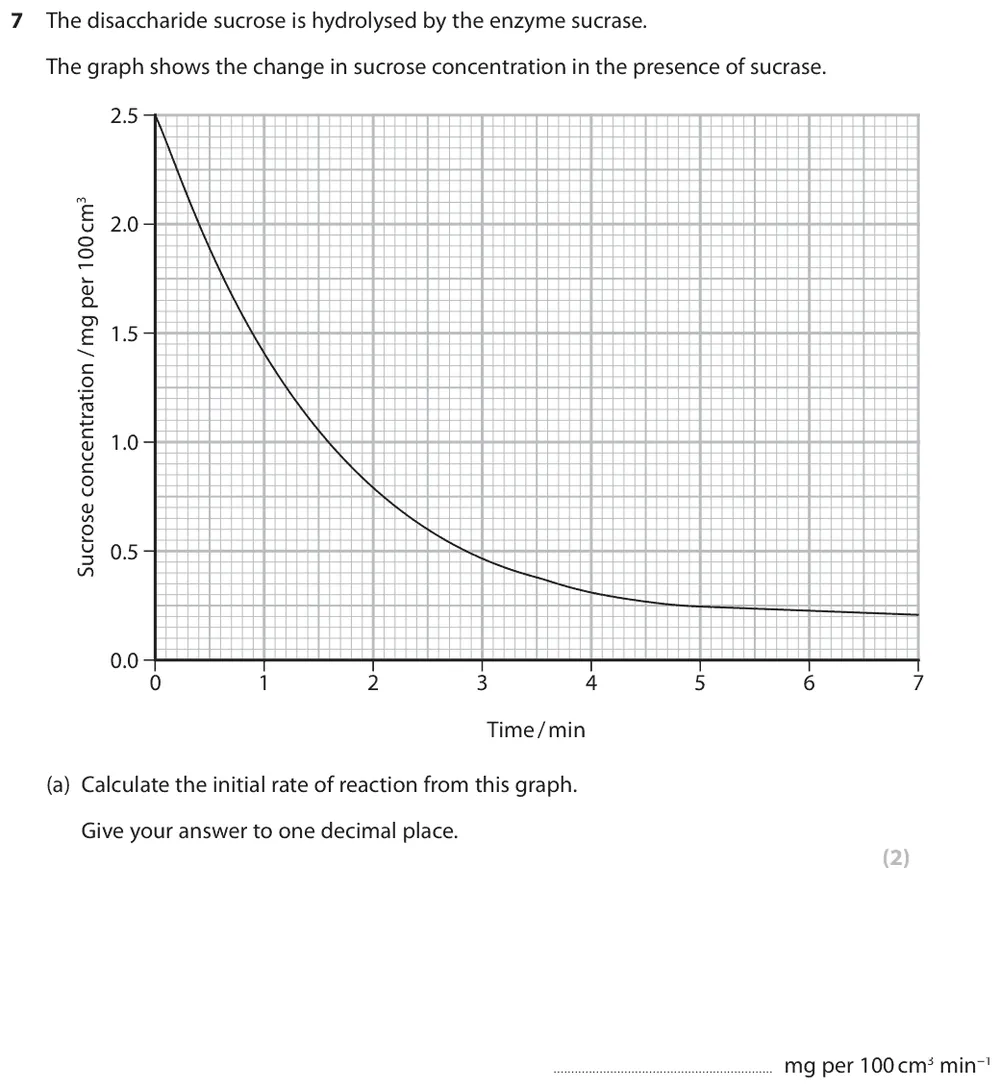
AS Paper 1 · June 2022 · Q7(a) · 2 marks
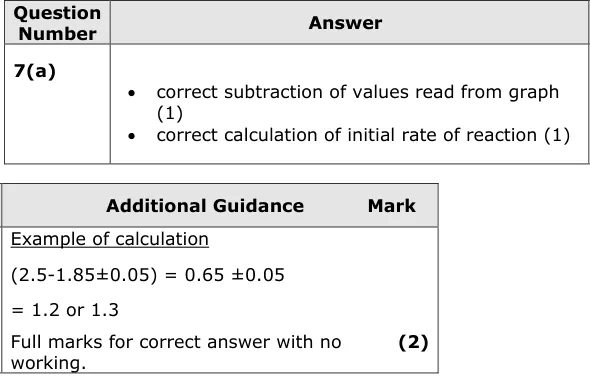
Calculate the initial rate of sucrose hydrolysis from the graph, to one decimal place.
Show the mark scheme
Tap an image to open it full size.
From the examiners' report: Most did not know the difference between rate and initial rate: dividing the total fall in sucrose concentration by 7 minutes was not credited. Draw your tangent at the start of the curve, not where sucrose concentration may have become limiting.
Question 8
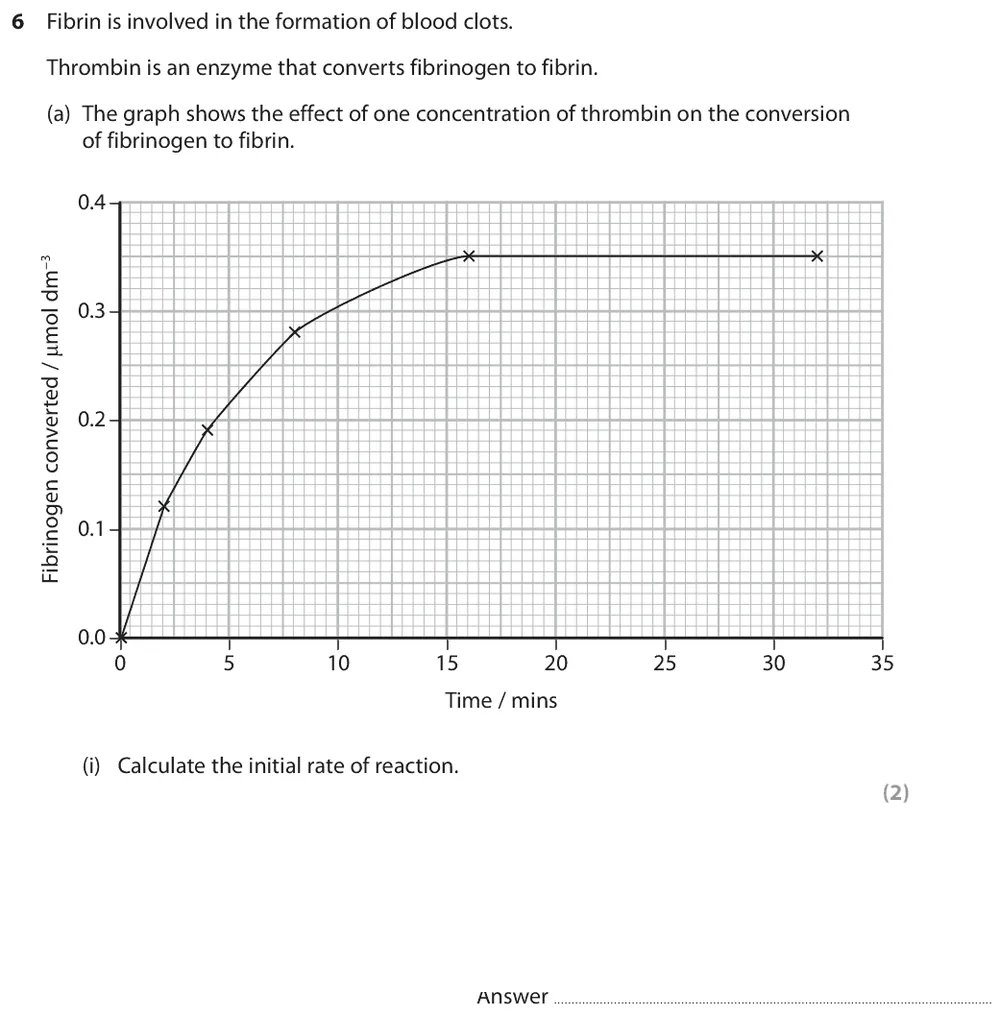
A level Paper 1 · June 2017 · Q6(a)(i) · 2 marks
Calculate the initial rate of conversion of fibrinogen to fibrin from the graph.
Show the mark scheme
Tap an image to open it full size.
Question 9
AS Paper 1 · June 2025 · Q6(d)(ii) · 2 marks · Hard
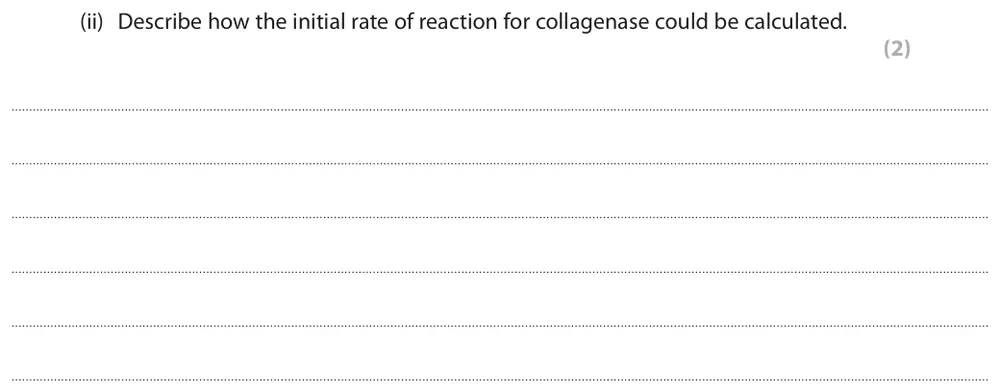
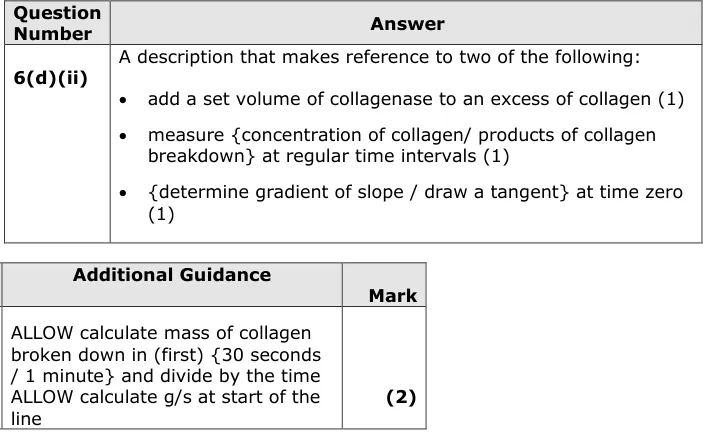
Describe how the initial rate of reaction for collagenase could be calculated.
Show the mark scheme
Tap an image to open it full size.
From the examiners' report: Few realised a new investigation was needed: add a set volume of collagenase to excess collagen and measure at regular intervals. Most knew to draw a tangent or find a gradient, but not that it must be at the start of the line, at time zero.
Enzyme and substrate concentration (CP4)
Question 10
AS Paper 1 · November 2021 · Q7(a)(iii) · 1 mark
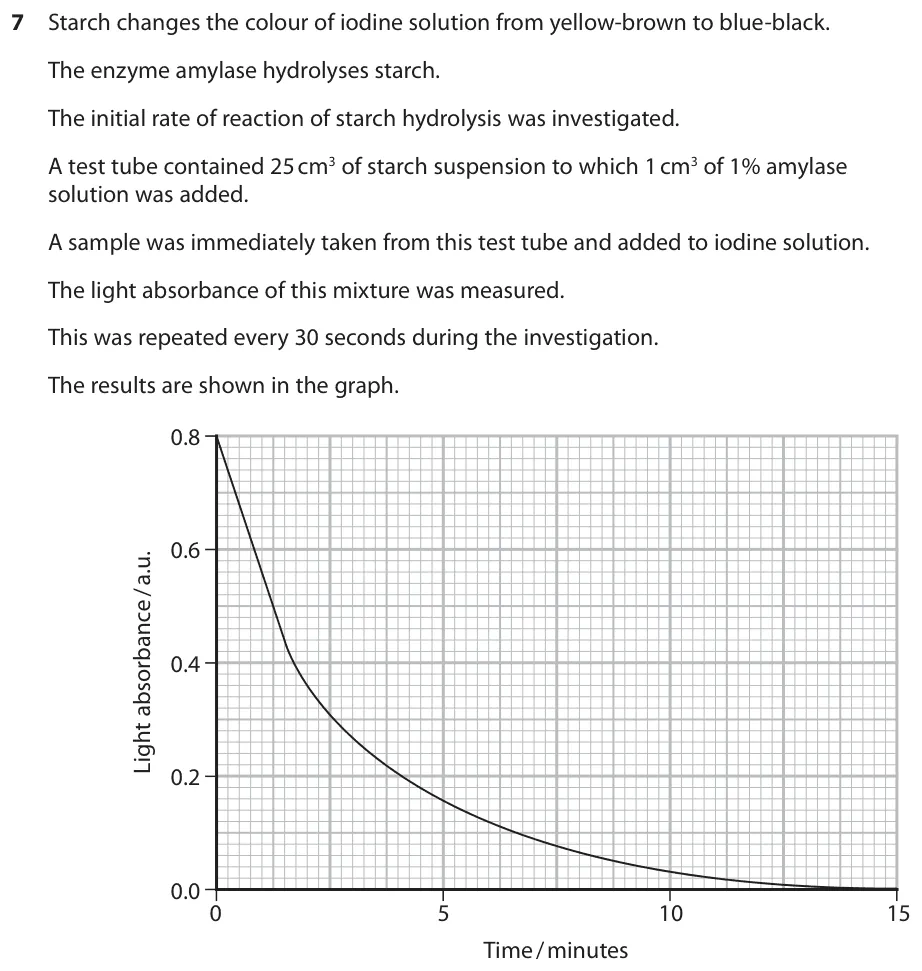
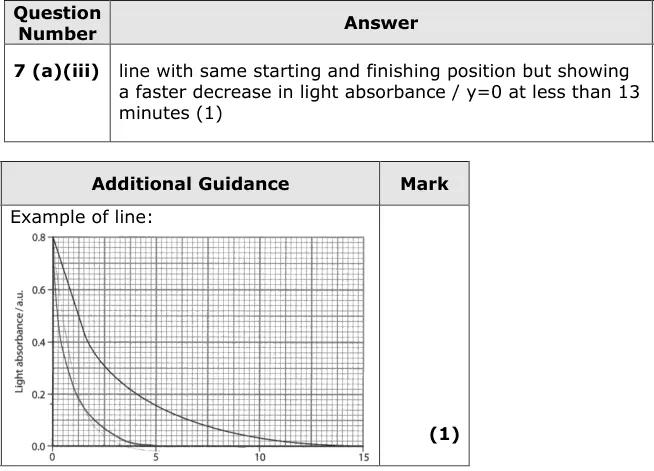
Draw a line on the graph to show the expected trend with 5% amylase instead of 1%.
Information from earlier in this question:

Show the mark scheme
Tap an image to open it full size.
From the examiners' report: Most drew this well: the line starts and finishes at the same absorbance but falls faster, reaching zero before 13 minutes.
Question 11
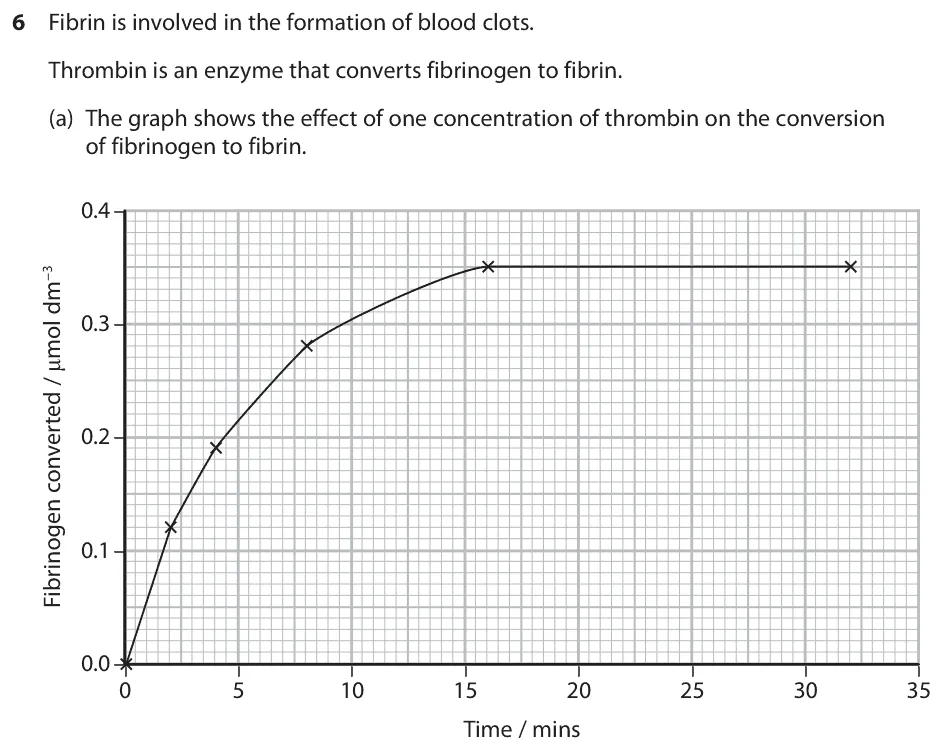
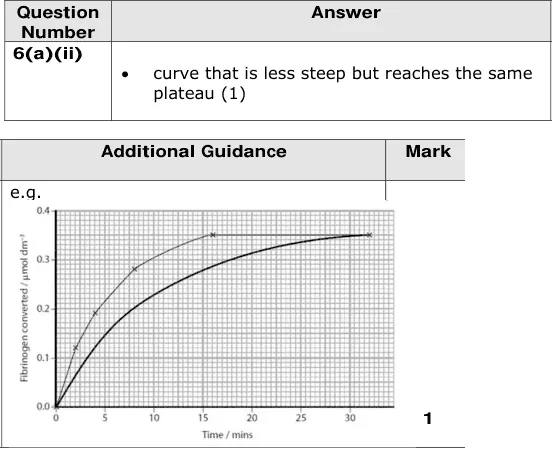
A level Paper 1 · June 2017 · Q6(a)(ii) · 1 mark
Draw a line on the graph to show the effect of halving the concentration of thrombin.
Information from earlier in this question:

Show the mark scheme
Tap an image to open it full size.
Question 12
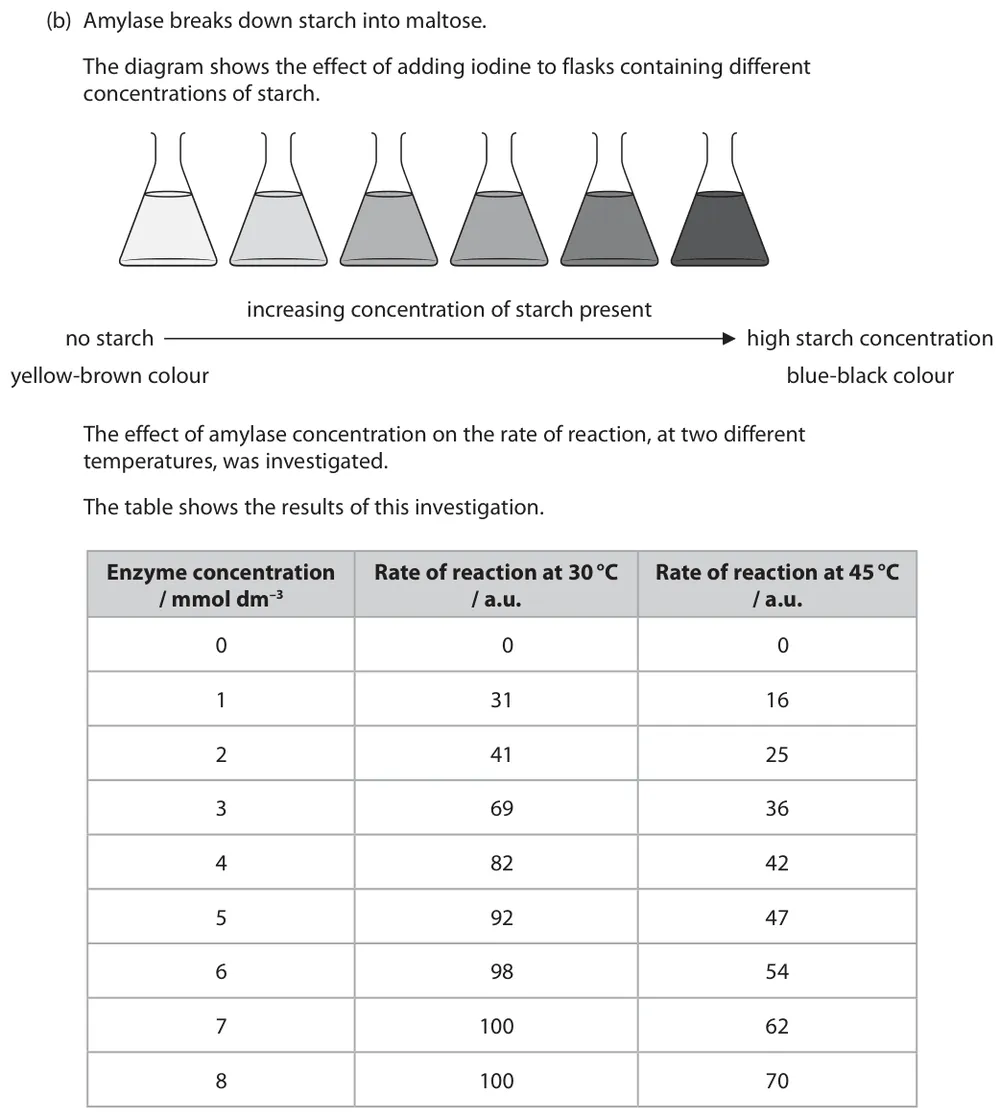
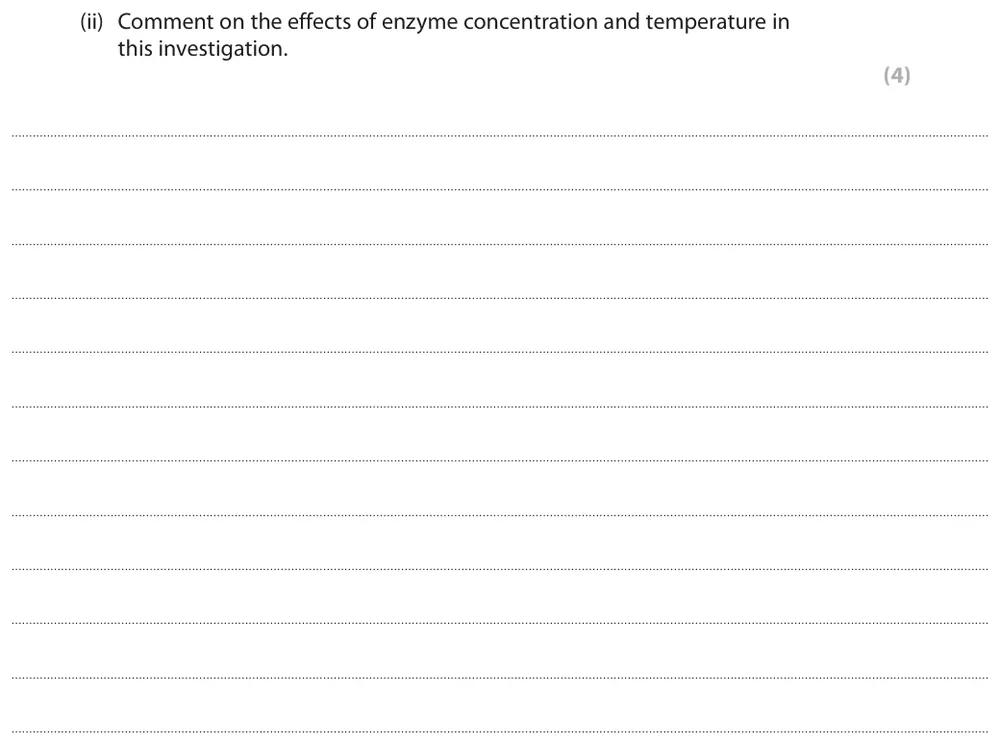
AS Paper 1 · June 2024 · Q6(b)(ii) · 4 marks
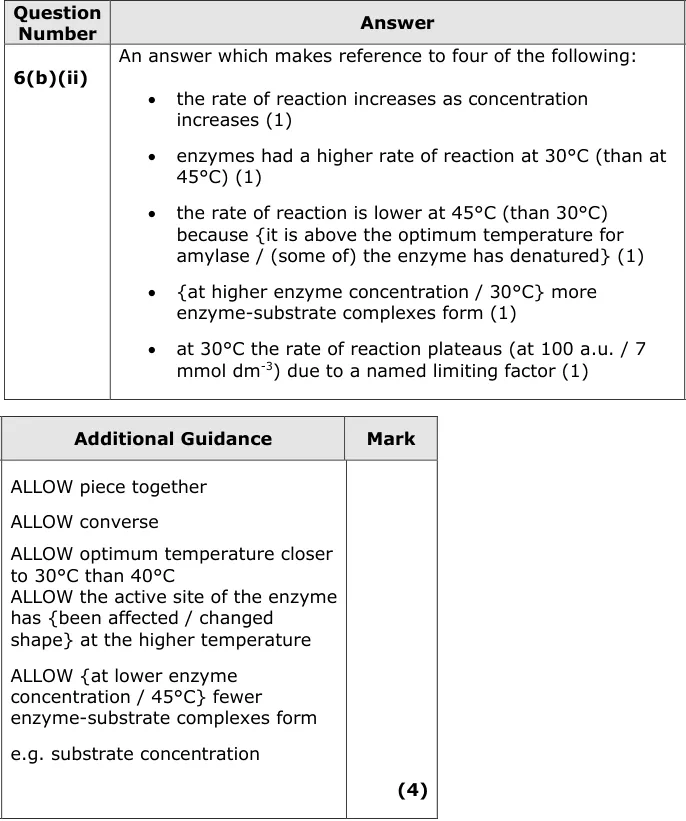
Comment on the effects of enzyme concentration and temperature on the rate of reaction in this investigation.
Information from earlier in this question:
Show the mark scheme
Tap an image to open it full size.
From the examiners' report: Many wrongly said the rate was higher at 45°C than at 30°C because of more kinetic energy and collisions. Apply it to the context: 45°C is above the optimum, so some enzyme has denatured. Better answers spotted the plateau at 30°C and linked it to a limiting factor.
Question 13
A level Paper 1 · June 2018 · Q8(d) · 2 marks
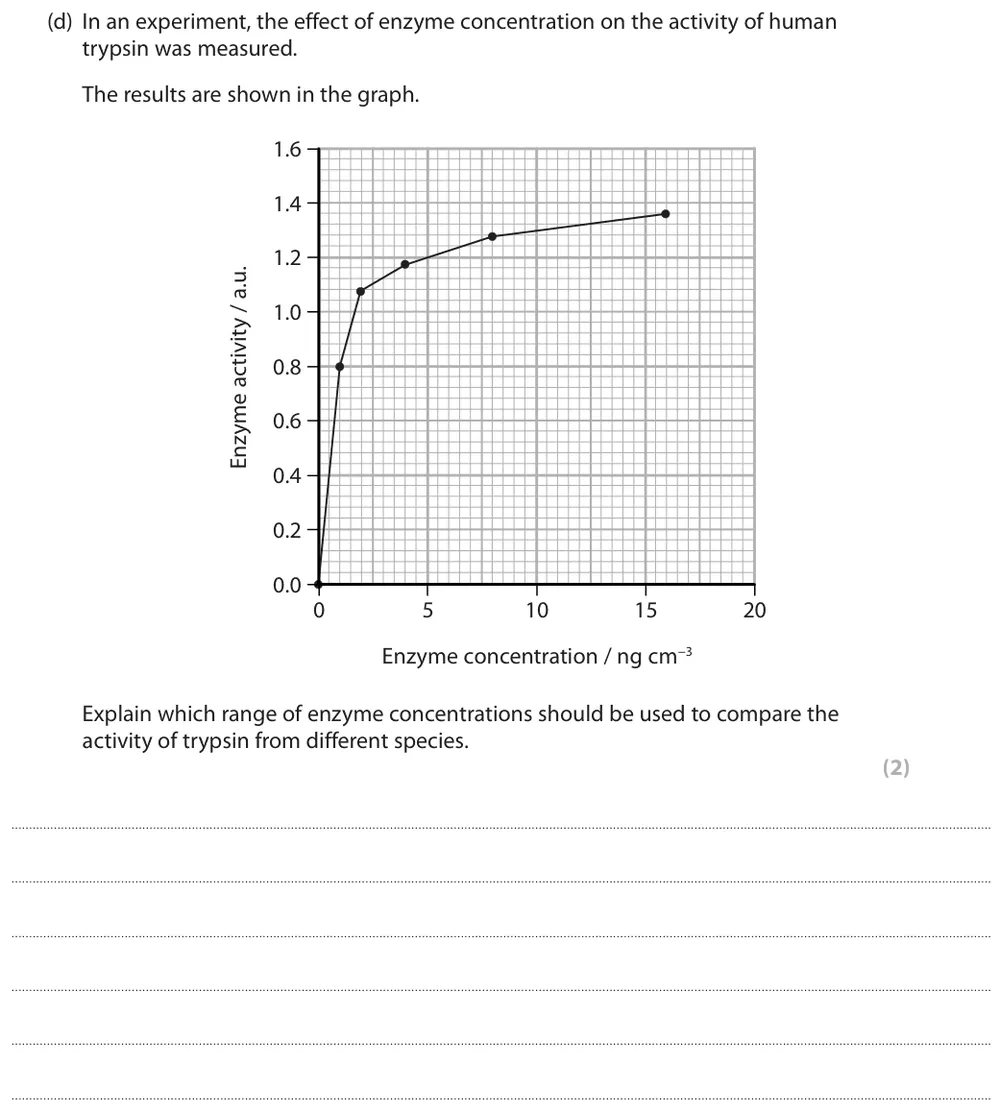
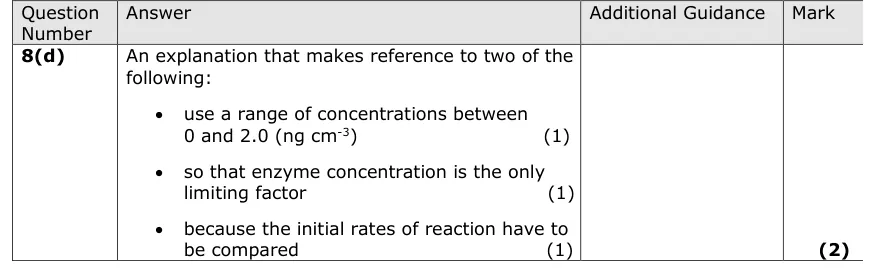
Explain which range of trypsin concentrations should be used to compare trypsin from different species.
Show the mark scheme
Tap an image to open it full size.
From the examiners' report: Choose concentrations between 0 and 2 ng cm⁻³, where enzyme concentration is the only limiting factor, because initial rates of reaction have to be compared.
Question 14
A level Paper 3 · June 2024 · Q5(c)(ii) · 3 marks
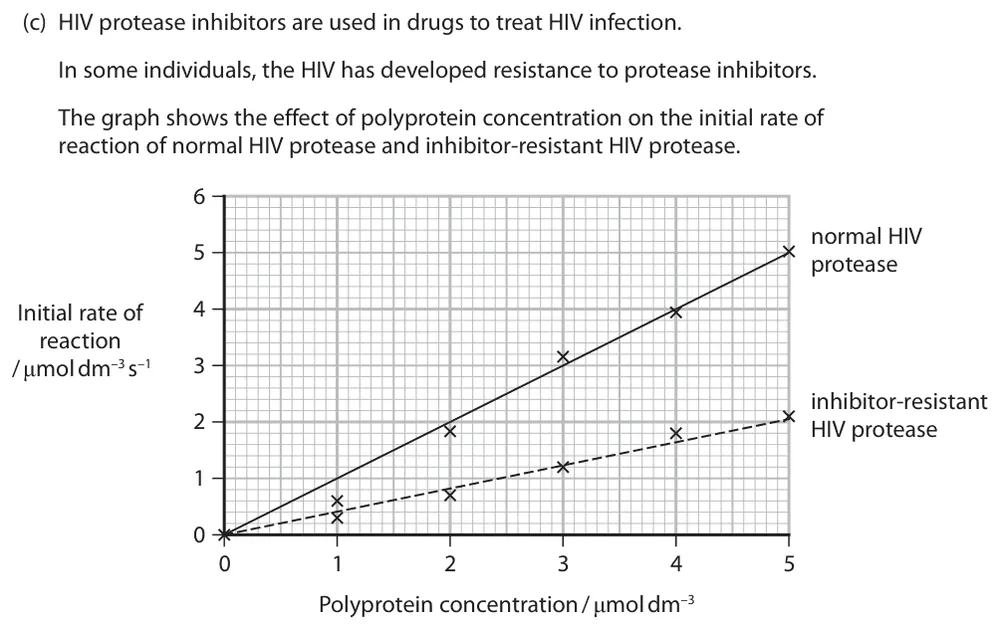
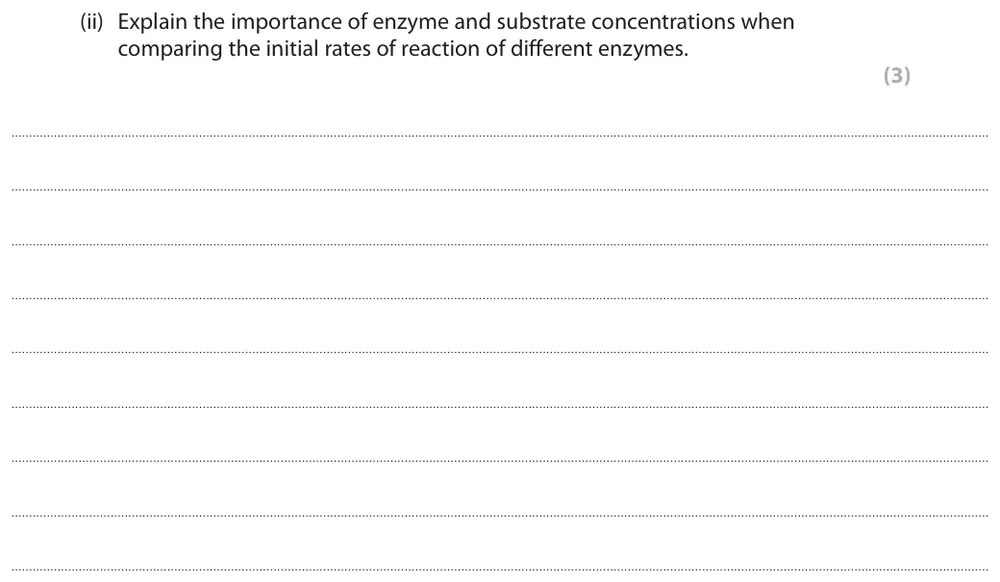
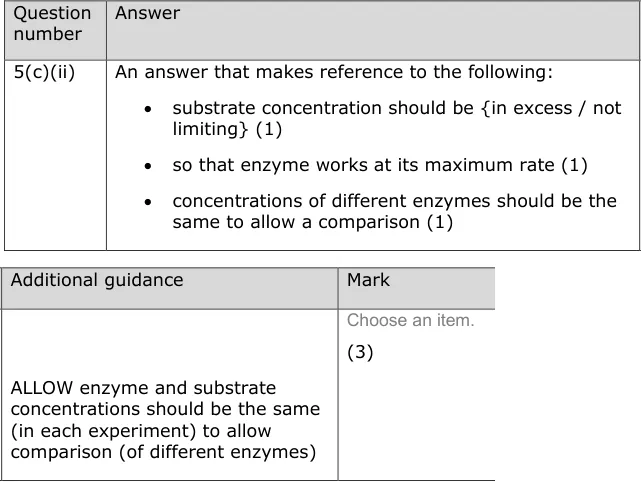
Explain the importance of enzyme and substrate concentrations when comparing the initial rates of different enzymes.
Information from earlier in this question:
Show the mark scheme
Tap an image to open it full size.
From the examiners' report: The commonest mark was for keeping the concentrations the same to allow a comparison. Few said the substrate should be in excess so that the enzyme works at its maximum rate.
Evaluating a conclusion (CP4)
Question 15
AS Paper 1 · June 2017 · Q8(c) · 4 marks
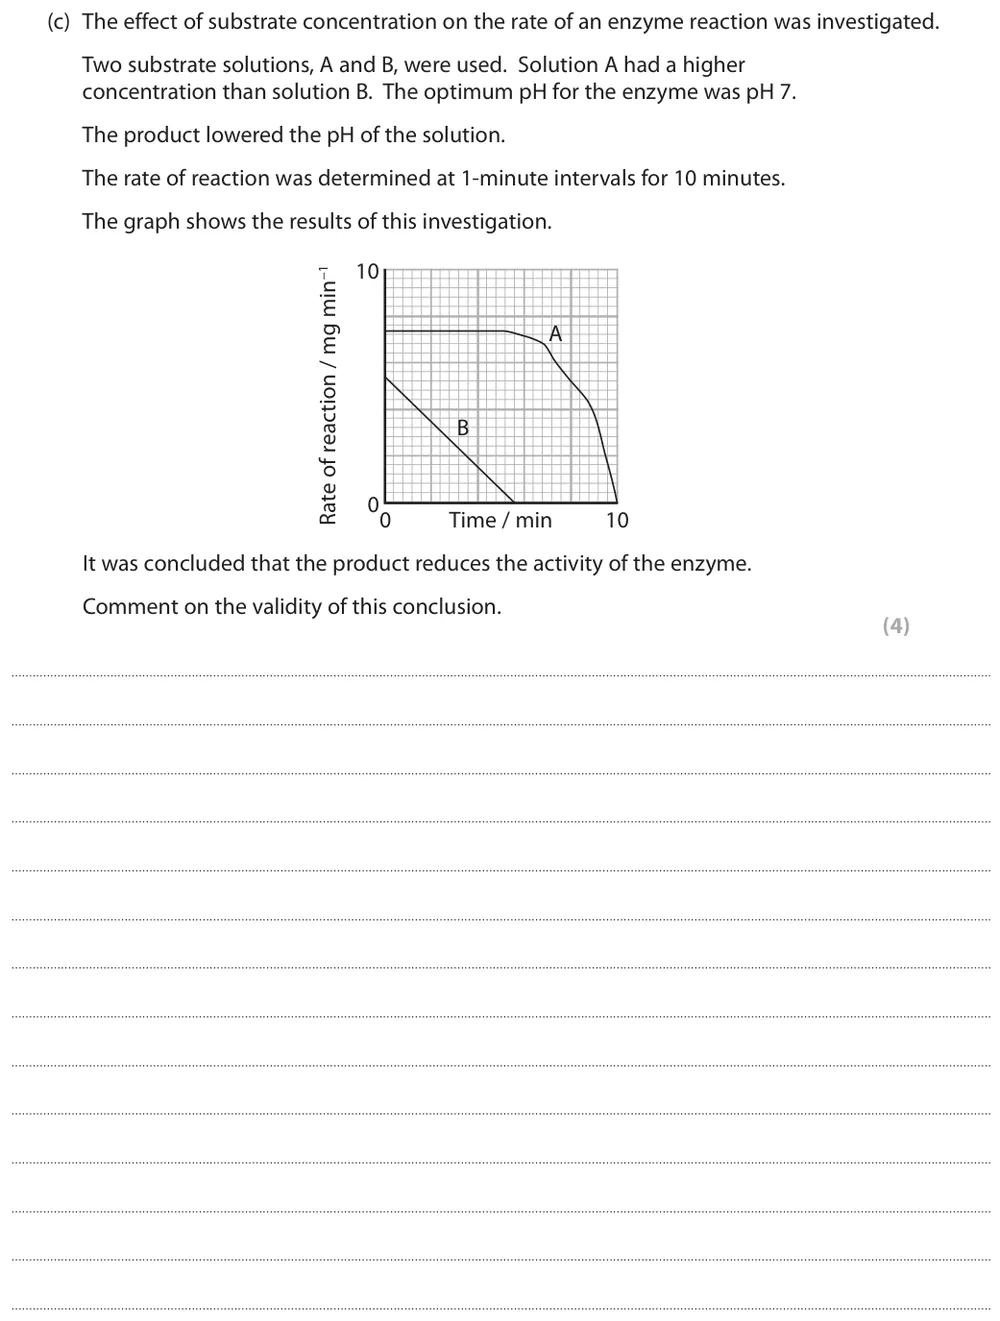
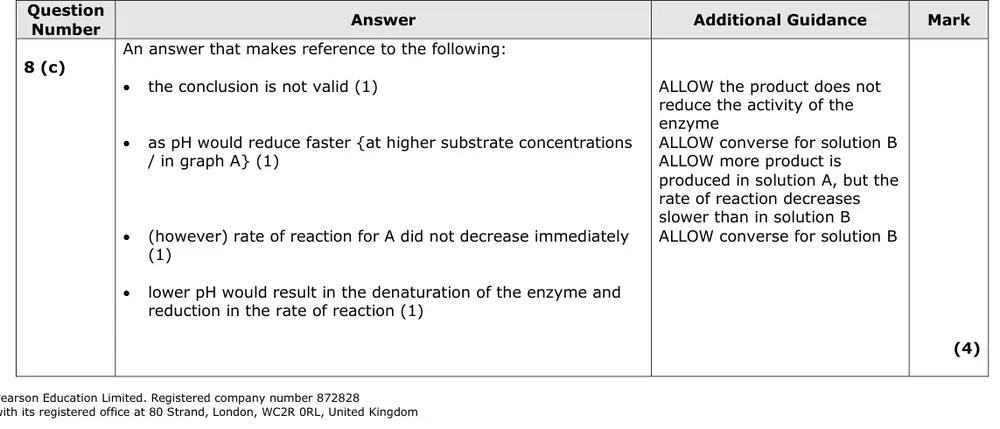
Comment on the validity of the conclusion that the product reduces the activity of the enzyme.
Show the mark scheme
Tap an image to open it full size.
From the examiners' report: Say clearly that the conclusion is not valid ('not very valid' was not enough), and don't criticise the procedure. The product lowers the pH, which denatures the enzyme and reduces the rate; substrate limiting the rate was a common wrong idea.
Where students lose marks (from Pearson examiners' reports and mark schemes)
Each point below comes from the examiners' reports and mark schemes, and is followed by wording that gained marks.
Say how many concentrations. Many referred to 'a range of concentrations' without saying how many, and a minority changed the volume of enzyme instead of its concentration.
✔ Gains credit: 'At least five different concentrations of arazyme solution.'
Colorimeter, not calorimeter. A significant number of students named a calorimeter to measure light absorbance.
✔ Gains credit: 'Colorimeter.'
Link absorbance to the iodine colour. Few linked the colour of the iodine solution to the light absorbance.
✔ Gains credit: 'Starch hydrolysed by amylase, therefore the iodine solution stays yellow-brown; less light is absorbed by yellow-brown.'
Initial rate is not the mean rate. Numerous answers divided the total decrease in sucrose concentration by 7 minutes.
✔ Gains credit: 'Correct subtraction of values read from the graph (2.5 − 1.85) = 0.65; initial rate of reaction = 1.2 or 1.3.'
A rate needs a unit. Most gave no unit, and many calculated 0.8 ÷ 15 or 1/t.
✔ Gains credit: '0.3 ÷ 75 = 0.004 au s⁻¹ / 0.24 au min⁻¹.'
The tangent goes at time zero. Most knew to draw a tangent but did not draw it at the start of the line.
✔ Gains credit: 'Add a set volume of collagenase to an excess of collagen; determine the gradient of the slope / draw a tangent at time zero.'
Keep the substrate in excess. Few said the substrate should be in excess so the enzyme works at its maximum rate.
✔ Gains credit: 'Substrate concentration should be in excess so that the enzyme works at its maximum rate; concentrations of different enzymes should be the same to allow a comparison.'
45°C is past the optimum. Many said the rate was higher at 45°C than at 30°C because of increased kinetic energy.
✔ Gains credit: 'The rate of reaction is lower at 45°C because it is above the optimum temperature for amylase; some of the enzyme has denatured.'
Download the questions
Download the PDF pack (15 questions, mark schemes at the end)
Keep practising
- Proteins and Enzymes (Topic 2): Edexcel SNAB exam questions by topic
- Edexcel SNAB A level Biology revision resources by topic (every topic and core practical page)
- Edexcel SNAB Topic 2 Multiple-Choice Quiz: Genes and Health
- Edexcel SNAB A level Biology past papers, mark schemes and examiners' reports
- Edexcel SNAB A level Biology grade boundaries
- Message Tom on WhatsApp about one-to-one Edexcel SNAB tutoring or an Edexcel group class
Questions, mark schemes and examiners' report extracts © Pearson Education Ltd.