

Required practicals 10 and 12 are both A-level only, so you'll meet them in Year 13. In practical 10 (AQA 3.6.1.1) you use a choice chamber or a maze to see how an environmental variable, such as light intensity, affects the movement of an animal. In practical 12 (AQA 3.7.4) you investigate how a named environmental factor affects the distribution of a species, using the sampling methods from 3.7.4: random quadrats or a belt transect for plants and slow-moving animals, and mark-release-recapture for animals that move around.
The examiners' reports show where the marks go. Only 6% got full marks for finding mean percentage cover, because most never said how to work out the mean, and 'scale up' on its own never gains the final mark for a population estimate. On mark-release-recapture, students forget to leave time for the animals to spread out, say marks shouldn't 'cause harm' without explaining why, and subtract the samples instead of multiplying them. In choice chambers, they list features without saying how each makes the conclusion valid.
Start with the quadrat and mark-release-recapture methods, then the choice chambers, and finish with the calculation and the chi-squared test. Answer each question on paper before you open the mark scheme. If you'd like help with this topic, my AQA masterclasses run online on Tuesdays at 5.15pm for Year 12 and on Wednesdays or Thursdays at 6.30pm for Year 13.
What you need from GCSE and Year 12
Each question on this page assumes you're secure on these GCSE and Year 12 ideas. If any of them feels shaky, revise it before you start.
- GCSE: using quadrats placed at random to estimate the population size of a common species, and a transect to see how its distribution changes across a habitat.
- GCSE: abiotic factors such as light intensity, temperature, moisture and pH, and biotic factors such as predation, affect where organisms live.
- GCSE: a hypothesis is tested by changing one variable and keeping the others the same; a larger sample gives more representative results.
- Year 12 (AQA 3.4.6): species richness and the index of diversity are worked out from samples, so sampling must be random and the sample large. See the Biodiversity within a community page.
- Year 12 (AQA 3.4.7): quantitative investigations of variation within a species collect data from random samples and calculate a mean and standard deviation. See the Investigating diversity page.
Key terms
These words come up in the questions and mark schemes. Examiners expect you to use them exactly.
- Choice chamber: a container divided into sections with different conditions, such as light intensity, so you can count how many animals move into each.
- Taxis: a directional movement towards or away from a stimulus, such as light.
- Quadrat: a square frame of known area used to sample plants or slow-moving animals.
- Random coordinates: positions on a grid laid over the area, chosen with a random number generator or table, so the quadrats are placed without bias.
- Belt transect: quadrats placed at regular intervals along a line, used to see how a species' distribution changes with an environmental factor.
- Percentage cover: the percentage of a quadrat's area covered by a species; used when individual plants are hard to count.
- Mean number per quadrat: the total count in all the quadrats divided by the number of quadrats; multiply by (area of the habitat ÷ area of one quadrat) for the population.
- Mark-release-recapture: a method for motile animals: capture a sample, mark and release them, wait for them to spread through the population, then take a second sample.
- Population estimate: (number in first sample × number in second sample) ÷ number marked in the second sample.
- Null hypothesis: a statement that there is no difference or no effect, for example that light intensity has no effect on the distribution of shrimps.
- Chi-squared test: a statistical test for categoric data that tests whether there is a significant difference between observed and expected results.
What these questions cover (AQA required practicals 10 and 12)
The questions come from the tenth and twelfth required practicals in the AQA A-level Biology specification (7402), and the sampling methods in section 3.7.4, and test these statements and practical skills:
- Required practical 10: Investigation into the effect of an environmental variable on the movement of an animal using either a choice chamber or a maze (both choice chamber questions test animals' responses to light; no available part uses a maze)
- Required practical 12: Investigation into the effect of a named environmental factor on the distribution of a given species (no available written part asks about the effect of a named environmental factor on a species' distribution, for example along a belt transect, so the quadrat questions here are the sampling skills that practical relies on)
- AT k use sampling techniques in fieldwork
- Quadrats (3.7.4): randomly placed quadrats, or quadrats along a belt transect, for slow-moving or non-motile organisms
- Mark-release-recapture (3.7.4): the mark-release-recapture method for motile organisms. The assumptions made when using the mark-release-recapture method.
- Population size calculation (3.7.4): use given data to calculate the size of a population estimated using the mark-release-recapture method.
- PS 2.4 Identify variables including those that must be controlled
- PS 2.1 Comment on experimental design and evaluate scientific methods
- MS 1.9 Select and use a statistical test
How to use this page
Write your answer on paper before you open the mark scheme. Allow about 1.3 minutes per mark: the 11 questions are worth 29 marks, so about 38 minutes in total. Then mark your answer strictly against the mark scheme and read the examiners' tip underneath it. If you'd rather print the questions, download the PDF pack.
Quadrats and percentage cover
Question 1
A level Paper 2 · June 2024 · Q05.1 · 5 marks · Easy
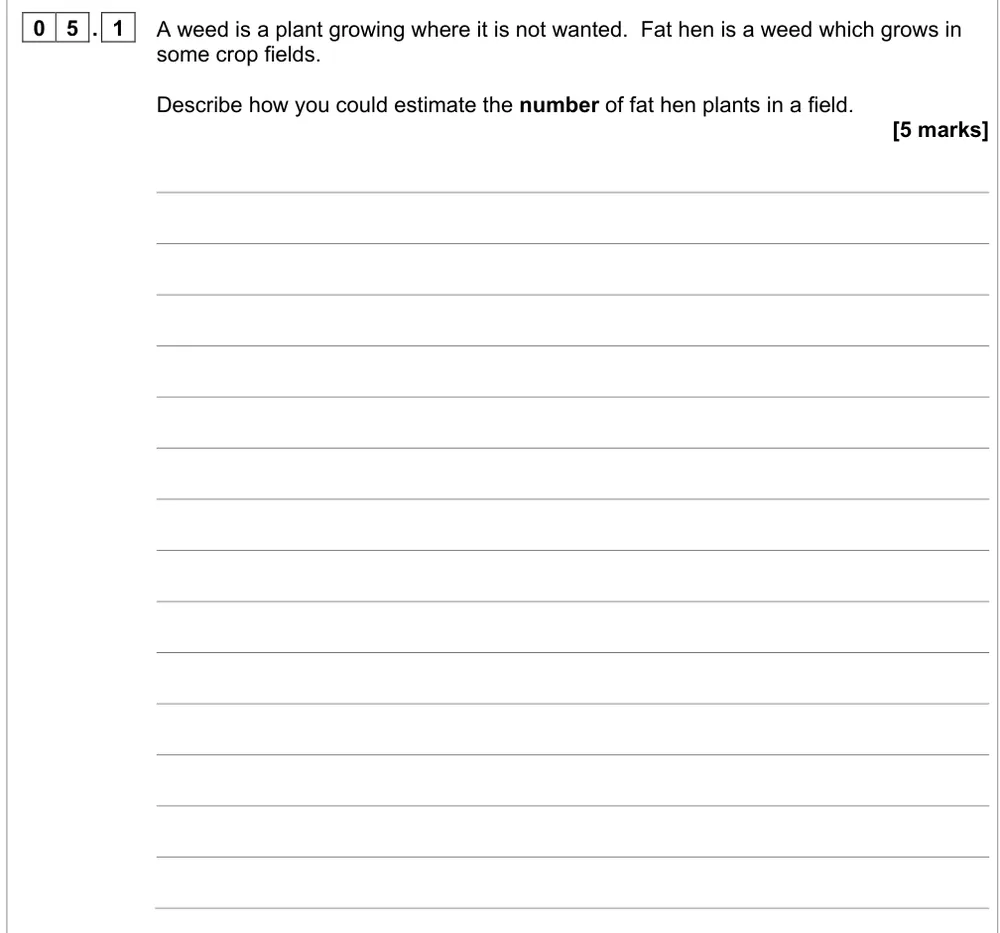
Describe how to estimate the number of fat hen plants in a field.
Show the mark scheme
Tap an image to open it full size.
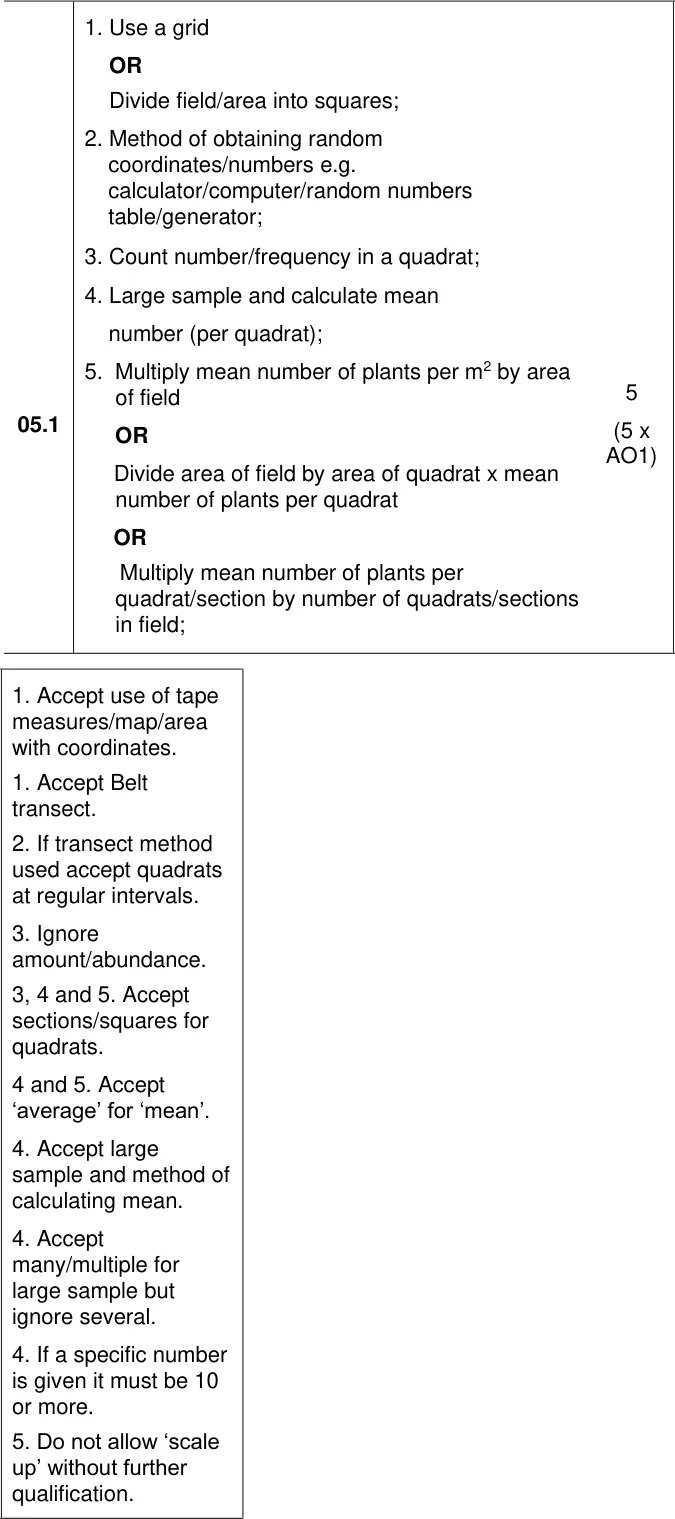
From the examiners' report: About 24% got all five and 97% at least one. Say how you get random coordinates, use 10 or more quadrats, and finish with the sum: field area ÷ quadrat area × mean per quadrat.
Question 2
A level Paper 2 · November 2021 · Q09.1 · 3 marks · Hard
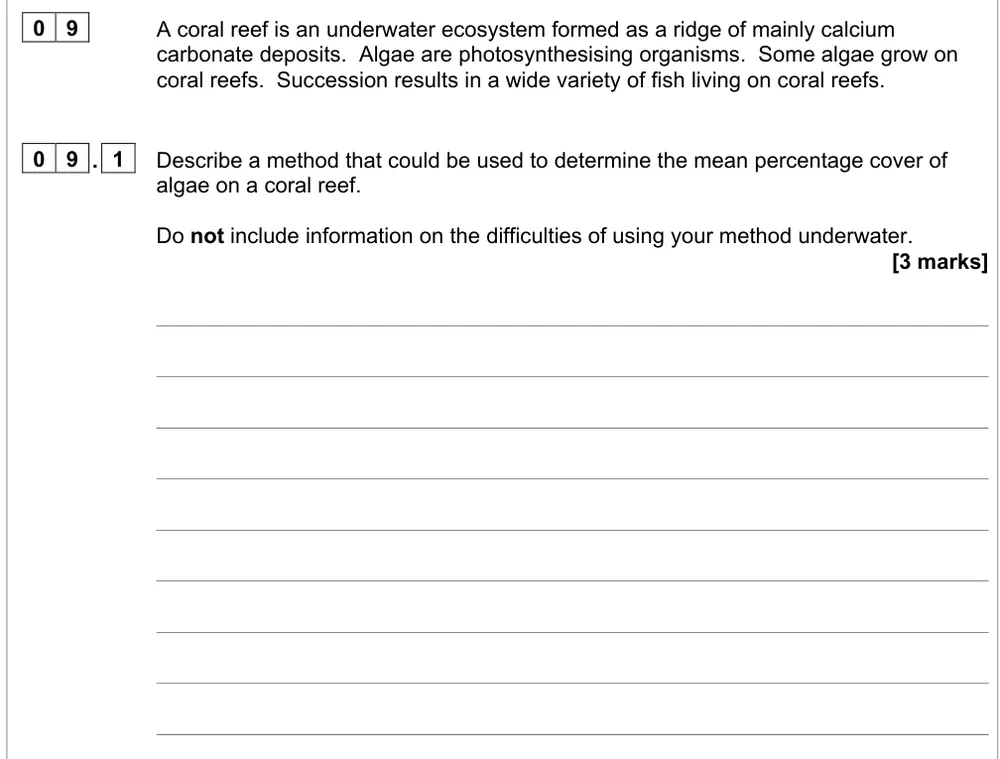
Describe a method to find the mean percentage cover of algae on a coral reef.
Show the mark scheme
Tap an image to open it full size.
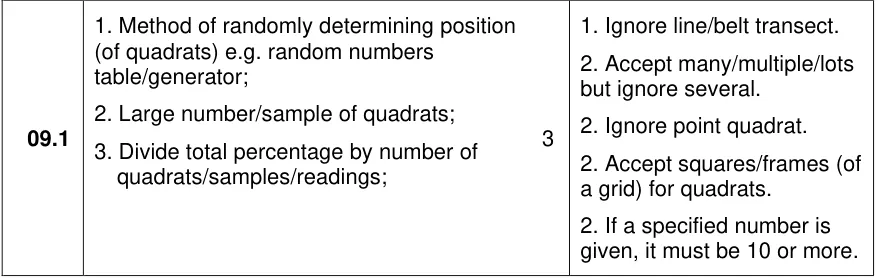
From the examiners' report: 63% got at least one mark but only 6% all three. Give a method for random positions, not just 'randomly', use many quadrats, and divide the total percentage cover by the number of quadrats.
Mark-release-recapture
Question 3
A level Paper 2 · November 2021 · Q10.4 · 4 marks · Medium
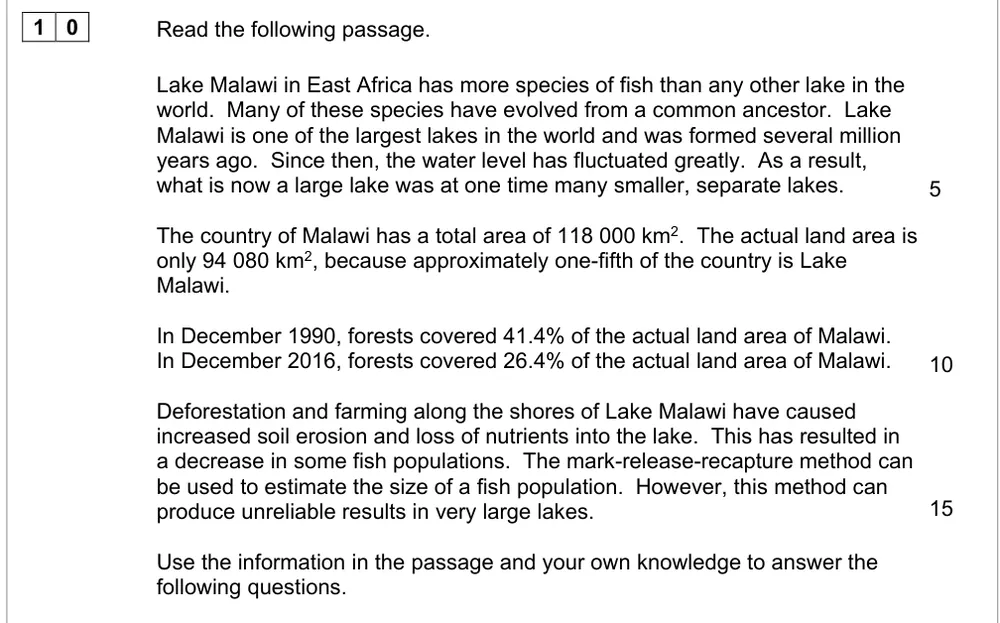
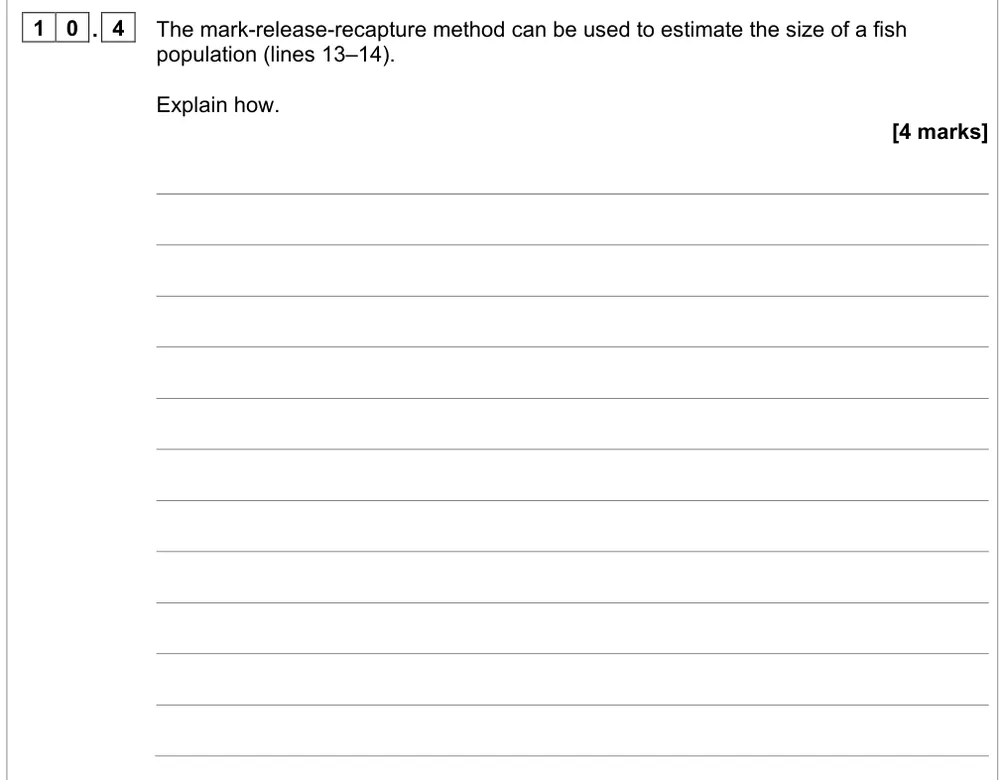
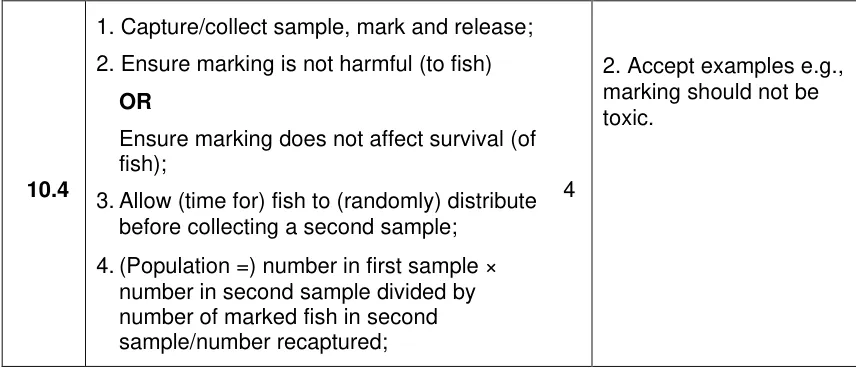
Explain how the mark-release-recapture method estimates the size of a fish population.
Information from earlier in this question:
Show the mark scheme
Tap an image to open it full size.
From the examiners' report: Four in five got at least one mark and 15% all four. Don't forget 'release' and the time to spread out. Most lost the last mark on the formula: multiply the two samples and divide by the marked ones.
Question 4
A level Paper 2 · June 2024 · Q10.5 · 3 marks · Hard
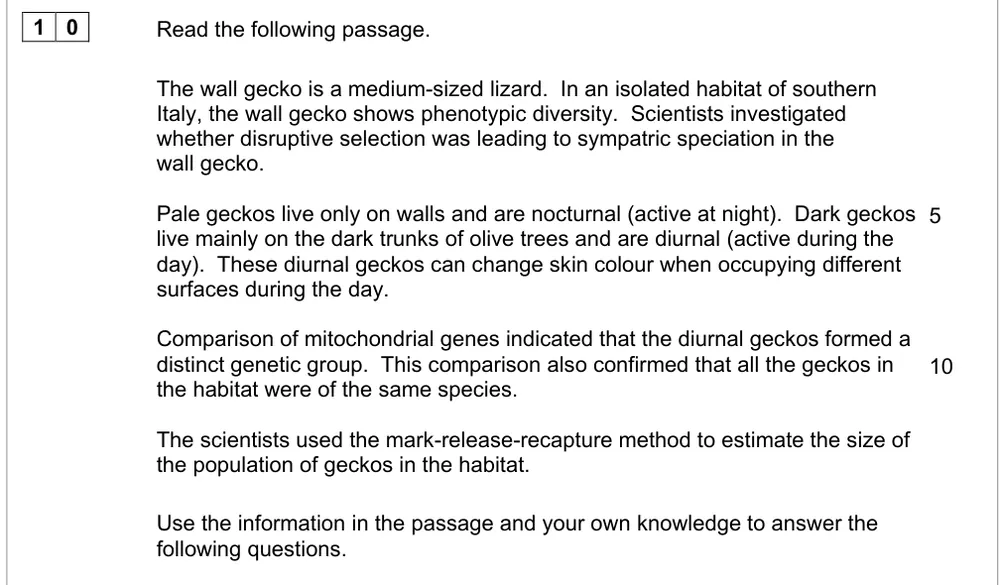
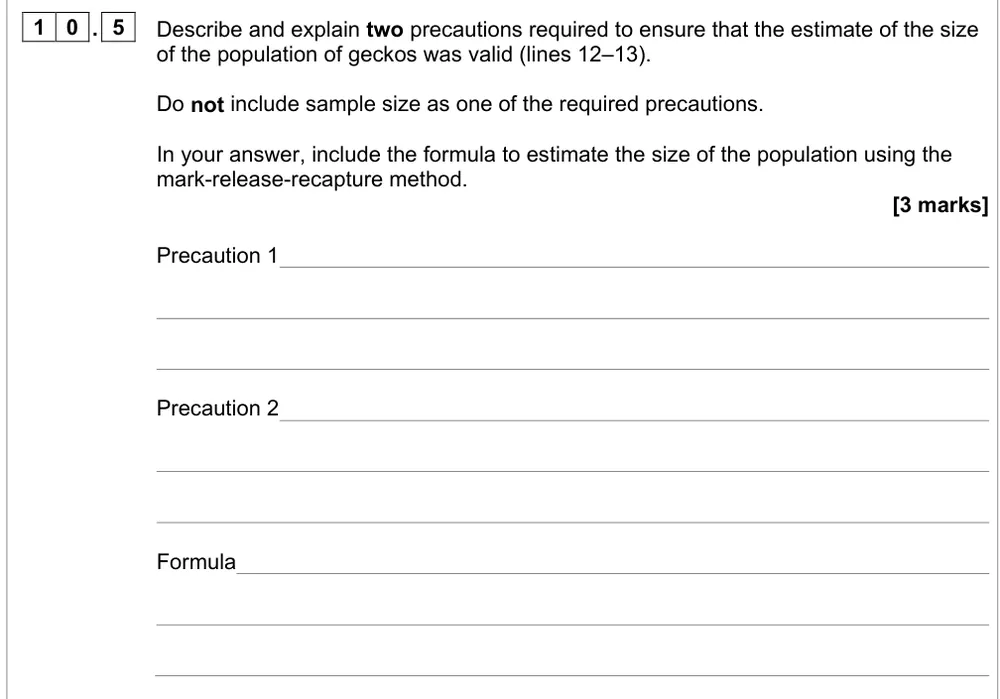
Describe and explain two precautions for a valid mark-release-recapture estimate of geckos, and give the formula.
Information from earlier in this question:
Show the mark scheme
Tap an image to open it full size.
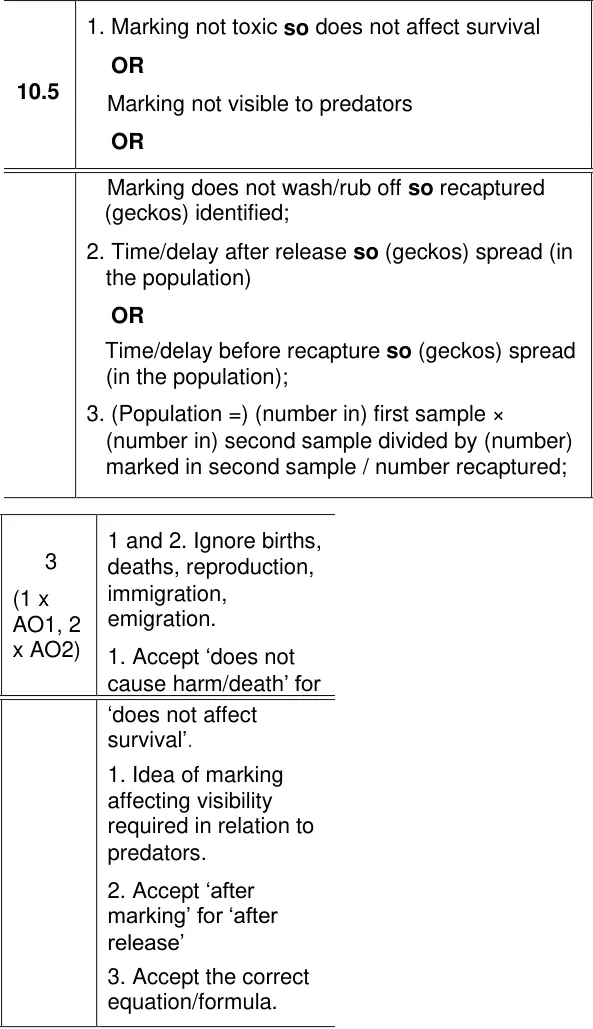
From the examiners' report: About 62% got at least one mark but only 7% all three. Explain each precaution: the mark mustn't rub off so recaptured geckos are identified. Many subtracted the samples instead of multiplying.
Question 5
A level Paper 2 · November 2021 · Q10.5 · 1 mark
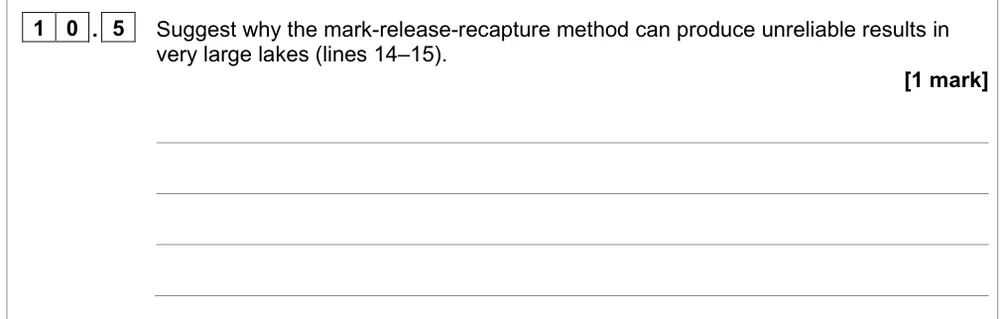
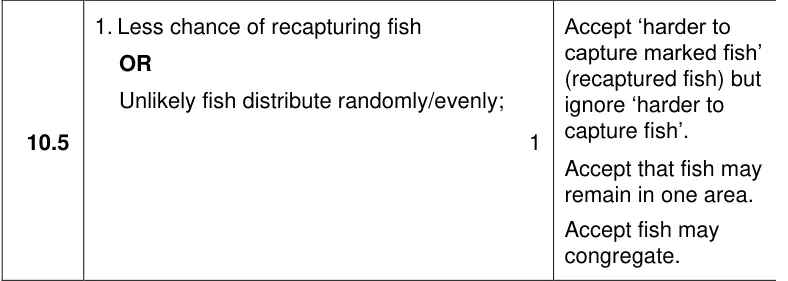
Suggest why mark-release-recapture gives unreliable results in very large lakes.
Information from earlier in this question:
Show the mark scheme
Tap an image to open it full size.
From the examiners' report: About one in four got it. Stick to the large lake: marked fish are less likely to be recaptured, or won't mix evenly. Marks washing off, births and deaths, and migration didn't score.
Question 6
A level Paper 3 · June 2025 · Q03.2 · 3 marks · Easy
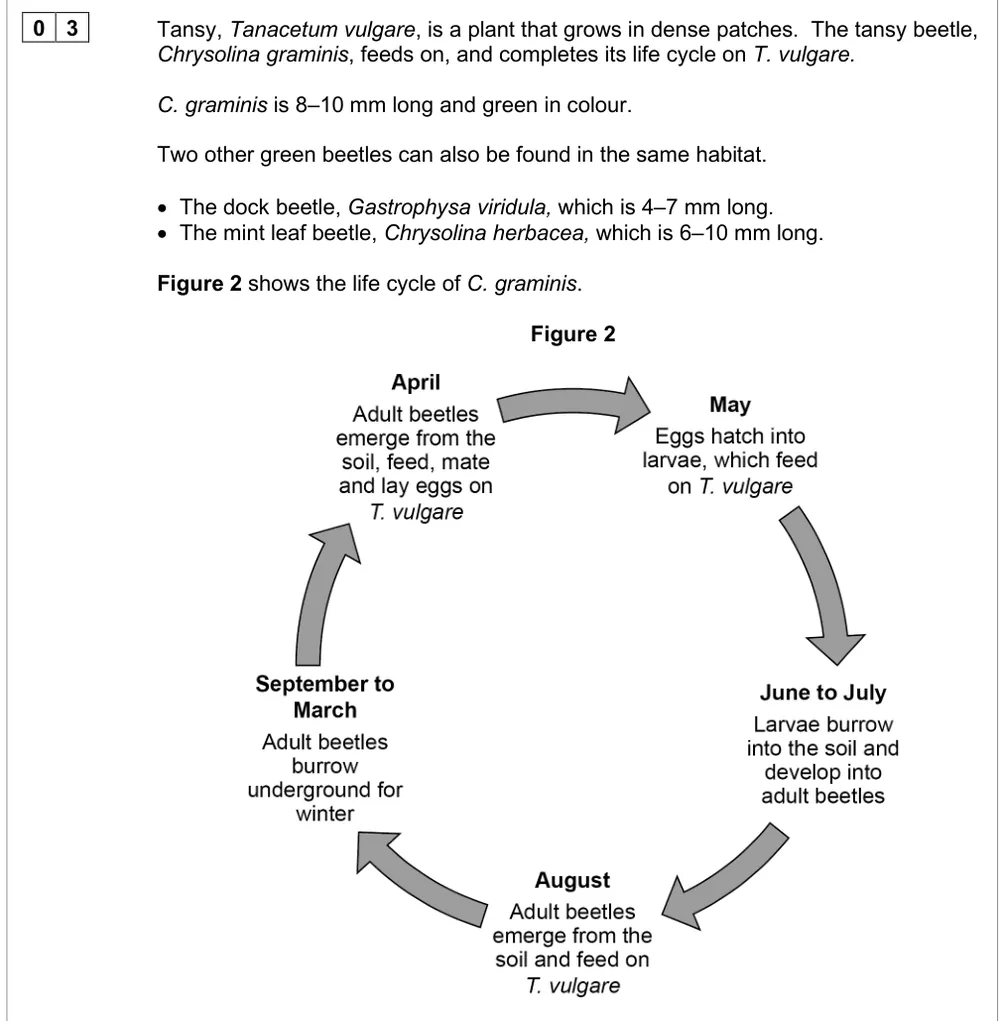
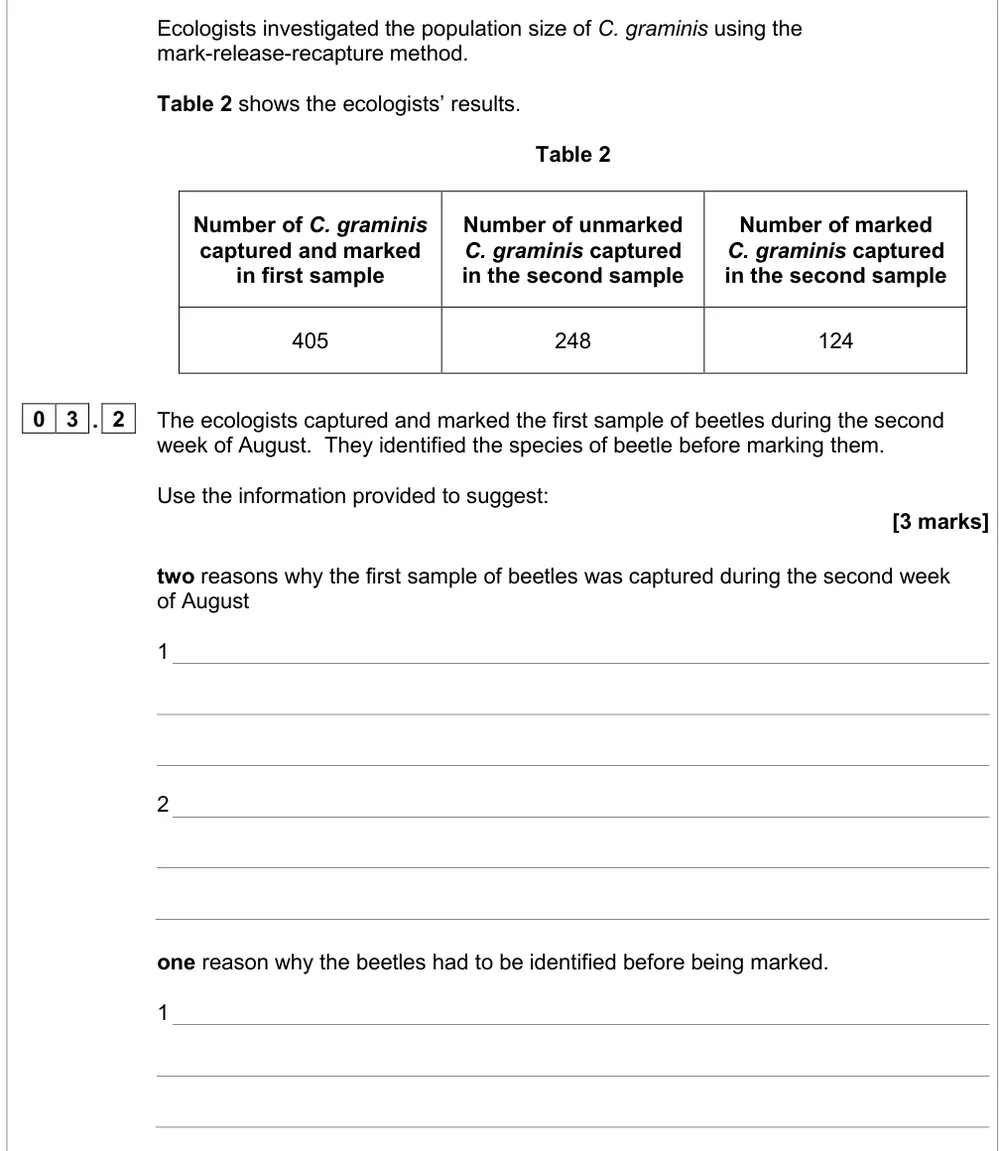
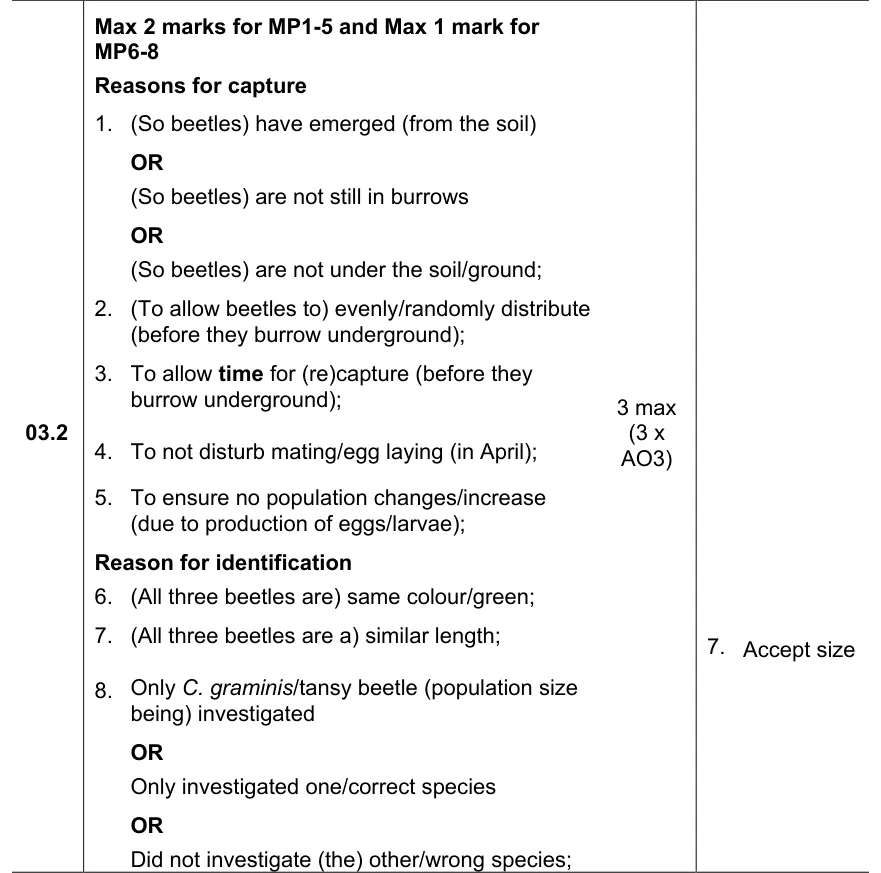
Use the tansy beetle's life cycle to explain the timing of the first sample and why beetles were identified first.
Information from earlier in this question:
Show the mark scheme
Tap an image to open it full size.
From the examiners' report: About 75% got at least 2 marks, but few found a second reason for August. Use the life cycle: adults are above ground, and there's time to mix and be recaptured before they burrow.
Question 7
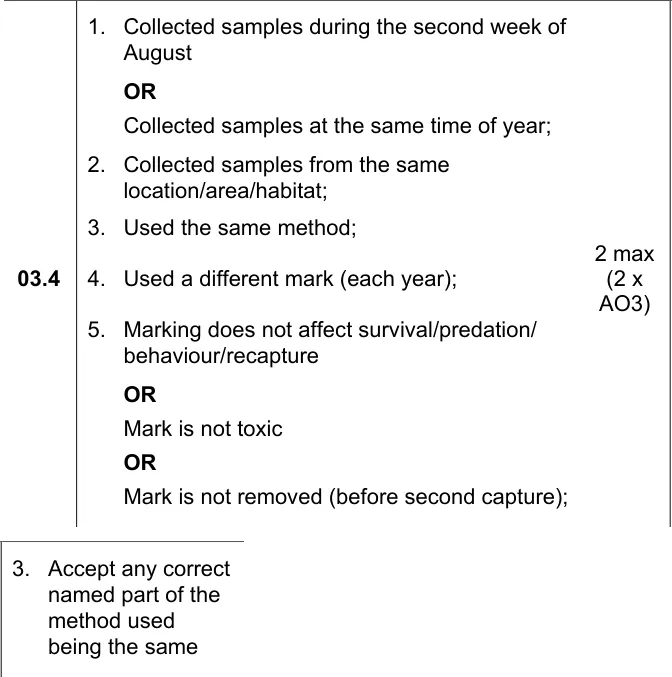
A level Paper 3 · June 2025 · Q03.4 · 2 marks · Easy
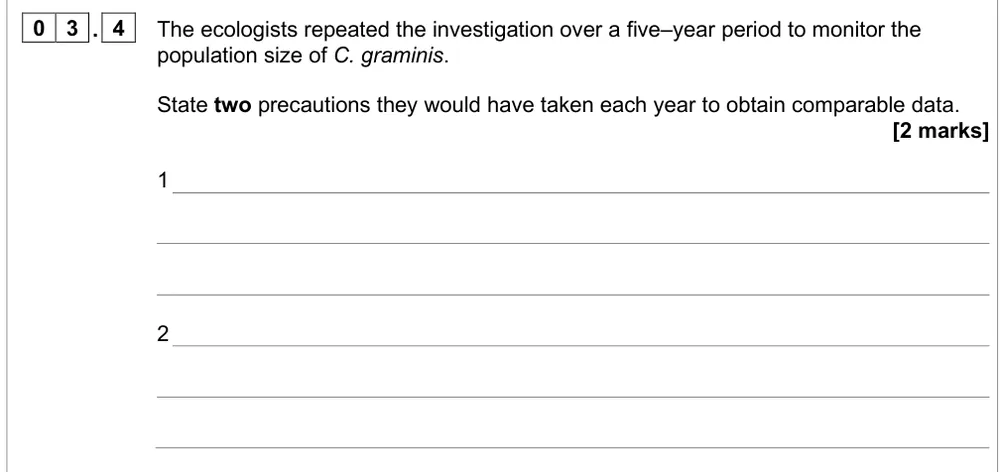
State two precautions to get comparable tansy beetle data each year over five years.
Show the mark scheme
Tap an image to open it full size.
From the examiners' report: About half got both. Think about repeating the study fairly: same time of year, same place, same method. 'No migration' or keeping the population the same didn't score.
Choice chambers (required practical 10)
Question 8
A level Paper 2 · June 2025 · Q07.1 · 3 marks · Medium
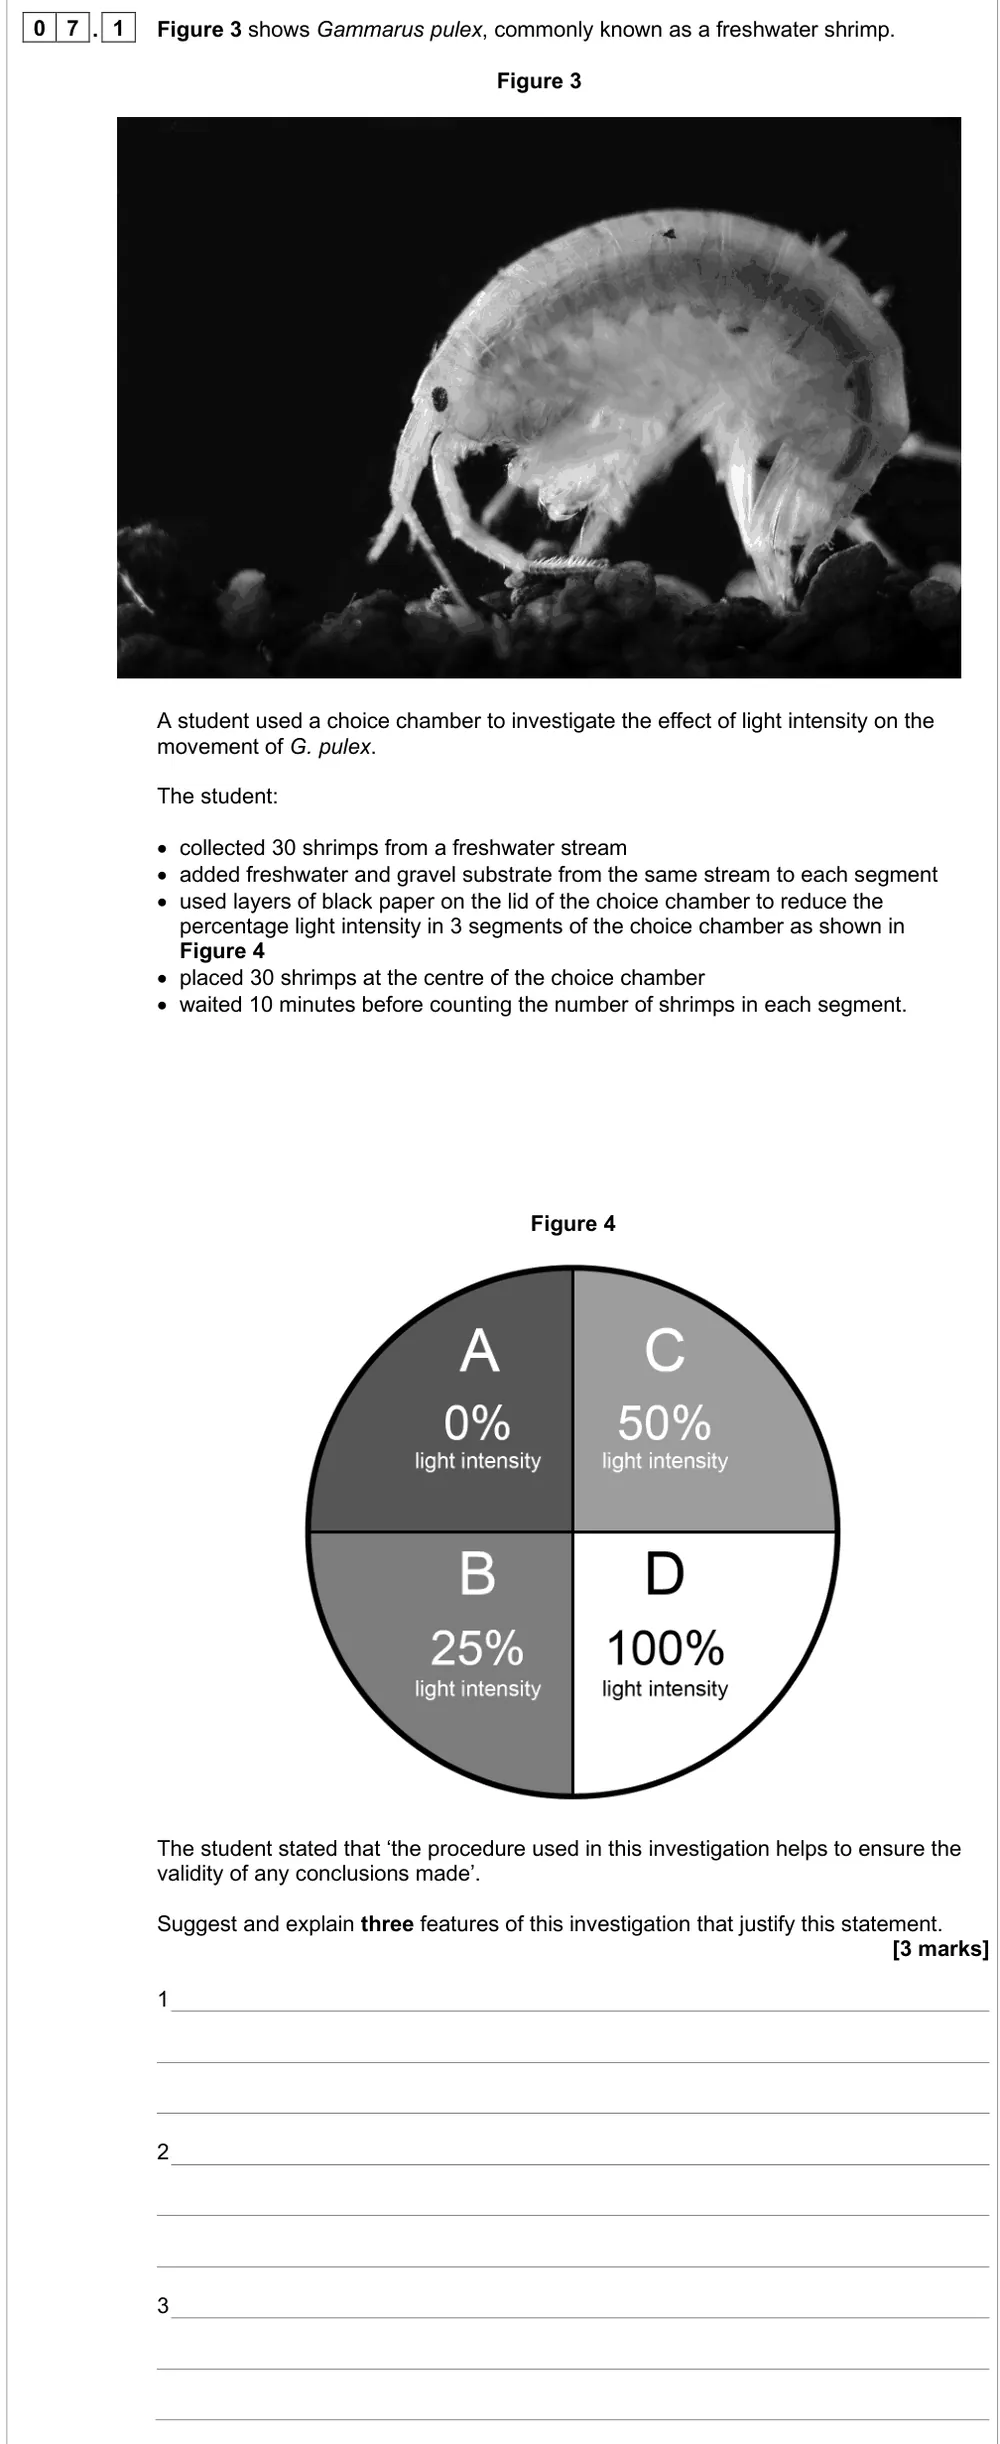
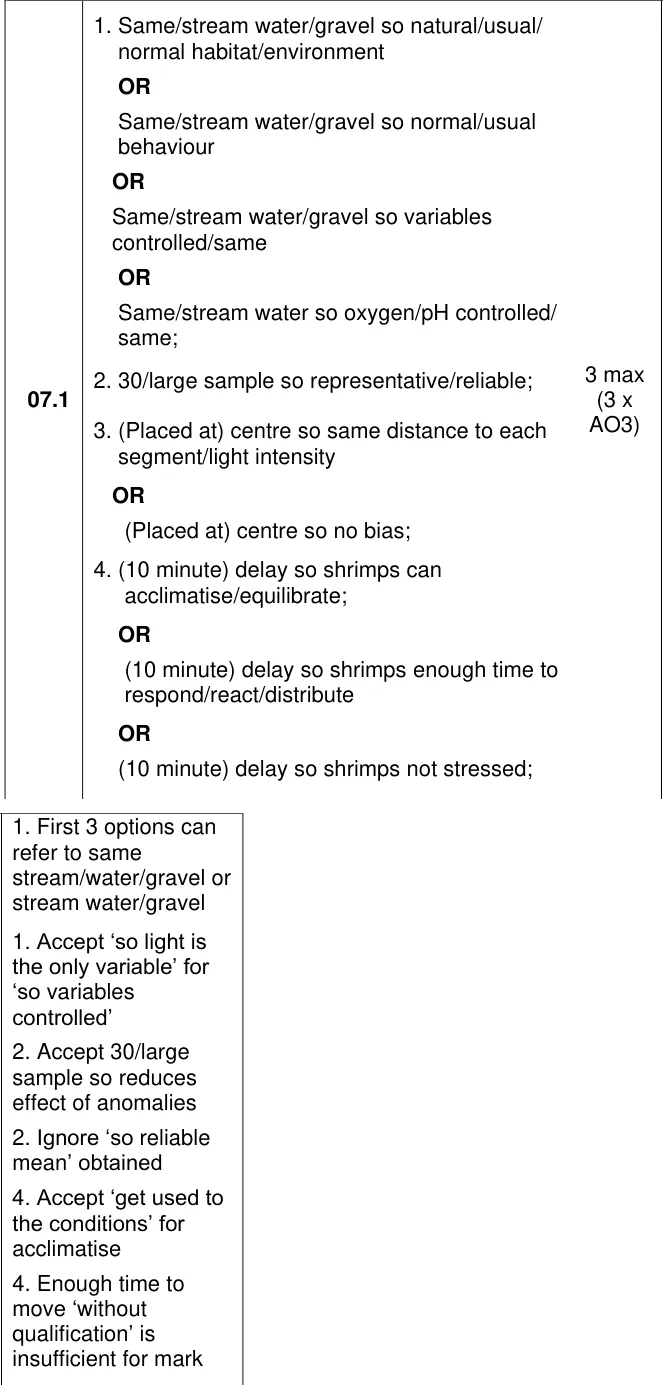
Suggest and explain three features of a choice chamber investigation with freshwater shrimps that make its conclusions valid.
Show the mark scheme
Tap an image to open it full size.
From the examiners' report: About 20% got all three and 85% at least one. Explain each feature: centre so no bias, 30 shrimps so representative, and 10 minutes to acclimatise. 'Time to move' wasn't enough.
Question 9
A level Paper 3 · June 2019 · Q05.2 · 1 mark · Hard
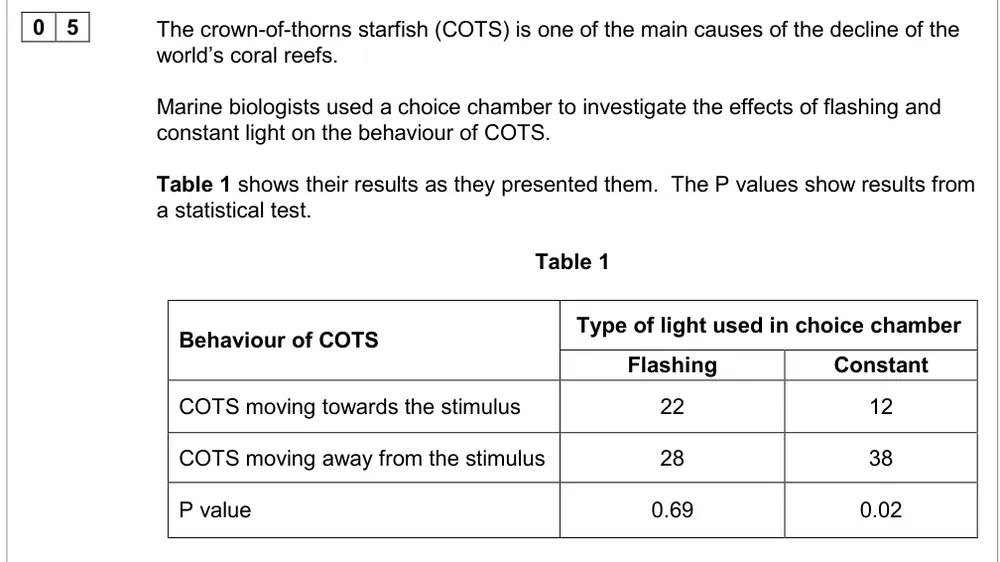
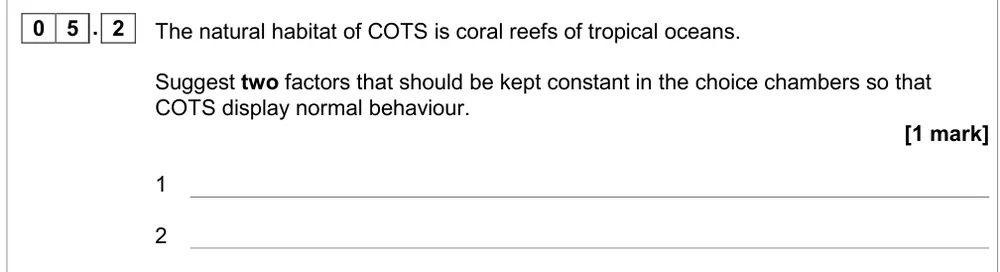
Suggest two factors to keep constant in choice chambers so crown-of-thorns starfish behave normally.
Information from earlier in this question:
Show the mark scheme
Tap an image to open it full size.
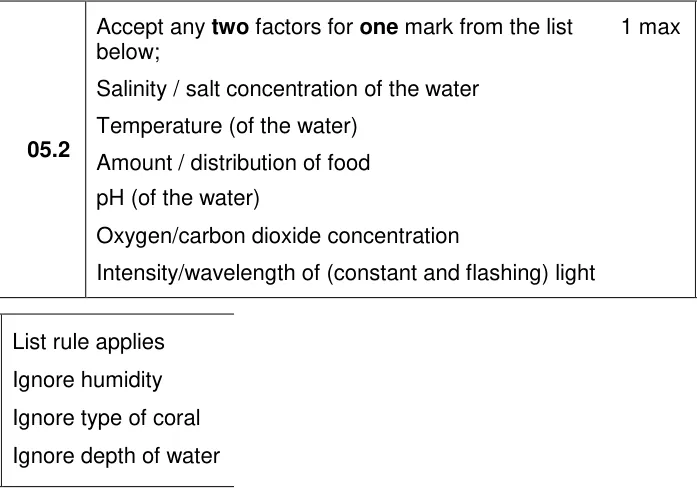
From the examiners' report: Just over half got it. This is a lab choice chamber, not the reef, so give abiotic factors you can control, such as water temperature, pH or salinity, not 'a reef' or 'type of coral'.
Calculations and statistics
Question 10
A level Paper 3 · June 2025 · Q03.3 · 2 marks · Medium
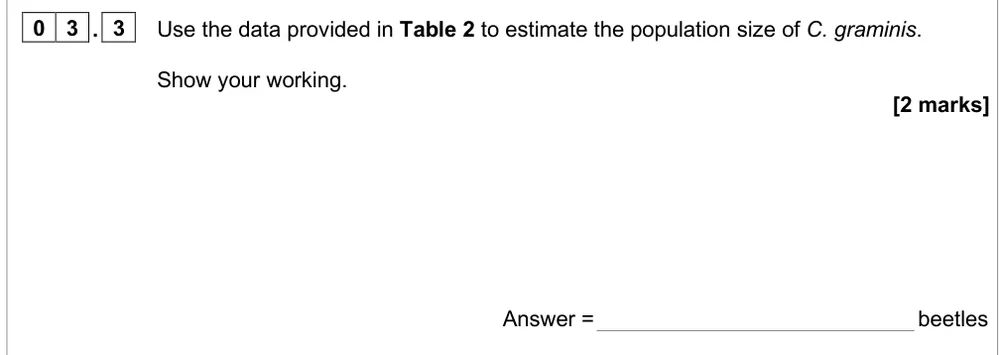
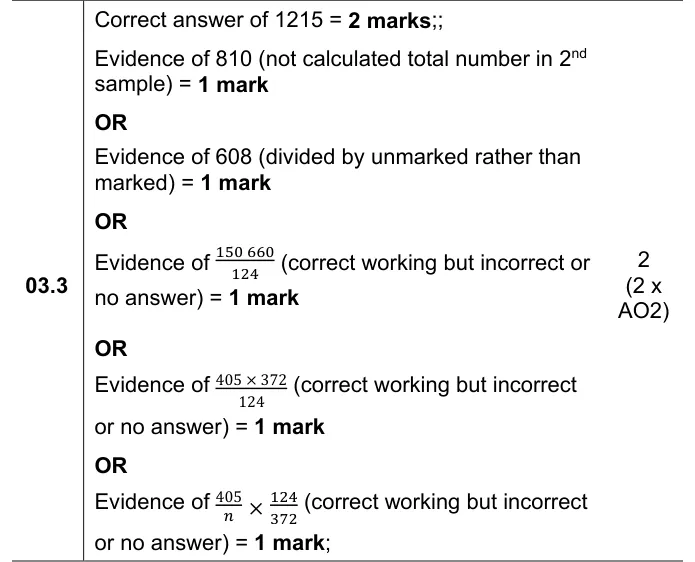
Estimate the tansy beetle population from mark-release-recapture results.
Information from earlier in this question:
Show the mark scheme
Tap an image to open it full size.
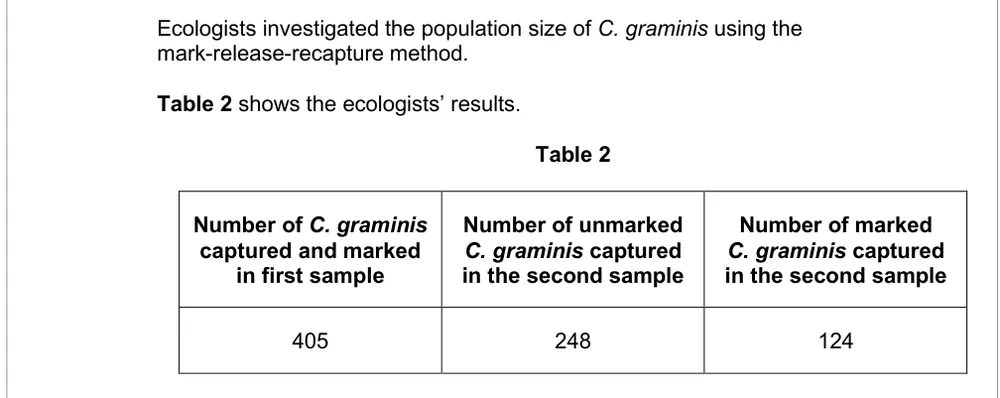
From the examiners' report: Just under a third got both marks. The second sample is 248 + 124 = 372 beetles, so 405 × 372 ÷ 124. Using only the 248 unmarked gives the common wrong answer, 810.
Question 11
A level Paper 2 · June 2025 · Q07.3 · 2 marks · Medium
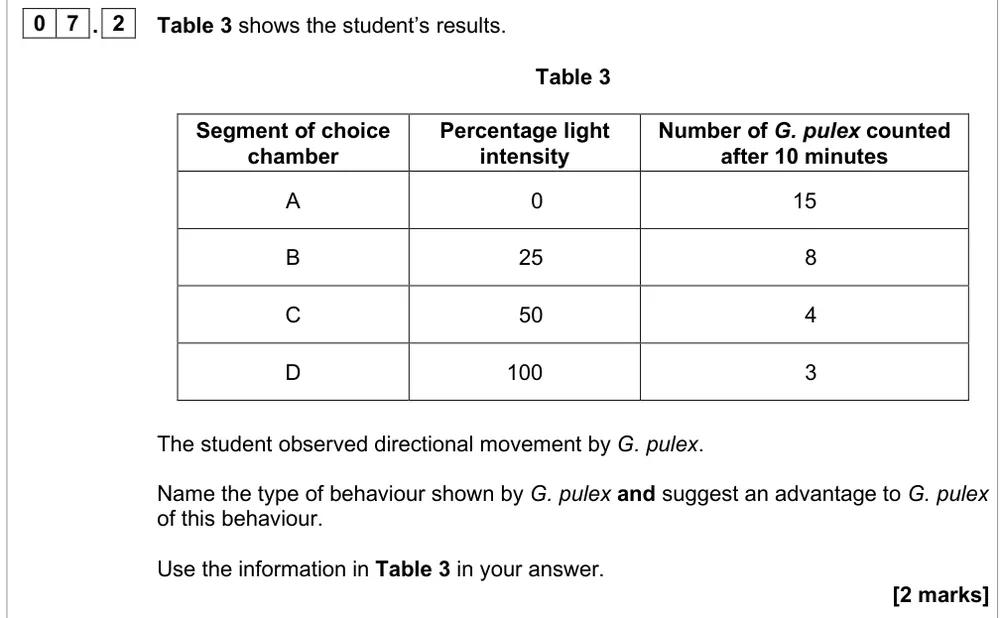
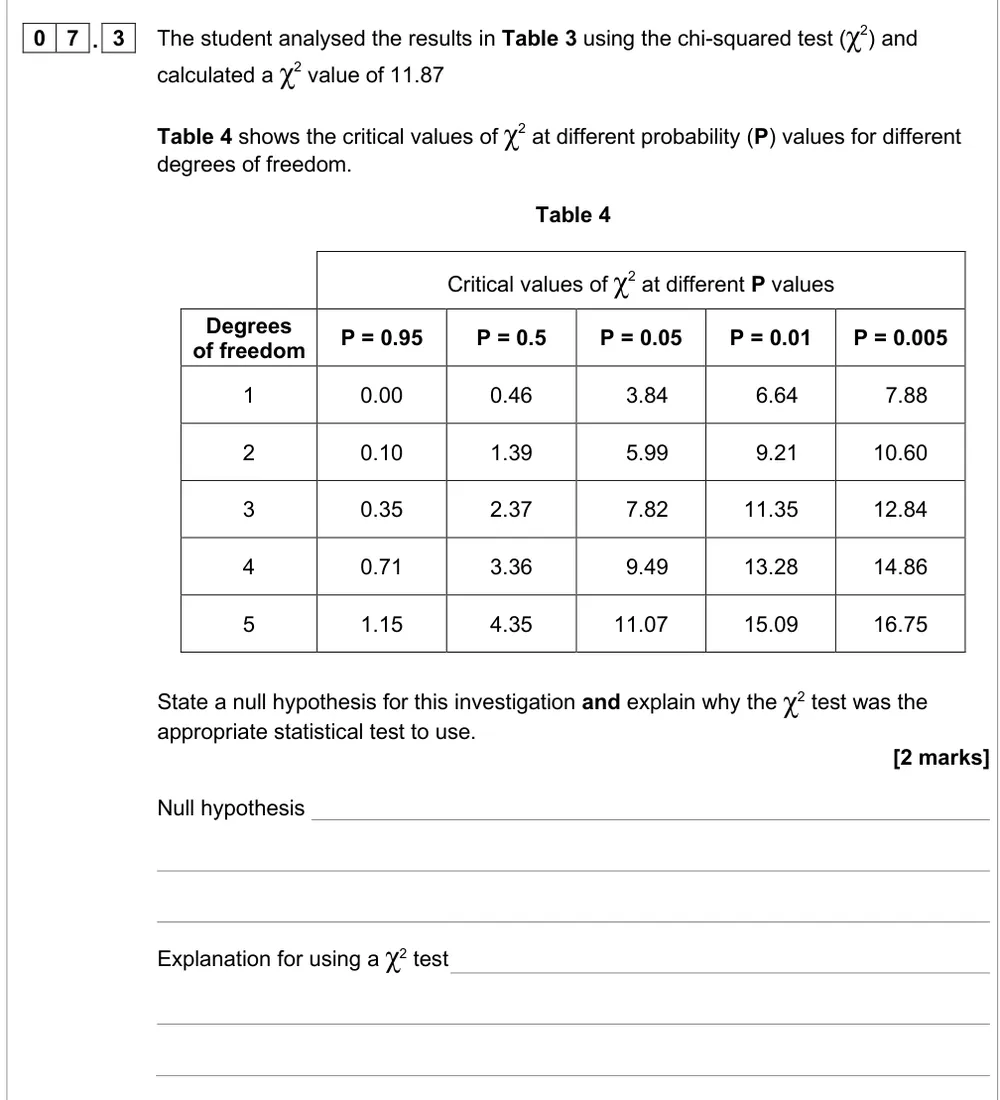
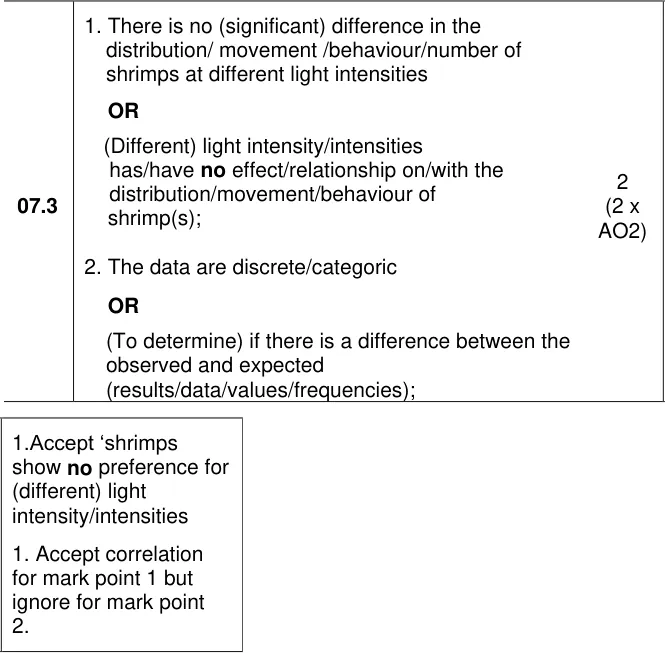
State a null hypothesis for the shrimp choice chamber and explain why chi-squared was the right test.
Information from earlier in this question:
Show the mark scheme
Tap an image to open it full size.
From the examiners' report: About 35% got both marks. Put light intensity in the null hypothesis, then say the data are categoric, or that the test compares observed and expected results. Correlation and comparing means are wrong.
Where students lose marks (from AQA examiners' reports and mark schemes)
Each point below is followed by wording that gained marks.
Percentage cover, then divide by the number of quadrats: Only 6% got all three marks for the mean percentage cover of algae. Most never said how to calculate the mean; many counted algae or species instead of estimating percentage cover, or used one quadrat for the whole reef.
✔ Gains credit: "Method of randomly determining position (of quadrats) e.g. random numbers table/generator"; "Large number/sample of quadrats"; "Divide total percentage by number of quadrats/samples/readings."
Scale up with the area of the quadrat: About 24% got all five marks for estimating the number of fat hen plants. The final step was the hardest: 'scale up' wasn't credited without saying how, and some left out the area of the quadrat.
✔ Gains credit: "Divide area of field by area of quadrat x mean number of plants per quadrat" or "Multiply mean number of plants per m² by area of field."
Release them, then give them time to spread out: Students often left out releasing the animals, and most failed to say time was needed for them to disperse before the second sample. Re-joining the population on its own wasn't enough.
✔ Gains credit: "Capture/collect sample, mark and release"; "Allow (time for) fish to (randomly) distribute before collecting a second sample."
Multiply the two samples; never subtract them: Many couldn't give the formula. Common errors were subtracting the second sample from the first, adding the samples, multiplying by 100, or dividing by the whole second sample instead of the marked animals in it.
✔ Gains credit: "(Population =) number in first sample × number in second sample divided by number of marked in second sample/number recaptured."
Explain why the mark mustn't harm or rub off: About 7% got all three marks on the gecko precautions. 'Marking should not cause harm' or 'the mark should not rub off' wasn't credited unless the answer said why that matters.
✔ Gains credit: "Marking not toxic so does not affect survival OR Marking not visible to predators OR Marking does not wash/rub off so recaptured (geckos) identified."
The second sample is marked plus unmarked: Just under a third got both marks for the tansy beetle estimate. The most common wrong answer, 810, used only the 248 unmarked beetles instead of adding the 124 marked ones to give 372 in the second sample.
✔ Gains credit: "Correct answer of 1215 = 2 marks" (405 × 372 ÷ 124).
Say how each choice chamber feature makes it valid: About 20% got all three marks. Some listed features without explaining them, few explained putting the shrimps in the centre, and 'time to move' didn't score.
✔ Gains credit: "30/large sample so representative/reliable"; "(Placed at) centre so same distance to each segment/light intensity OR so no bias"; "(10 minute) delay so shrimps can acclimatise/equilibrate."
Chi-squared, because the data are categoric: About 35% got both marks. Null hypotheses without light intensity didn't score, and wrong reasons for the test referred to correlation or comparing means.
✔ Gains credit: "(Different) light intensity/intensities has/have no effect … on the distribution/movement/behaviour of shrimp(s)"; "The data are discrete/categoric OR (To determine) if there is a difference between the observed and expected (results)."
Download the questions
Download the PDF pack (11 questions, mark schemes at the end)
Keep practising
- Survival and Response: AQA A Level Biology exam questions by topic
- AQA 3.7.4 populations in ecosystems: self-marking quiz
- Biodiversity within a community: AQA A Level Biology exam questions by topic
- Handling data (MS 1): AQA A Level Biology exam questions by topic
- Required Practical 9, Respiration Rate: AQA A Level Biology exam questions by topic
- AQA A Level Biology masterclasses
Questions, mark schemes and examiners' report extracts © AQA.