

Paper 5: Planning an Investigation: Cambridge (CIE) A Level Biology 9700 Exam Questions
Planning an investigation is the first part of Paper 5, Planning, Analysis and Evaluation, in the Cambridge International AS & A Level Biology syllabus (9700). Paper 5 is a written A level paper worth 30 marks. The syllabus calls these skills defining the problem and methods. You need to identify the independent and dependent variables, make a prediction in words or as a sketch graph, and decide which variables to standardise. You also need to describe control experiments, show how to make up a range of concentrations by dilution, write a method in a logical order that another person could follow, and give a simple risk assessment.
The examiners' reports make the same points every year. Name a variable in a word or a phrase, not a sentence, and give the number of answers the question asks for, not a list. A control experiment is not the same as a control variable. In a dilution, give the volumes with their units. In a method, say how each variable is kept the same, use at least five values of the independent variable, repeat and calculate a mean, not an 'average', and match each safety precaution to its hazard and risk.
Studying Cambridge International A level Biology and want more help? Tom teaches CIE students one-to-one online, including students in the UAE, Saudi Arabia, Hong Kong, India and Indonesia, and every lesson is recorded. You can book a one-to-one lesson or a free 15-minute discovery chat, or register your interest in a CIE group class starting in September 2027, using the links at the bottom of this page.
What you need before you start
Each question on this page assumes you're secure on these ideas. If any of them feels shaky, look it up before you start.
- The independent variable is the one you change, and the dependent variable is the one you measure.
- Other variables that could affect the results are kept the same, so that the comparison is valid.
- Repeat measurements are used to calculate a mean.
- A quadrat is used to sample plants and other organisms that do not move; a transect is a line along which samples are taken.
Key terms
These words come up in the questions and mark schemes. Examiners expect you to use them exactly.
- Independent variable: the variable that is changed or selected by the person doing the investigation.
- Dependent variable: the variable that is measured for each value of the independent variable.
- Standardised variable: a variable that is kept the same so that it does not affect the results.
- Control experiment: a set of conditions that gives results to compare with the others, to check that the results are caused by the factor being investigated.
- Proportional dilution: making a range of concentrations by mixing different volumes of a stock solution and distilled water to the same final volume.
- Calibration curve: a graph of the readings for solutions of known concentration, used to find the concentration of an unknown sample.
- Belt transect: a line along which quadrats are placed, used to show how the distribution of species changes.
- Risk assessment: naming a hazard, the risk linked to it and the precaution that reduces that risk.
What these questions cover (Cambridge 9700 Paper 5)
The questions test these Paper 5 skills (Planning, analysis and evaluation) from the Cambridge International AS & A Level Biology syllabus (9700) for 2025 to 2027. The syllabus expects you to be able to:
- Defining the problem (P5 1): state a relevant prediction, either in words or in the form of a sketch graph showing the expected result, and link this to an underlying hypothesis; identify the independent and dependent variables; identify which key variables must be standardised in order to test a hypothesis
- Methods (P5 2): describe how to vary the independent variable; describe how to standardise each of the other key variables; describe how different concentrations would be prepared by serial dilution or proportional dilution; describe appropriate control experiments; describe, in a logical sequence, the steps involved in the procedure, including how to use the apparatus to collect results; prepare a simple risk assessment of their plans, taking into account the severity of any hazards and the probability that a problem could occur
How to use this page
Write your answer on paper before you open the mark scheme. Allow about 1.2 minutes per mark: the 22 questions are worth 58 marks, so about 70 minutes in total. Then mark your answer strictly against the mark scheme and read the examiners' tip underneath it. If you'd rather print the questions, download the PDF pack.
Identifying variables (P5 1)
Question 1
Paper 5 · May/June 2024 (52) · Q1(a)(i) · 1 mark · Easy
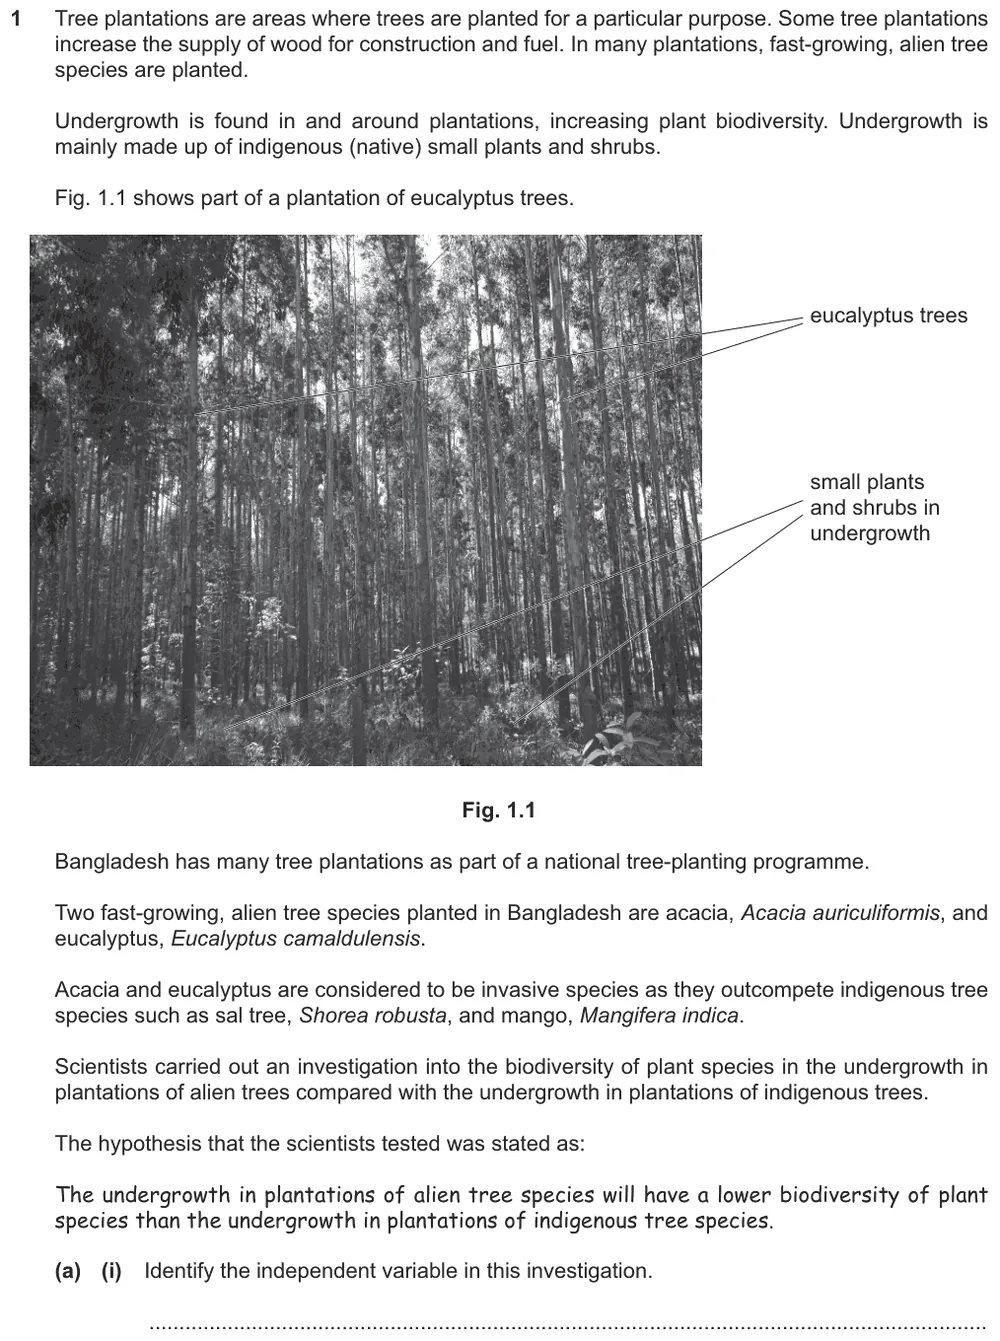
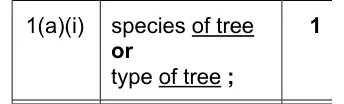
Identify the independent variable in an investigation of plant biodiversity in tree plantations.
Show the mark scheme
Tap an image to open it full size.
From the examiners' report: Name the variable itself: the species or type of tree. A full sentence beginning 'The undergrowth' made the undergrowth the independent variable and could not gain credit. 'Alien species' or 'indigenous species' needed a reference to trees.
Question 2
Paper 5 · February/March 2025 (52) · Q3(a) · 2 marks · Hard
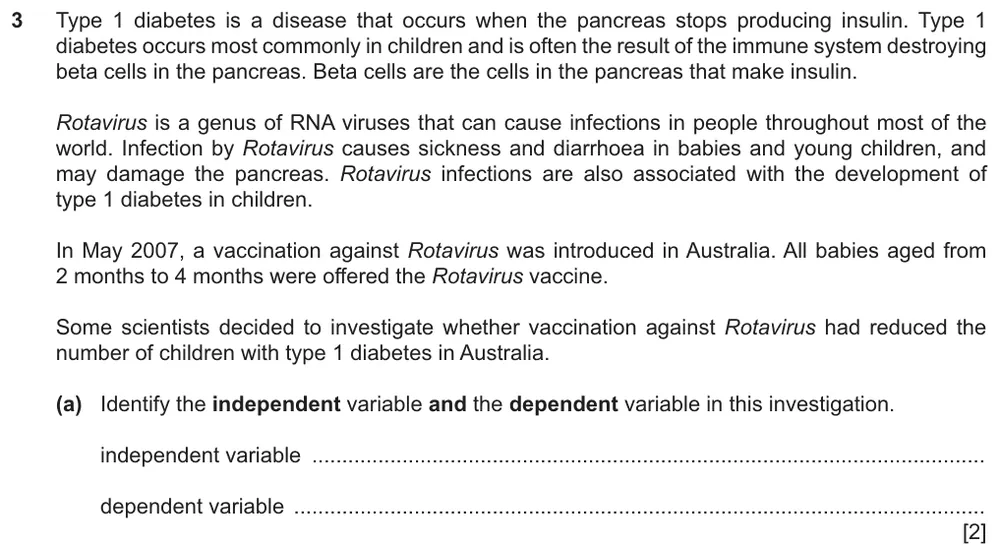
Identify the independent variable and the dependent variable in a study of the Rotavirus vaccine and type 1 diabetes.
Show the mark scheme

Tap an image to open it full size.
From the examiners' report: Many students found the independent variable hard to express. 'Vaccination against Rotavirus' was too vague: write 'vaccination status' or 'whether the vaccine was given'.
Question 3
Paper 5 · February/March 2023 (52) · Q2(a)(i) · 1 mark · Easy
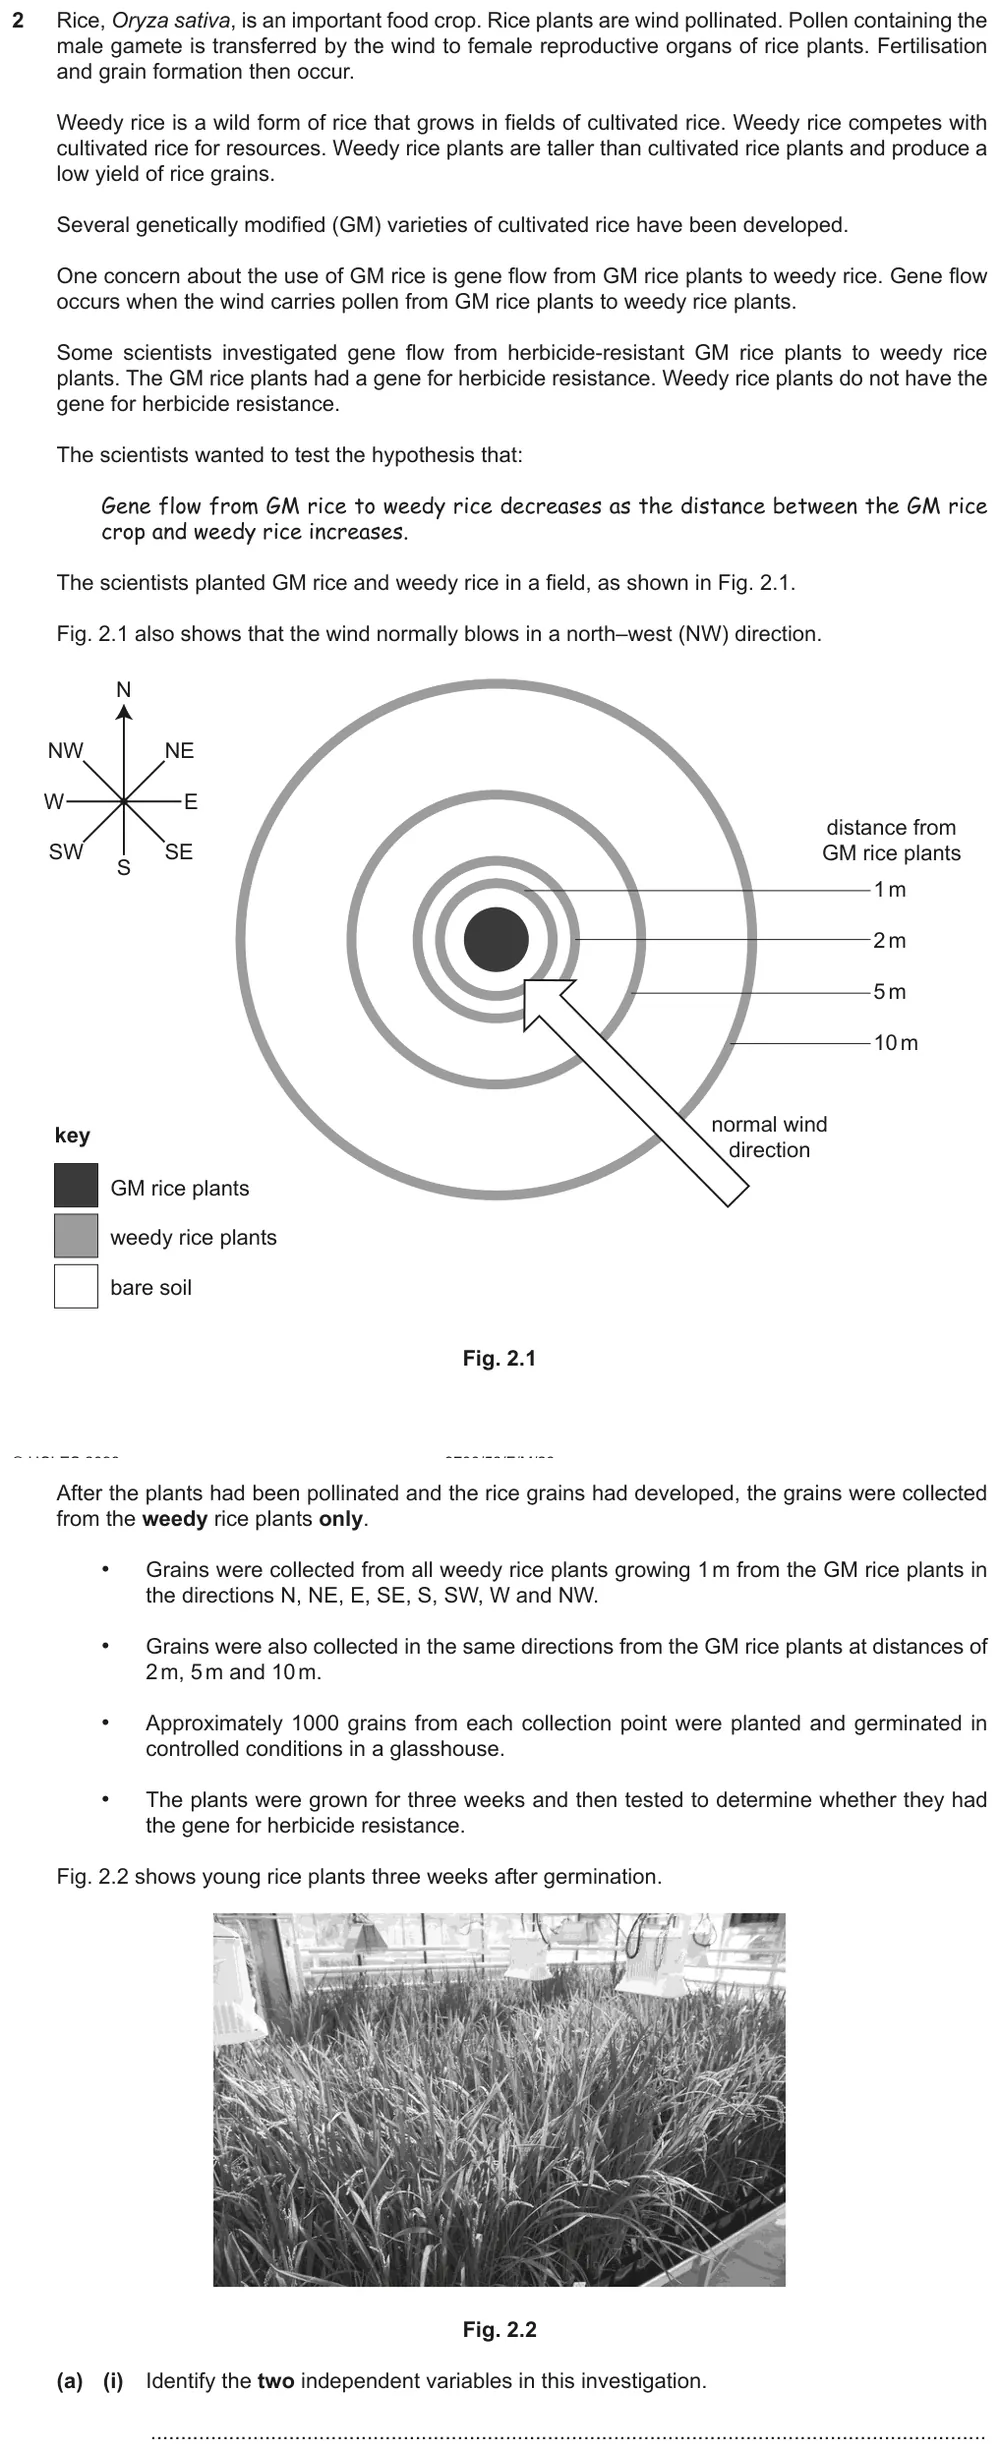
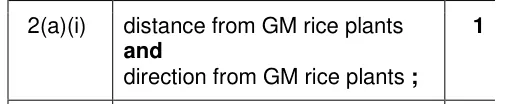
Identify the two independent variables in an investigation of gene flow from GM rice plants.
Show the mark scheme
Tap an image to open it full size.
From the examiners' report: Most students gave the distance from the GM rice plants, but few gave the direction from them. Wind direction is not an independent variable here, because it was not manipulated or changed.
Question 4
Paper 5 · May/June 2022 (52) · Q1(a)(i) · 1 mark
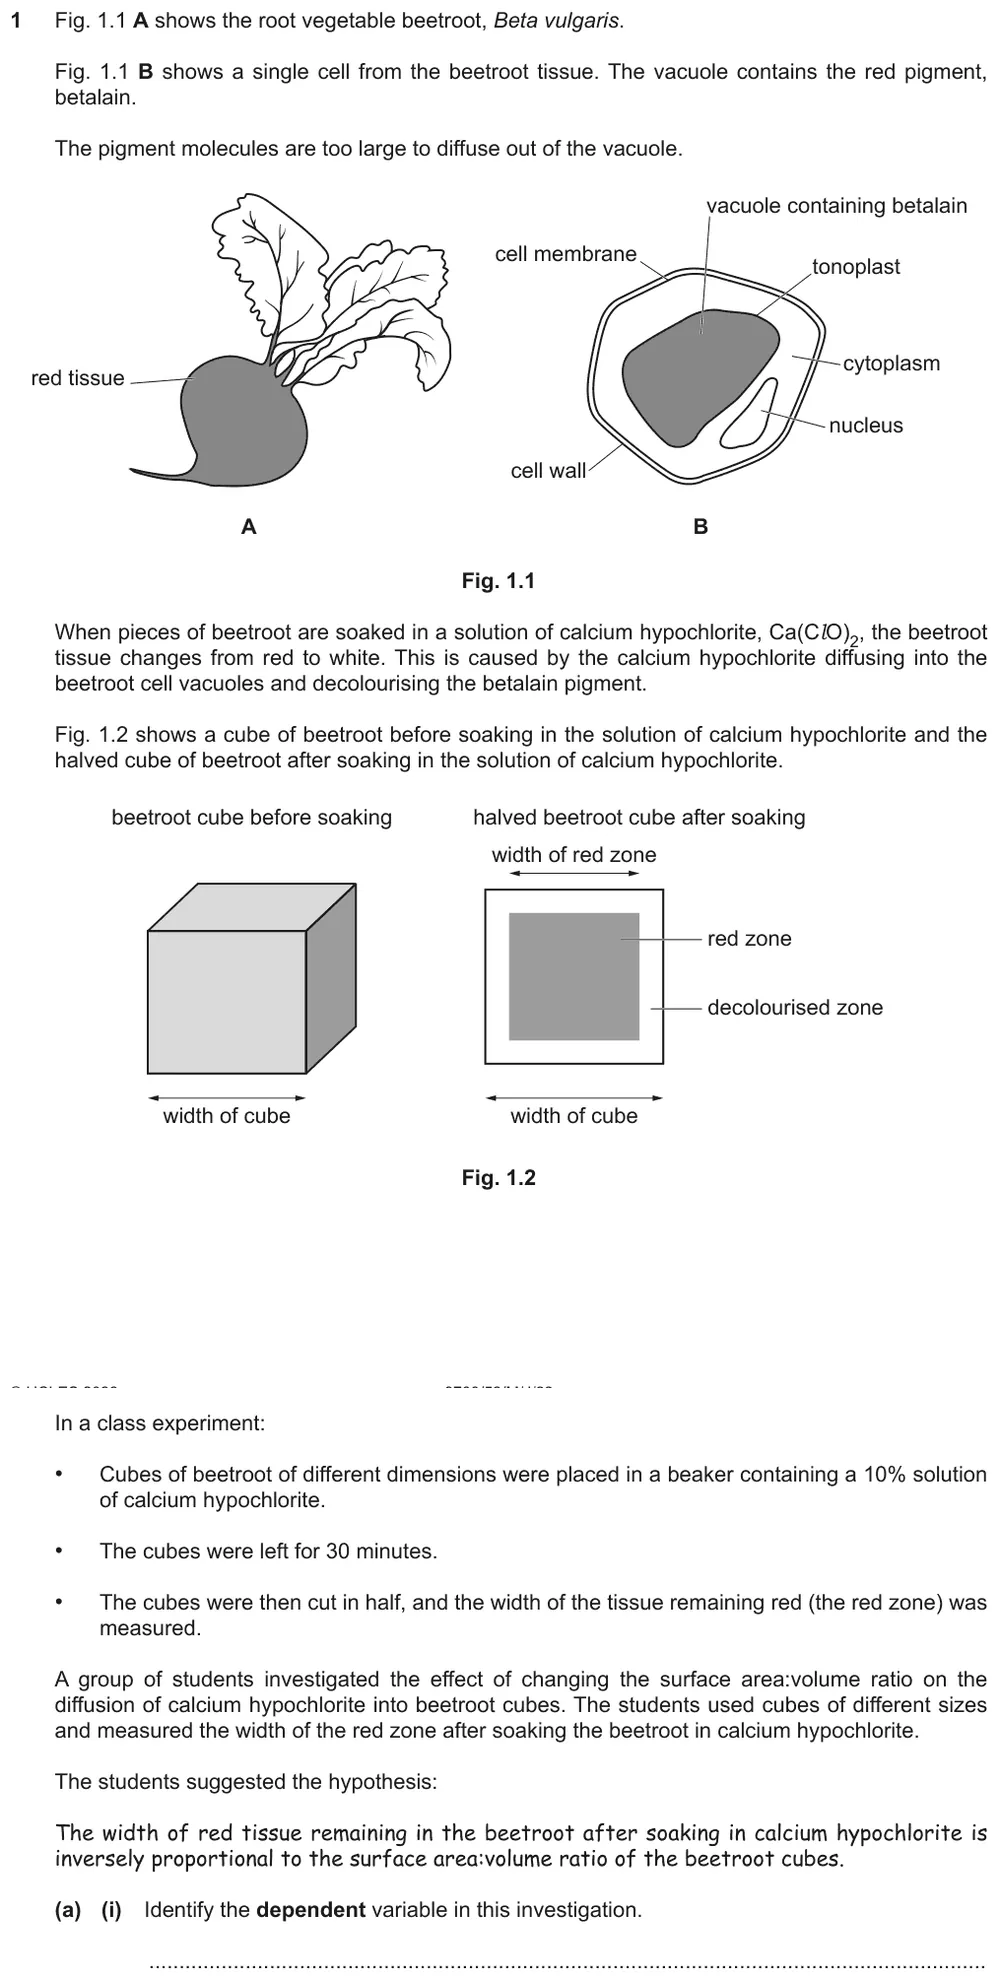
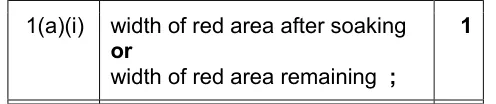
Identify the dependent variable in an investigation using cubes of beetroot.
Show the mark scheme
Tap an image to open it full size.
From the examiners' report: The dependent variable is the feature that is measured, the width of the red tissue, not the rate of diffusion of calcium hypochlorite. Students who gave two alternatives could not gain credit.
Predictions and sketch graphs (P5 1)
Question 5
Paper 5 · May/June 2022 (52) · Q1(a)(ii) · 2 marks
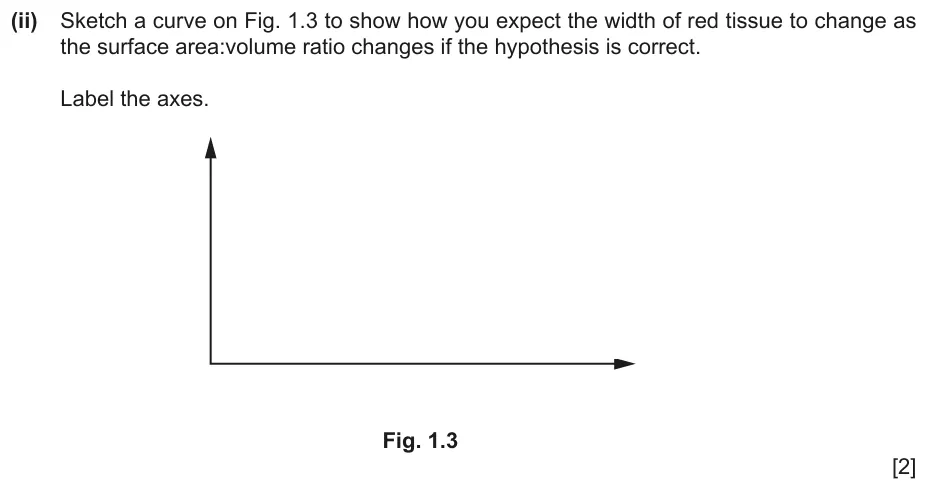
Sketch the curve you would expect if the hypothesis is correct, and label the axes.
Show the mark scheme

Tap an image to open it full size.
From the examiners' report: Put the independent variable, the surface area to volume ratio, on the x-axis and label both axes fully: 'width' on its own was not enough. Keep the line within the axes, and do not add units to a ratio.
Question 6
Paper 5 · February/March 2023 (52) · Q1(a)(iii) · 2 marks
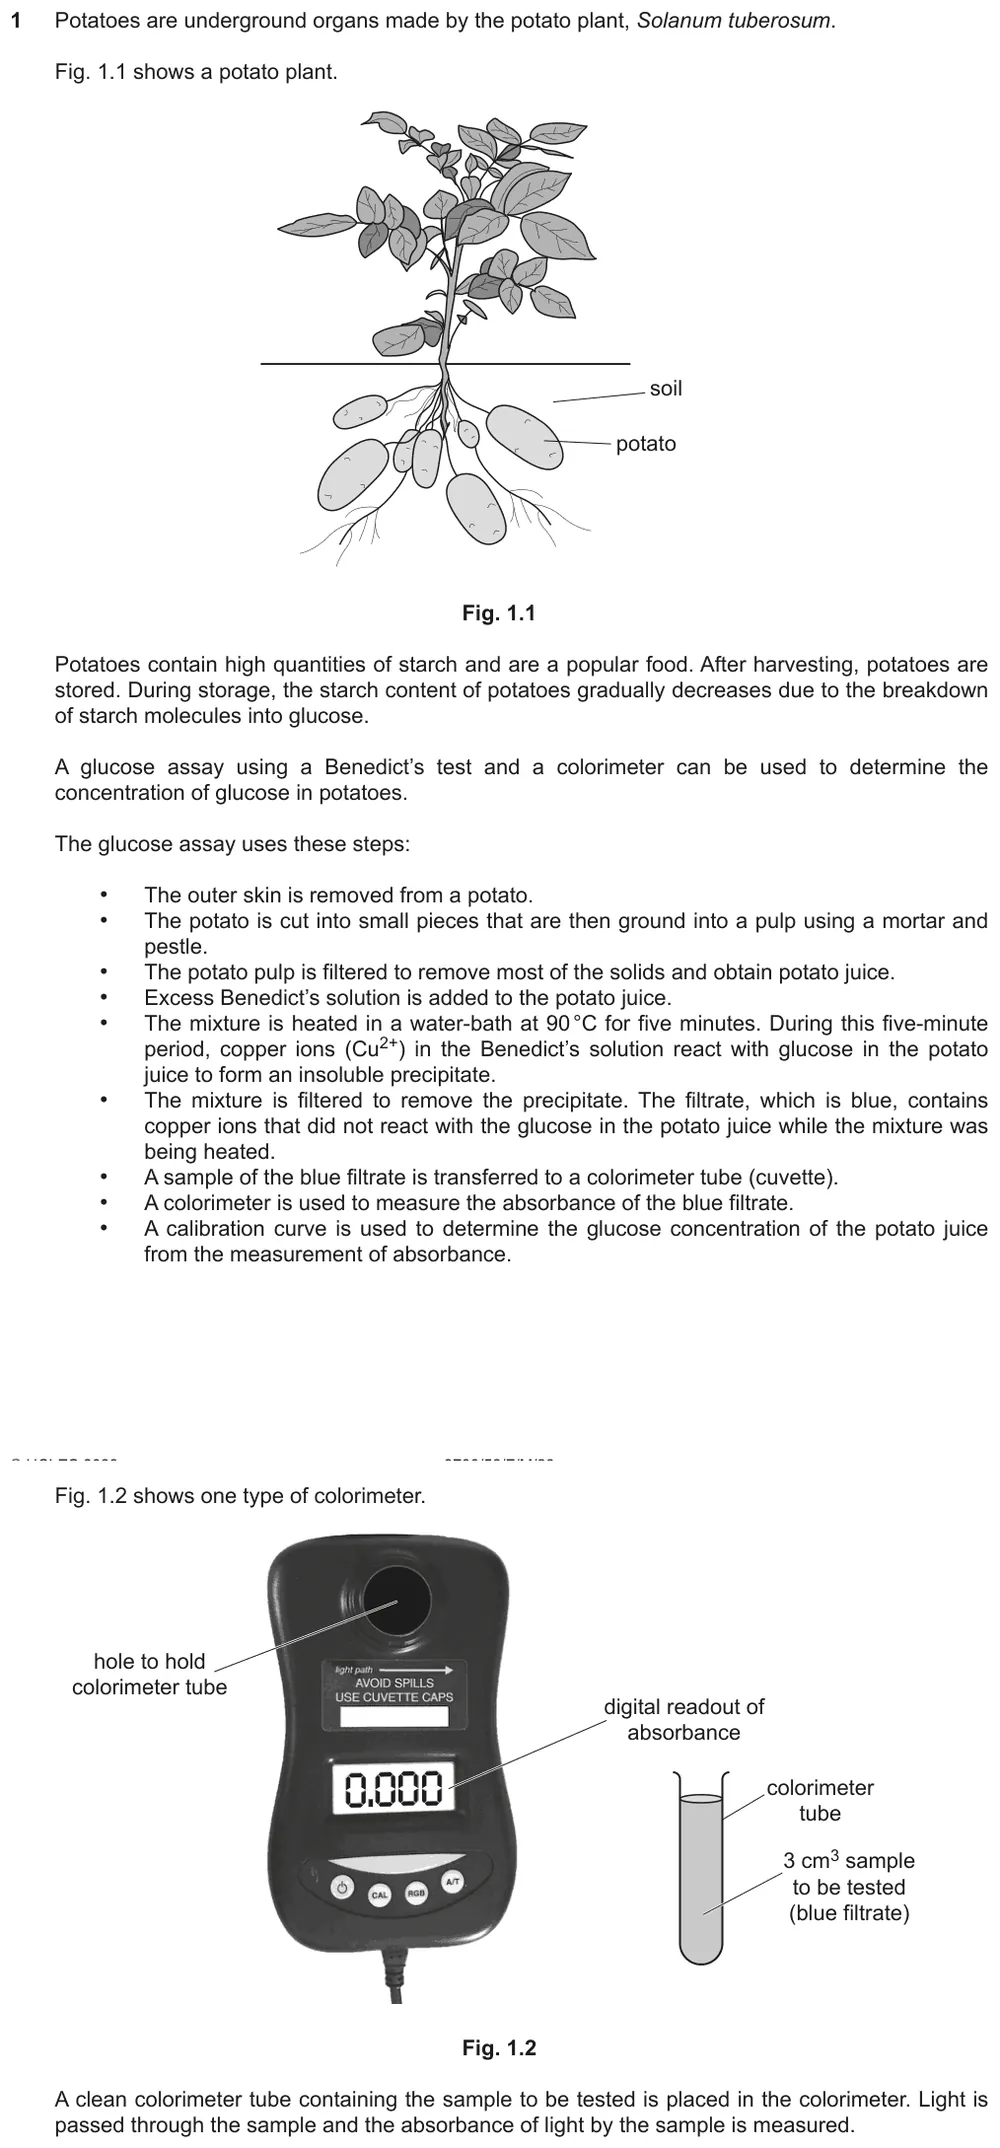
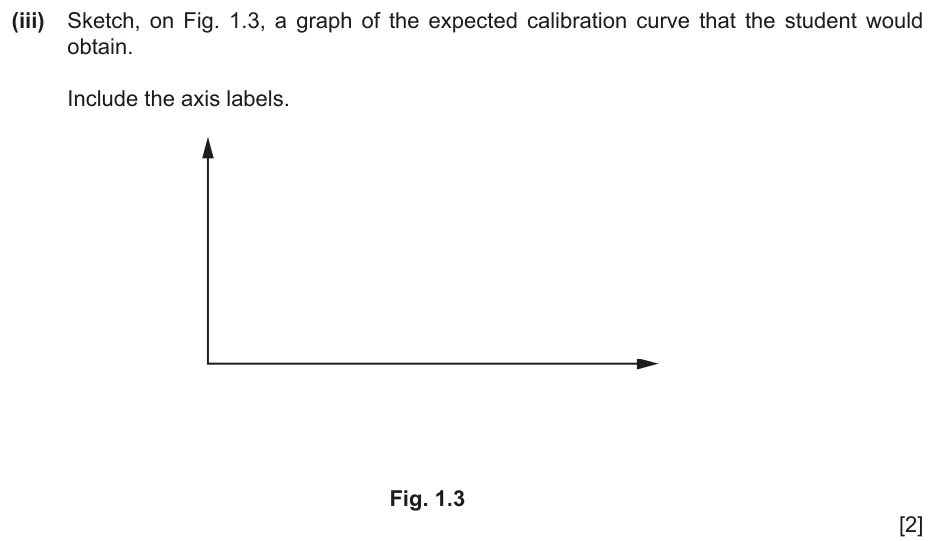
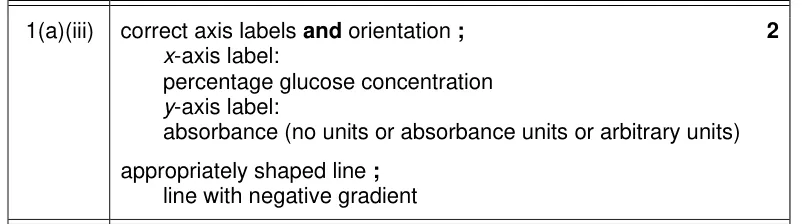
Sketch the calibration curve you would expect for a glucose assay, and label the axes.
Information from earlier in this question:
Show the mark scheme
Tap an image to open it full size.
From the examiners' report: Many students chose the correct axis labels, but fewer saw that the absorbance decreases as the glucose concentration increases. Some curves had a negative gradient and then rose at the end.
Question 7
Paper 5 · October/November 2025 (52) · Q1(a)(iv) · 2 marks
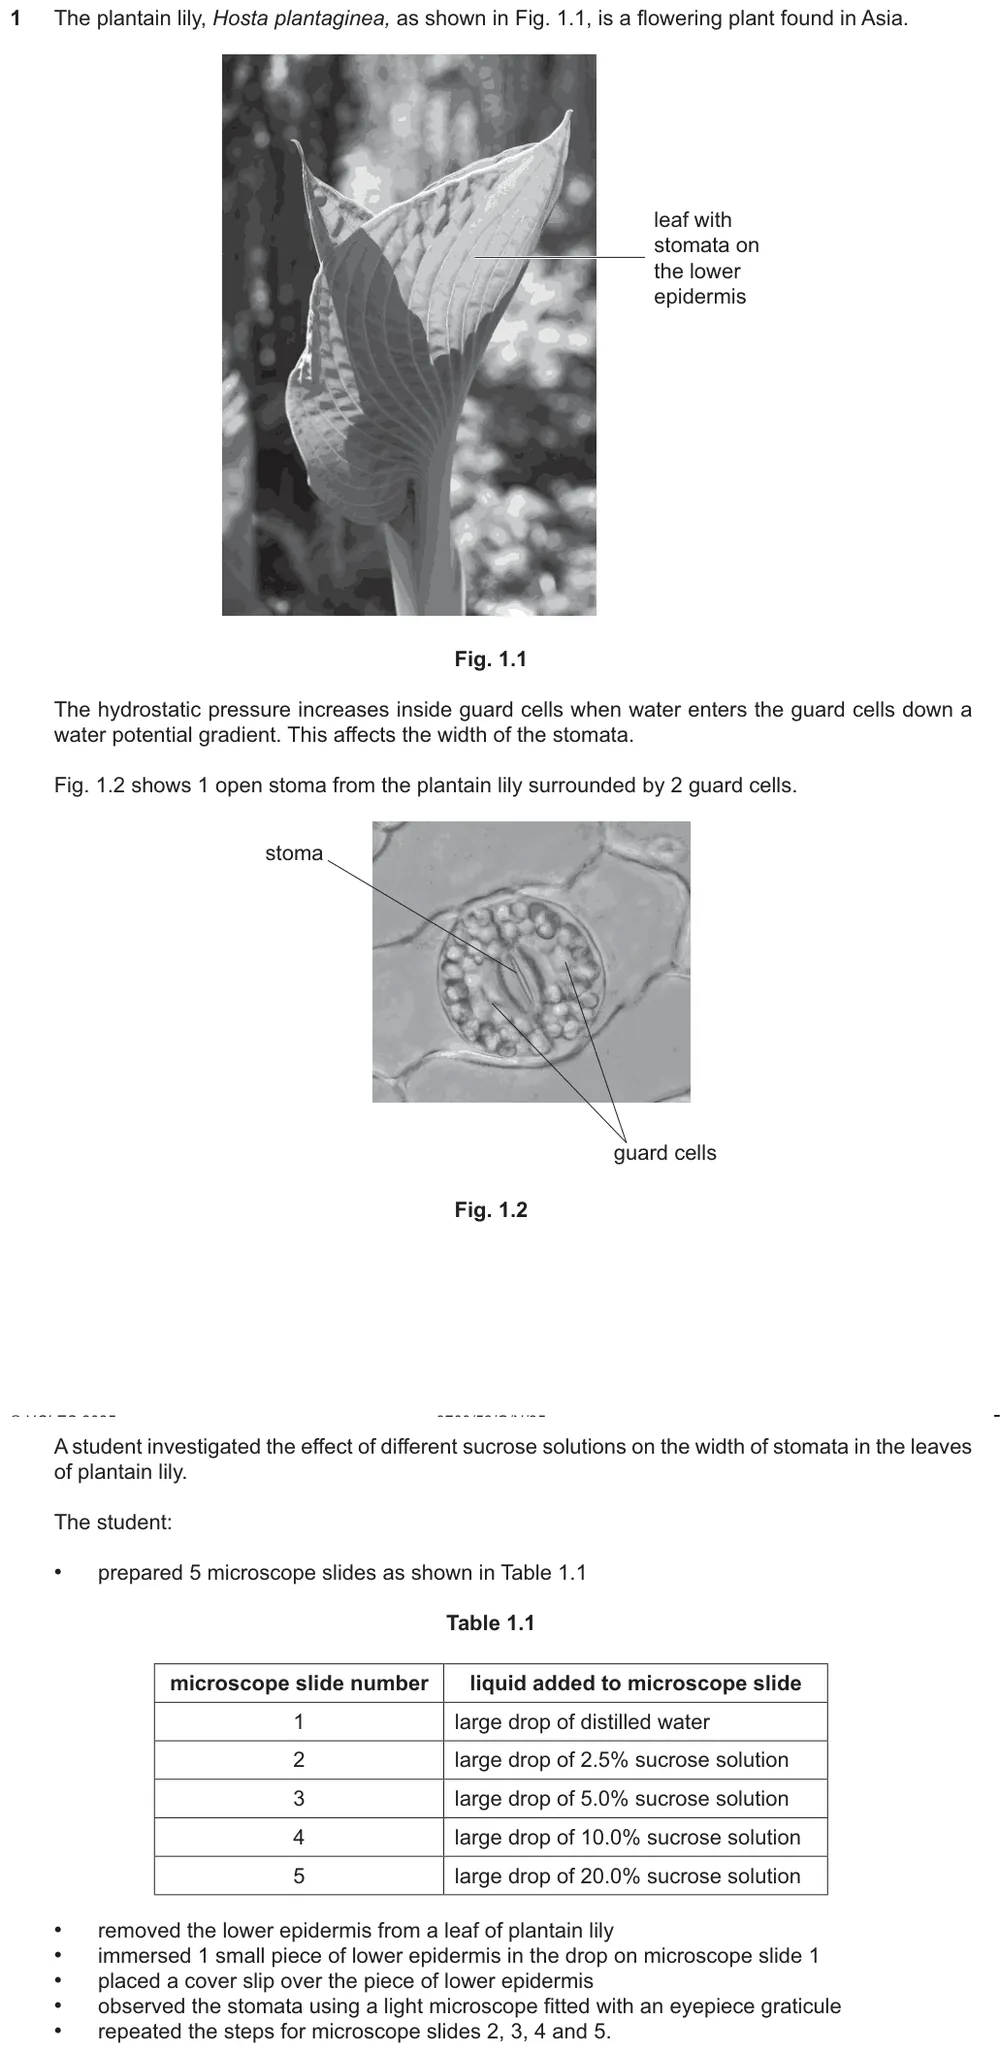
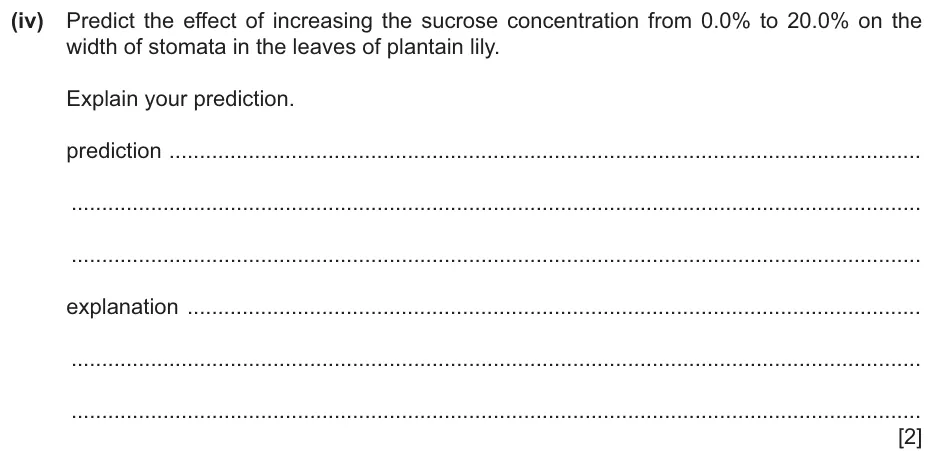
Predict the effect of increasing sucrose concentration on the width of stomata, and explain the prediction.
Information from earlier in this question:
Show the mark scheme

Tap an image to open it full size.
Standardising variables (P5 2)
Question 8
Paper 5 · May/June 2024 (52) · Q1(a)(ii) · 2 marks
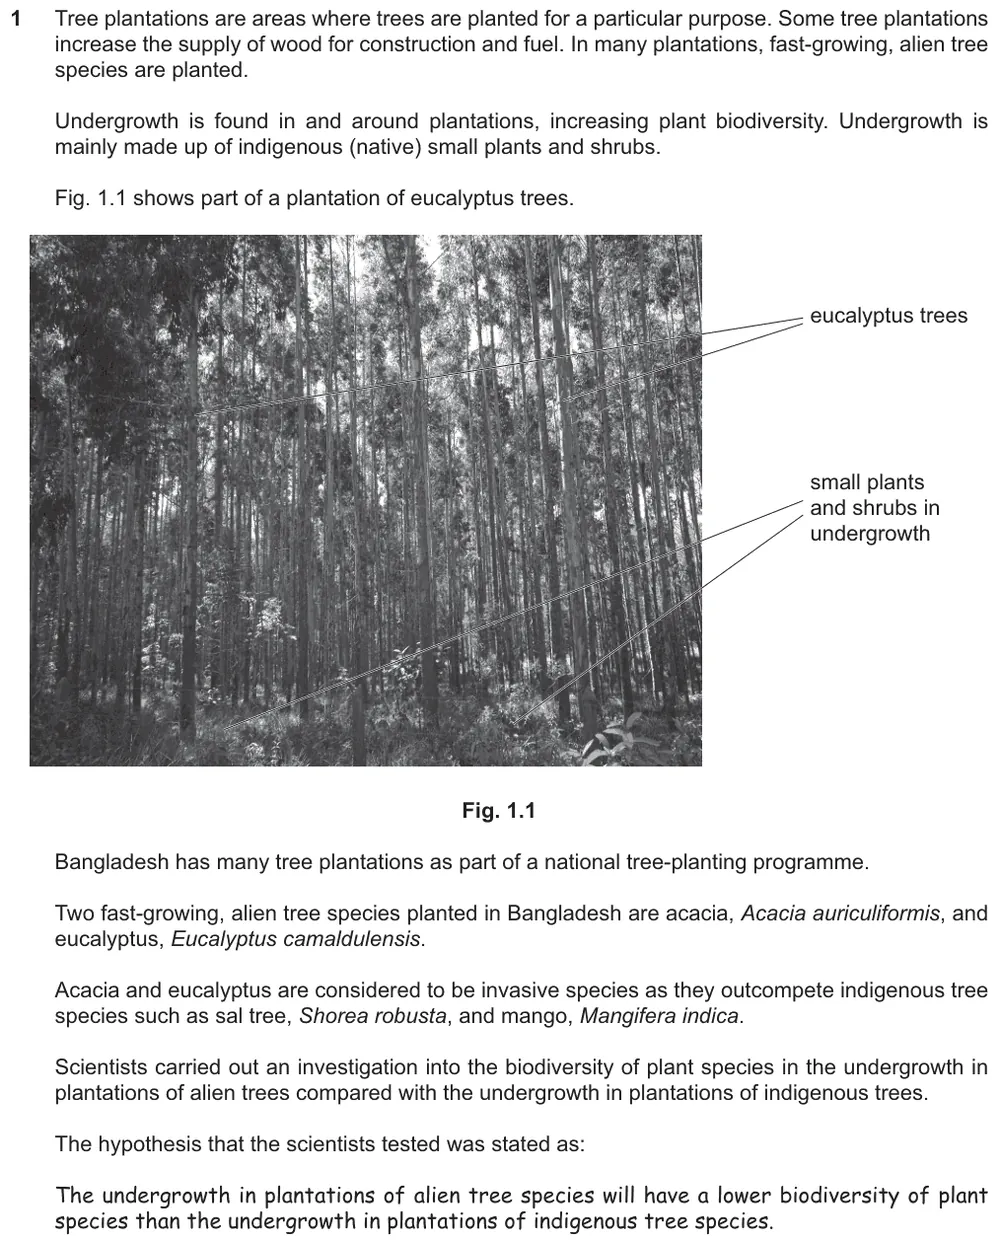
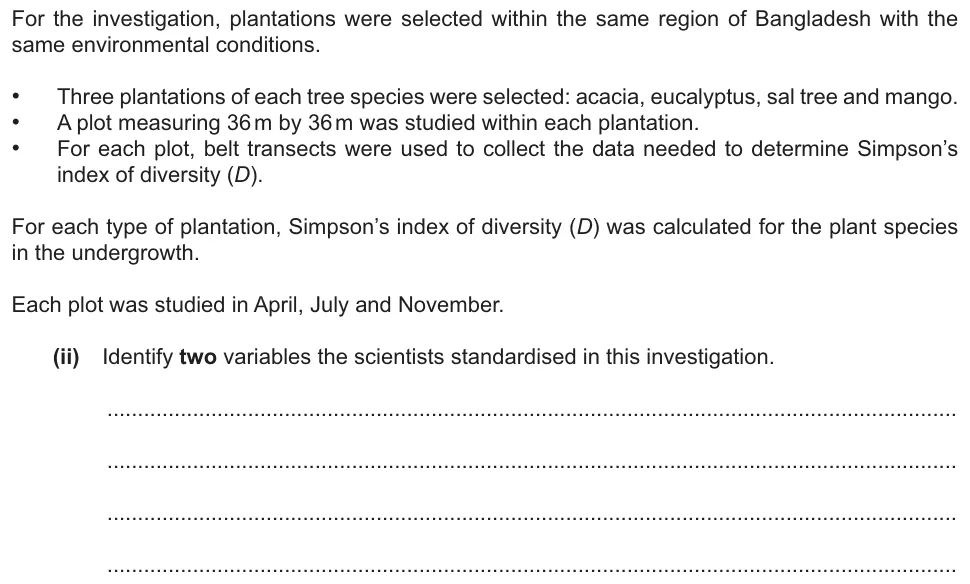
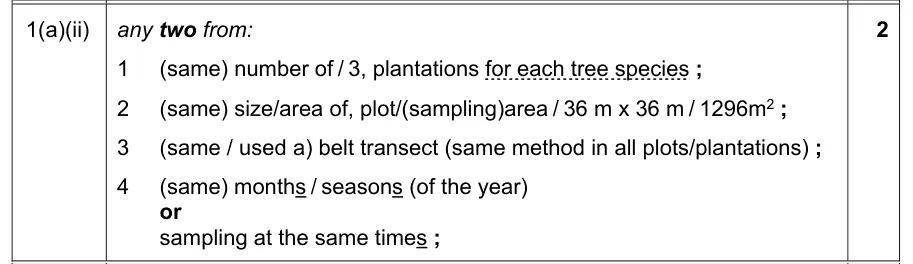
Identify two variables that the scientists standardised when they sampled the undergrowth.
Information from earlier in this question:
Show the mark scheme
Tap an image to open it full size.
From the examiners' report: Read the information carefully: the number of plantations and the area of the plot were the most common correct answers. 'The size of the area' was too vague, and environmental conditions that cannot be controlled did not gain credit.
Question 9
Paper 5 · October/November 2023 (52) · Q1(a) · 2 marks
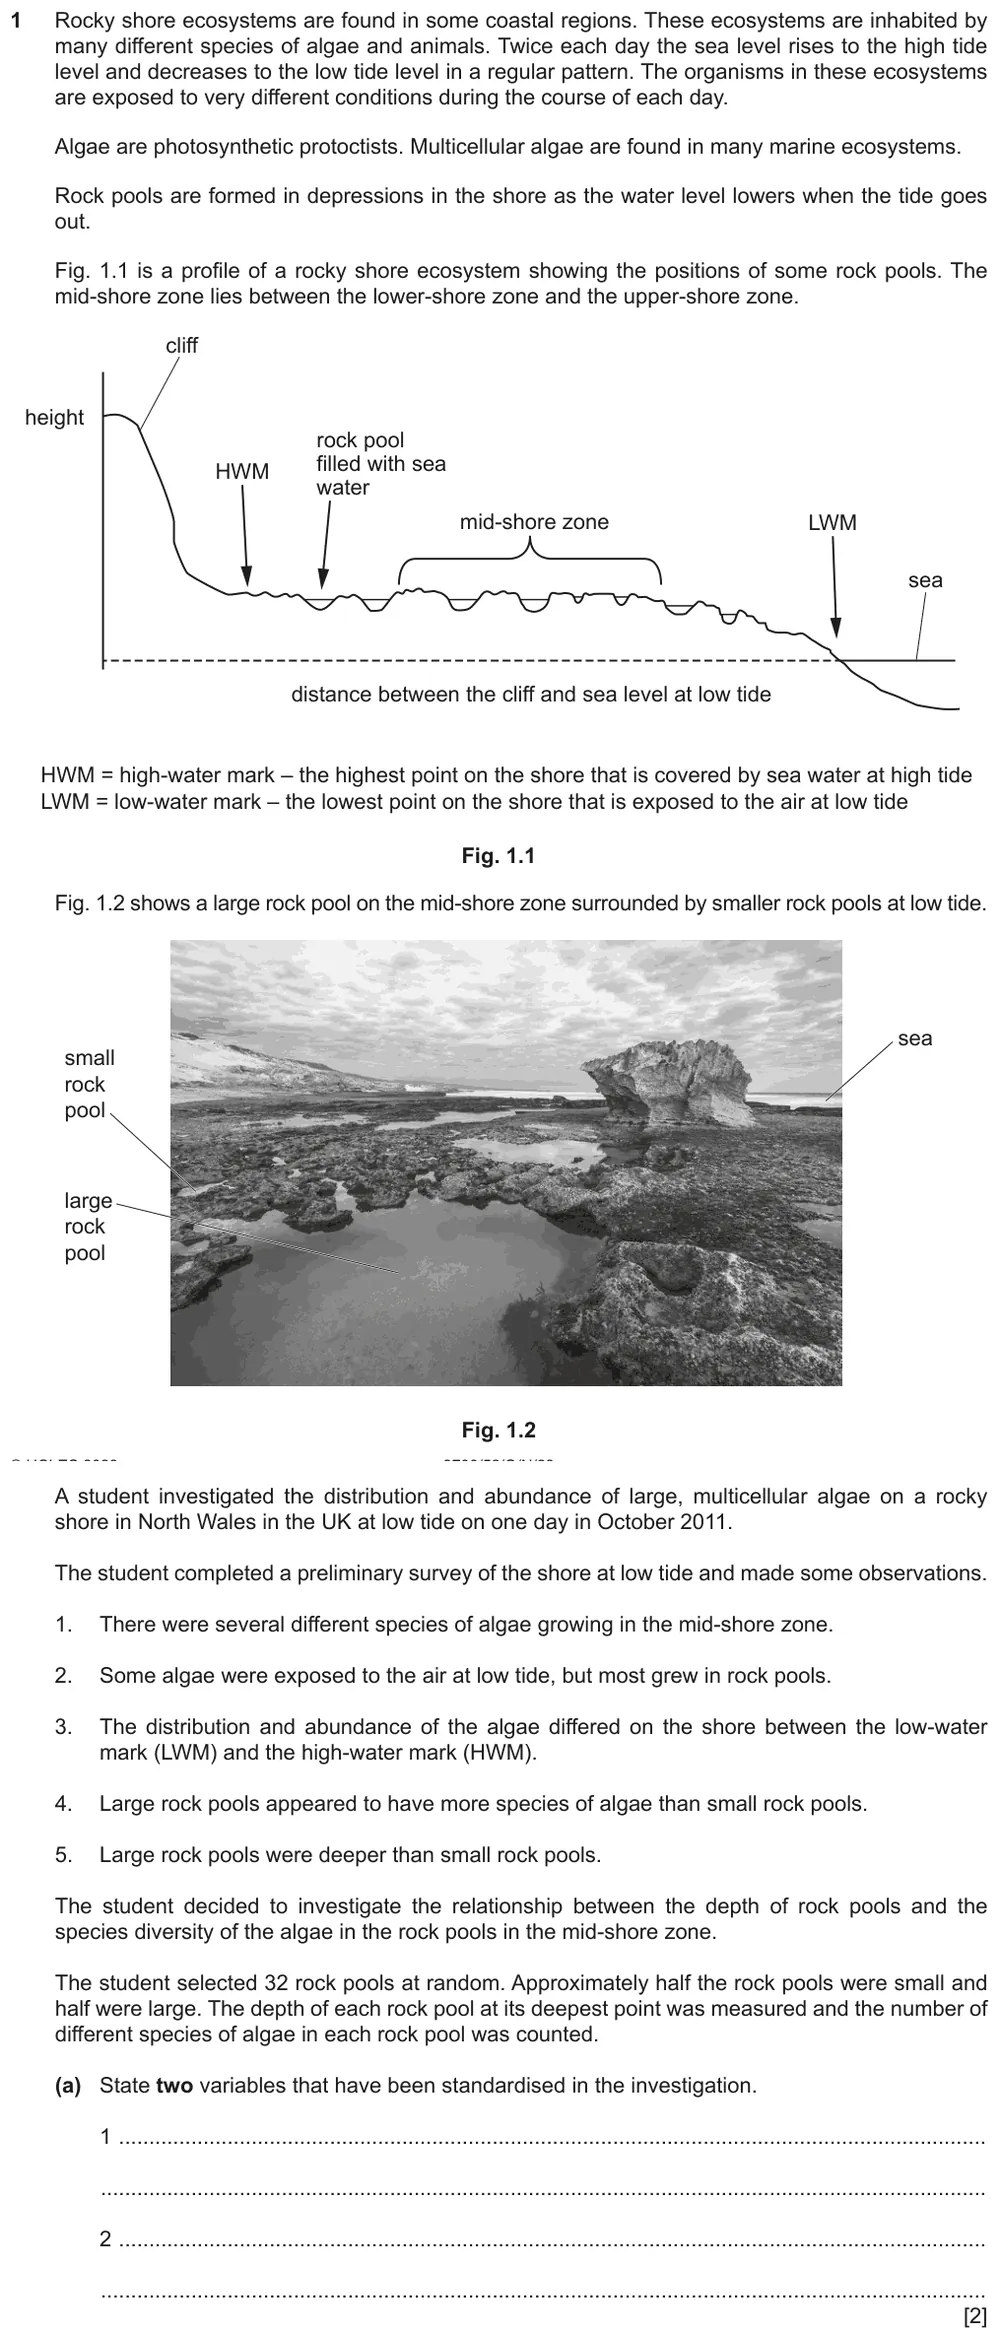
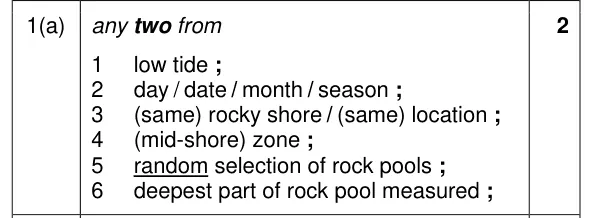
State two variables that were standardised in an investigation of rock pools.
Show the mark scheme
Tap an image to open it full size.
From the examiners' report: Give two variables only: students who wrote a list often included the independent or dependent variable. Be precise, for example that each rock pool was measured at its deepest point, not just that its depth was measured.
Question 10
Paper 5 · May/June 2023 (52) · Q2(a)(i) · 2 marks
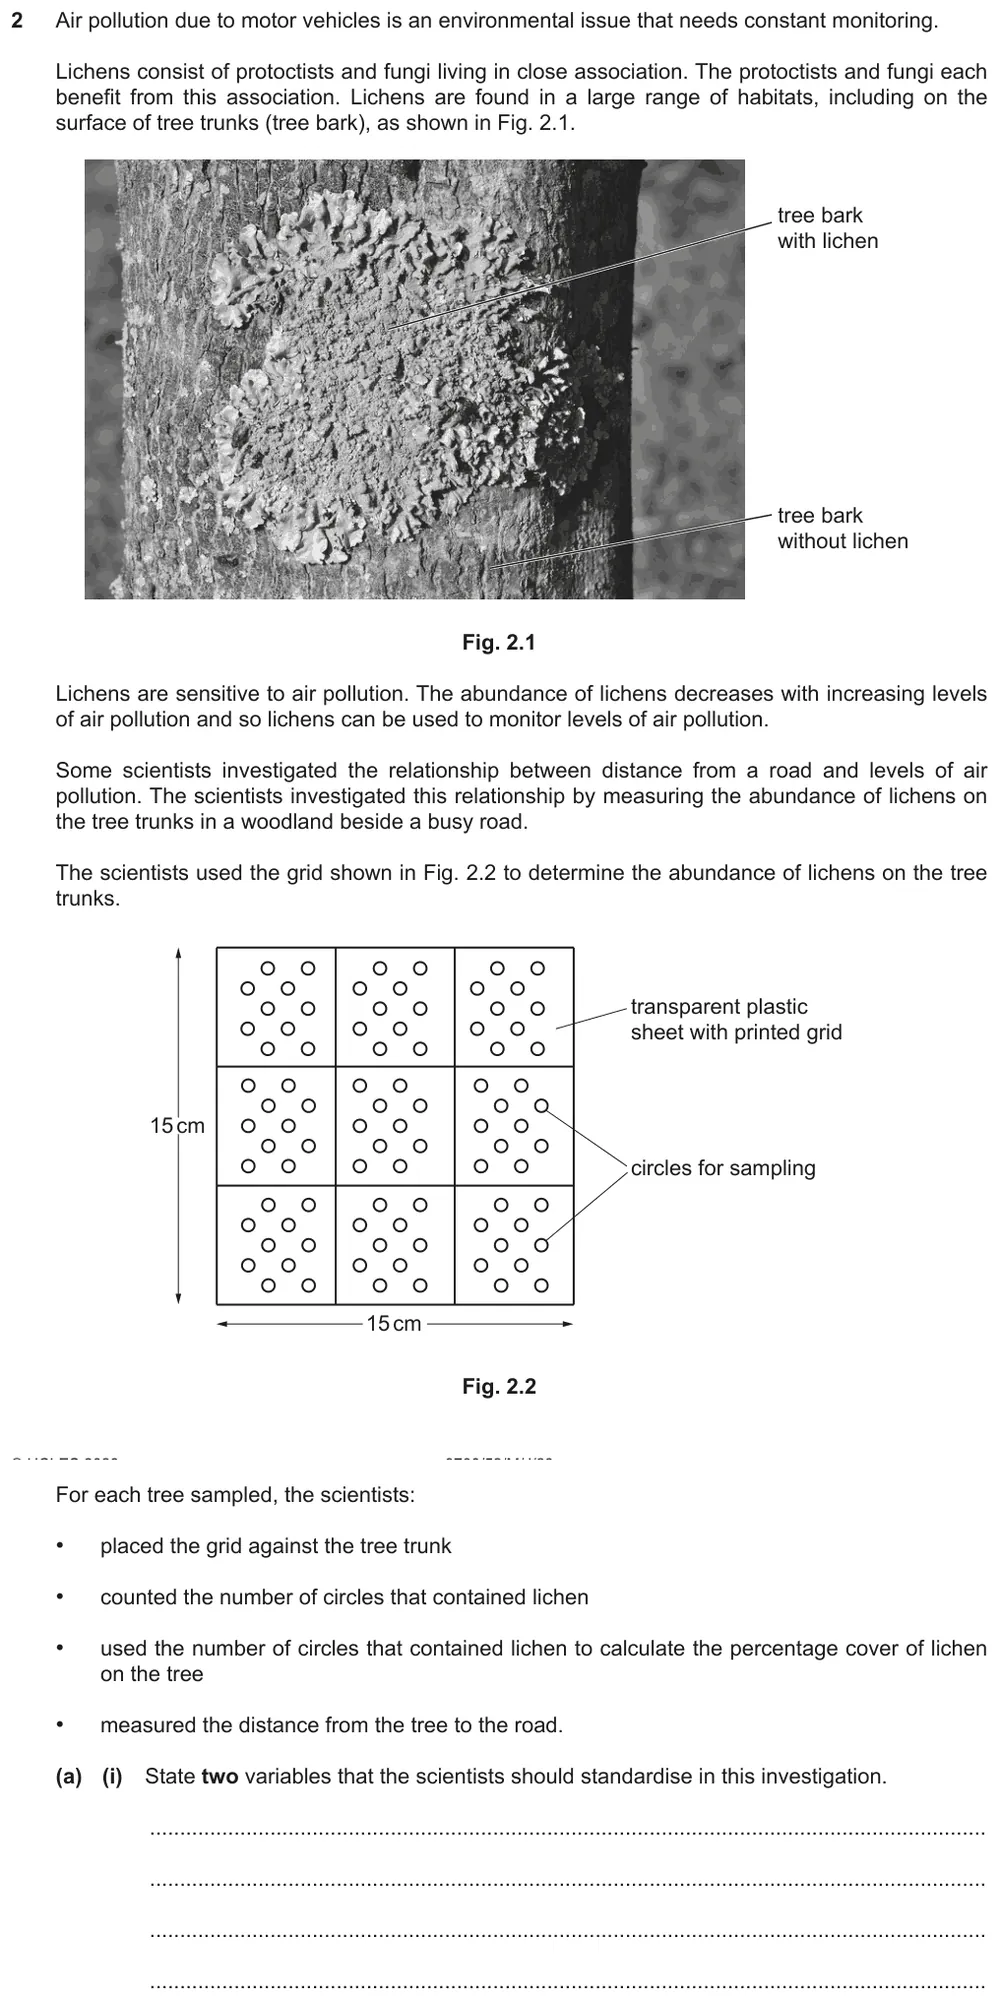
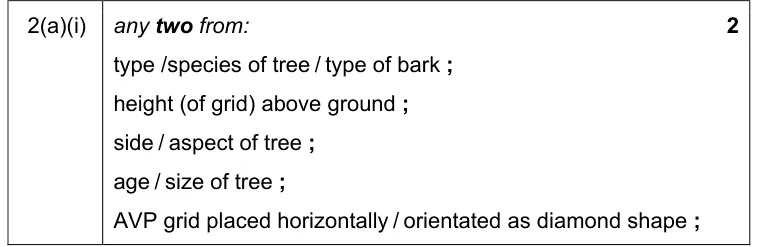
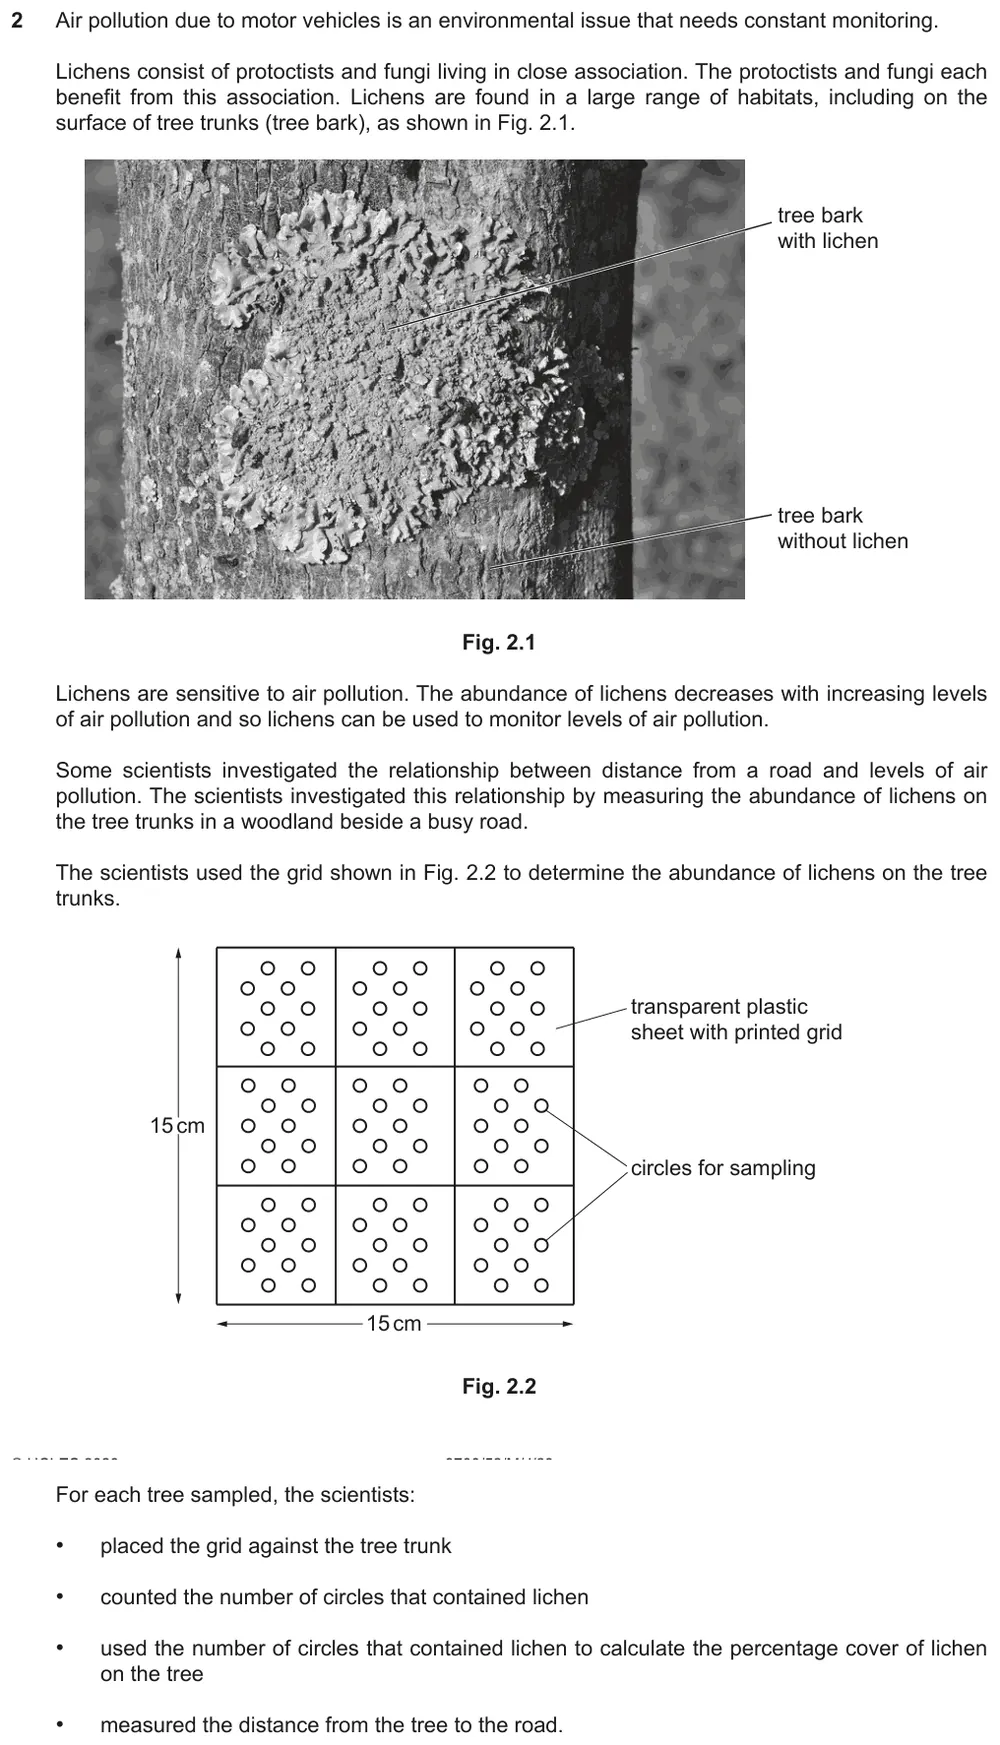
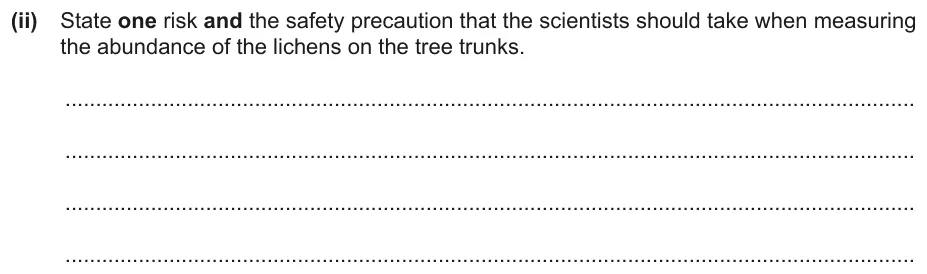
State two variables that should be standardised when measuring the lichen cover on tree trunks.
Show the mark scheme
Tap an image to open it full size.
From the examiners' report: The question asks what should be standardised, not what was: answers about the grid, copied from the information given, missed the point. Do not write a list, because incorrect suggestions may cancel correct ones.
Question 11
Paper 5 · February/March 2022 (52) · Q2(b)(i) · 1 mark · Hard
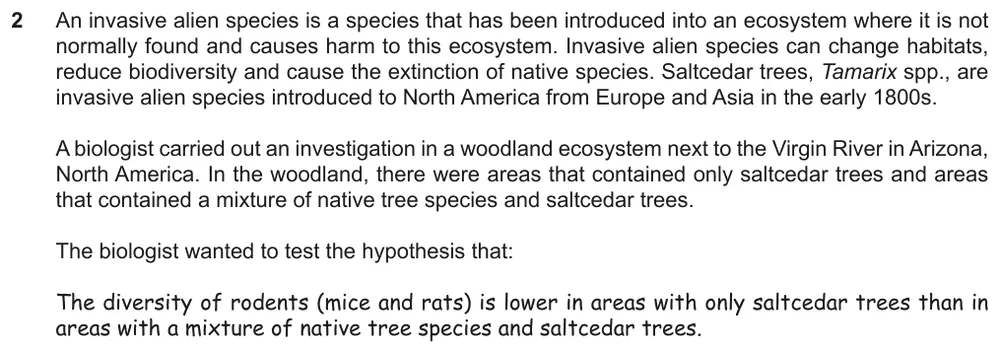
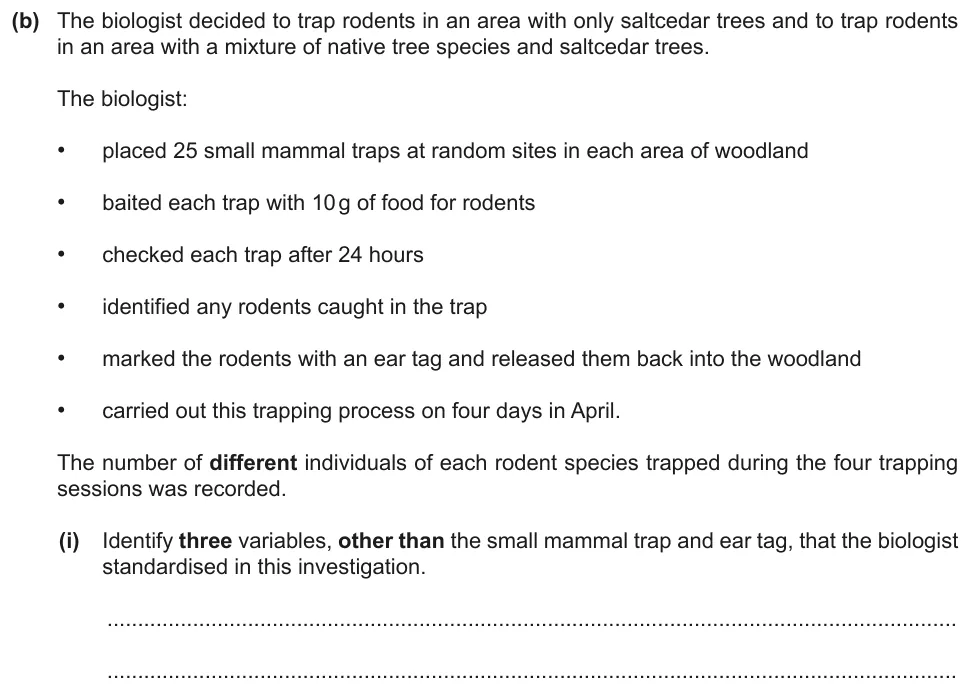
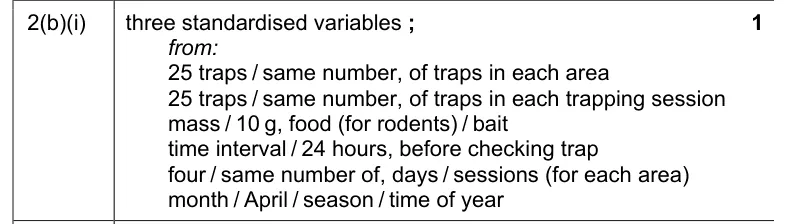
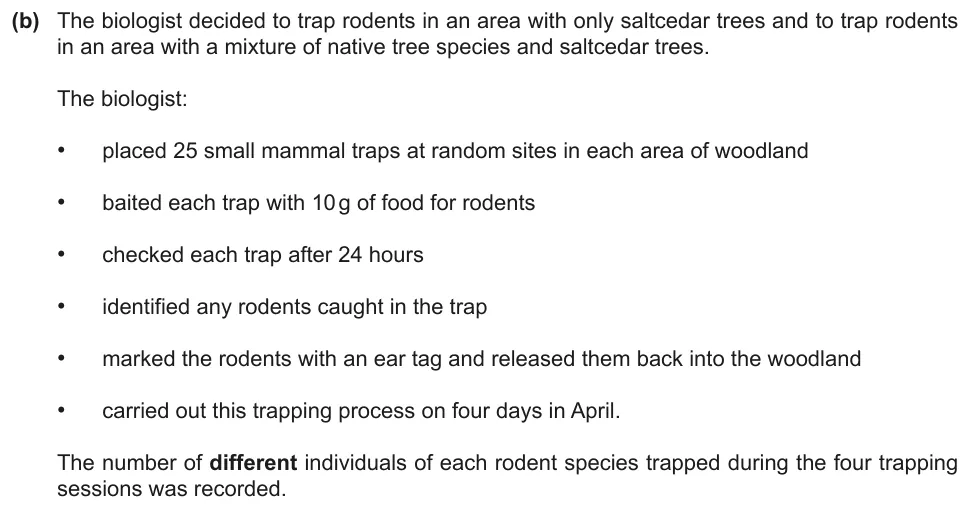
Identify three variables that the biologist standardised when trapping rodents.
Information from earlier in this question:
Show the mark scheme
Tap an image to open it full size.
From the examiners' report: Most students listed three variables that were standardised. A few wrongly wrote that the rodents trapped were standardised.
Control experiments (P5 2)
Question 12
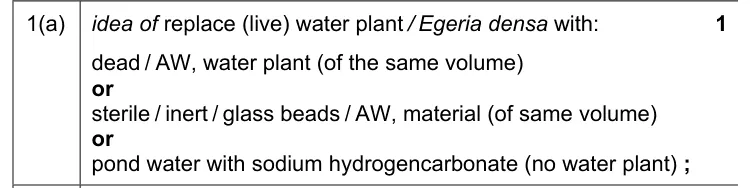
Paper 5 · February/March 2022 (52) · Q1(a) · 1 mark
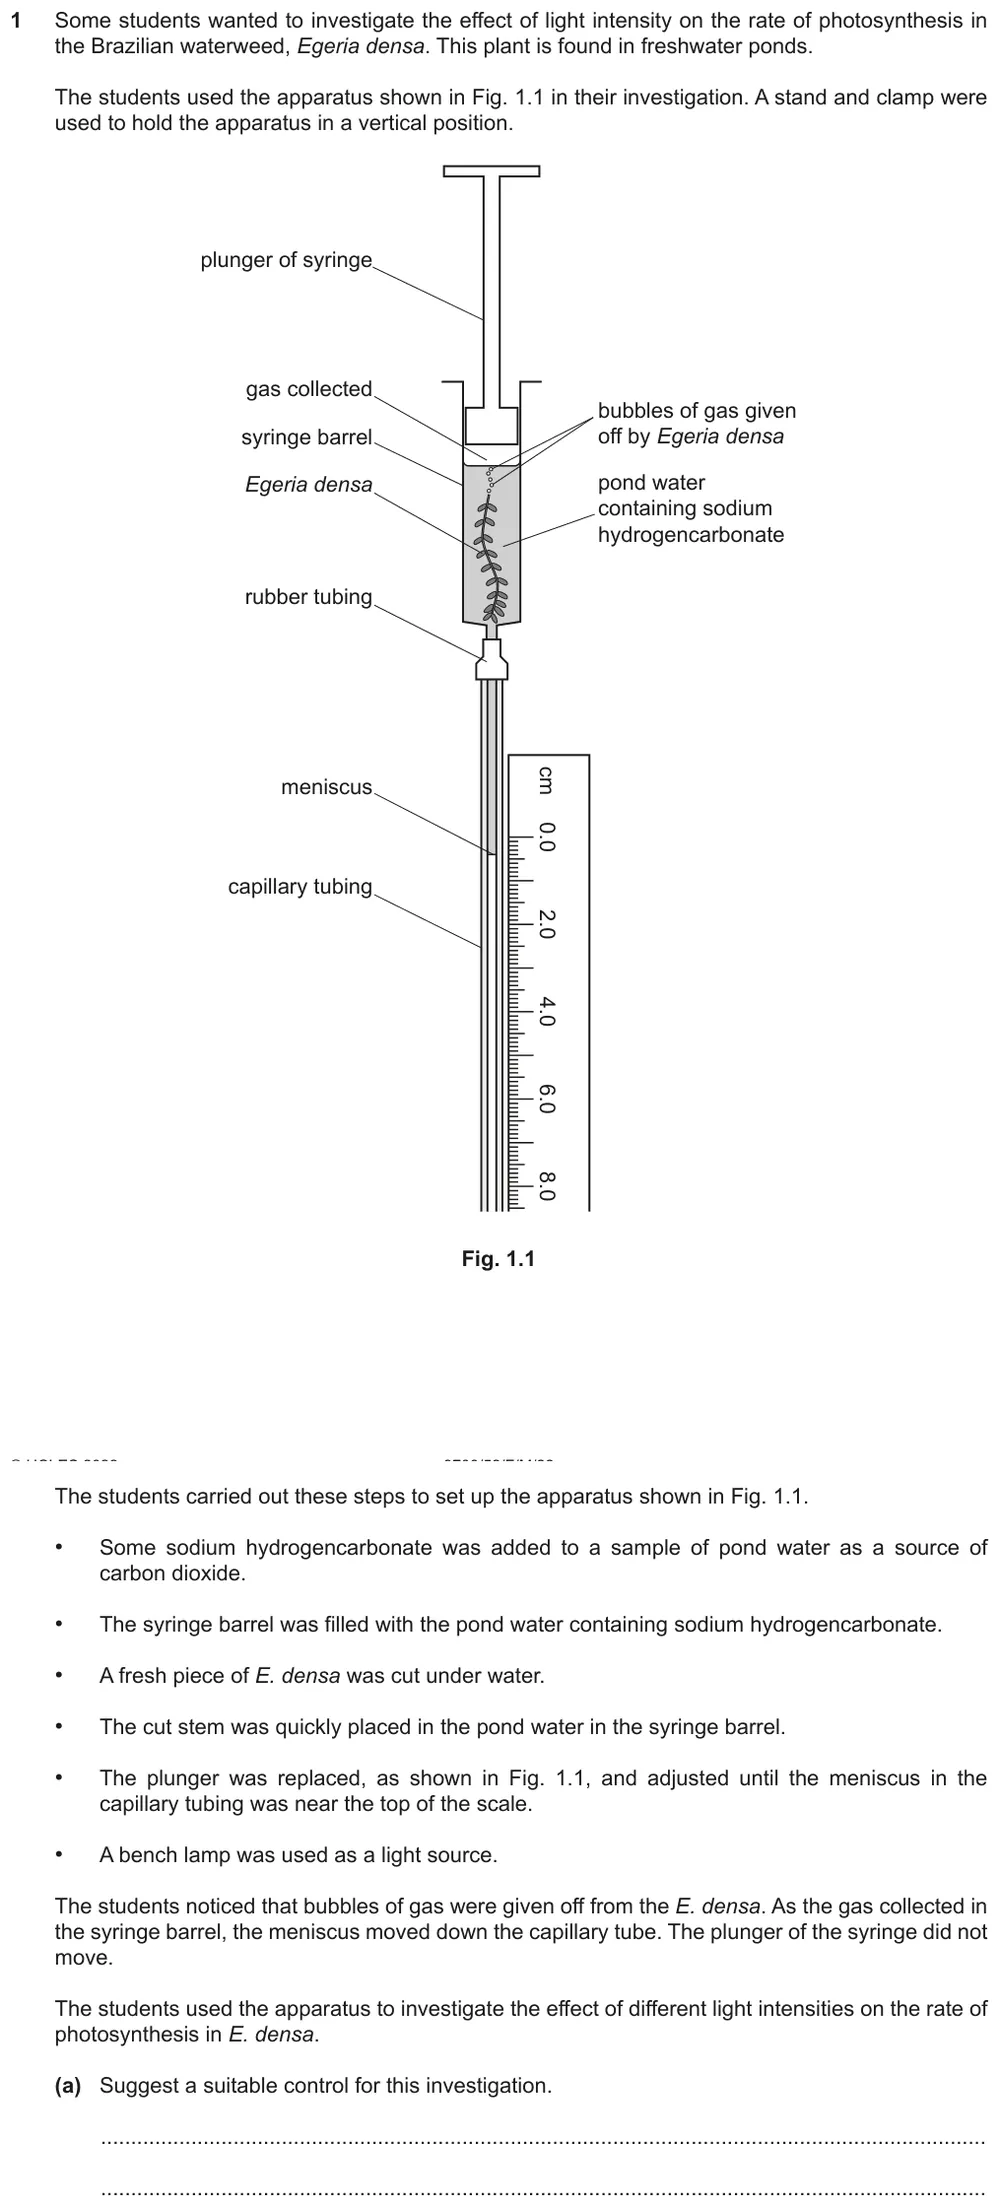
Suggest a suitable control for an investigation of light intensity and the rate of photosynthesis.
Show the mark scheme
Tap an image to open it full size.
From the examiners' report: Many students confused a control experiment with a control variable, which is a variable that is kept constant. A control here replaces the water plant, for example with inert material, to check that the results are caused by the effect of light on the plant.
Question 13
Paper 5 · October/November 2022 (52) · Q2(a) · 1 mark
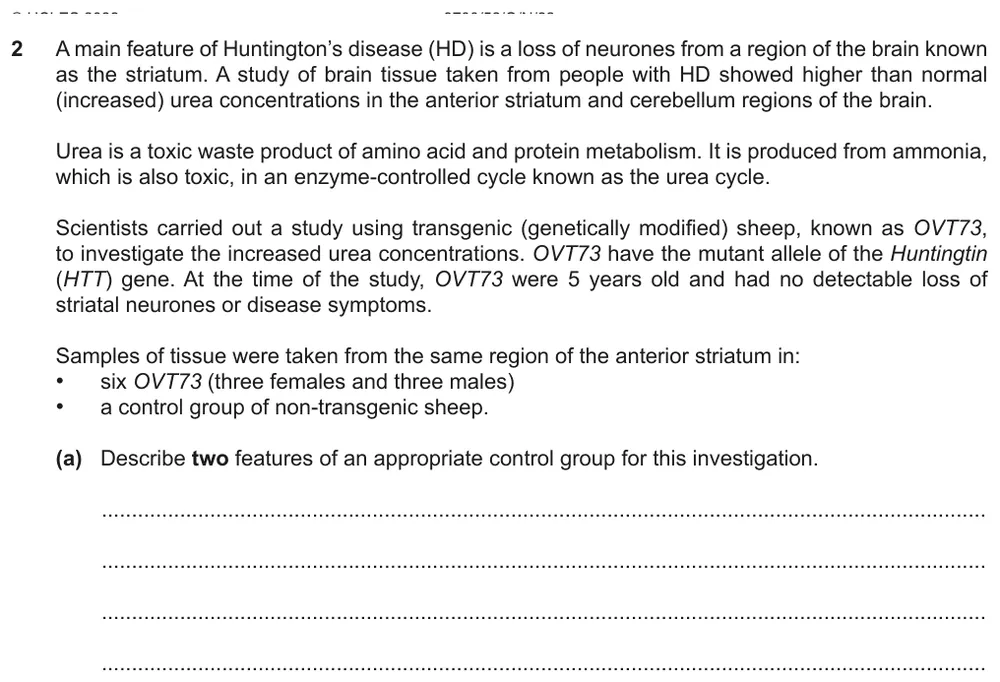
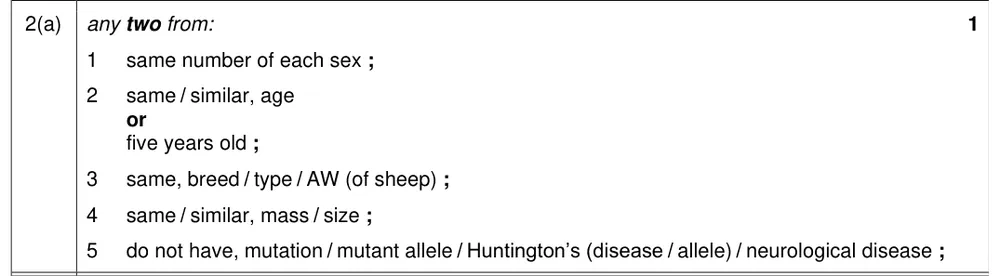
Describe two features of a suitable control group of sheep.
Show the mark scheme
Tap an image to open it full size.
From the examiners' report: The most common answers that gained credit were that the sheep should be the same age, and that there should be the same number of each sex.
Using a colorimeter (P5 2)
Question 14
Paper 5 · October/November 2022 (52) · Q1(a) · 2 marks
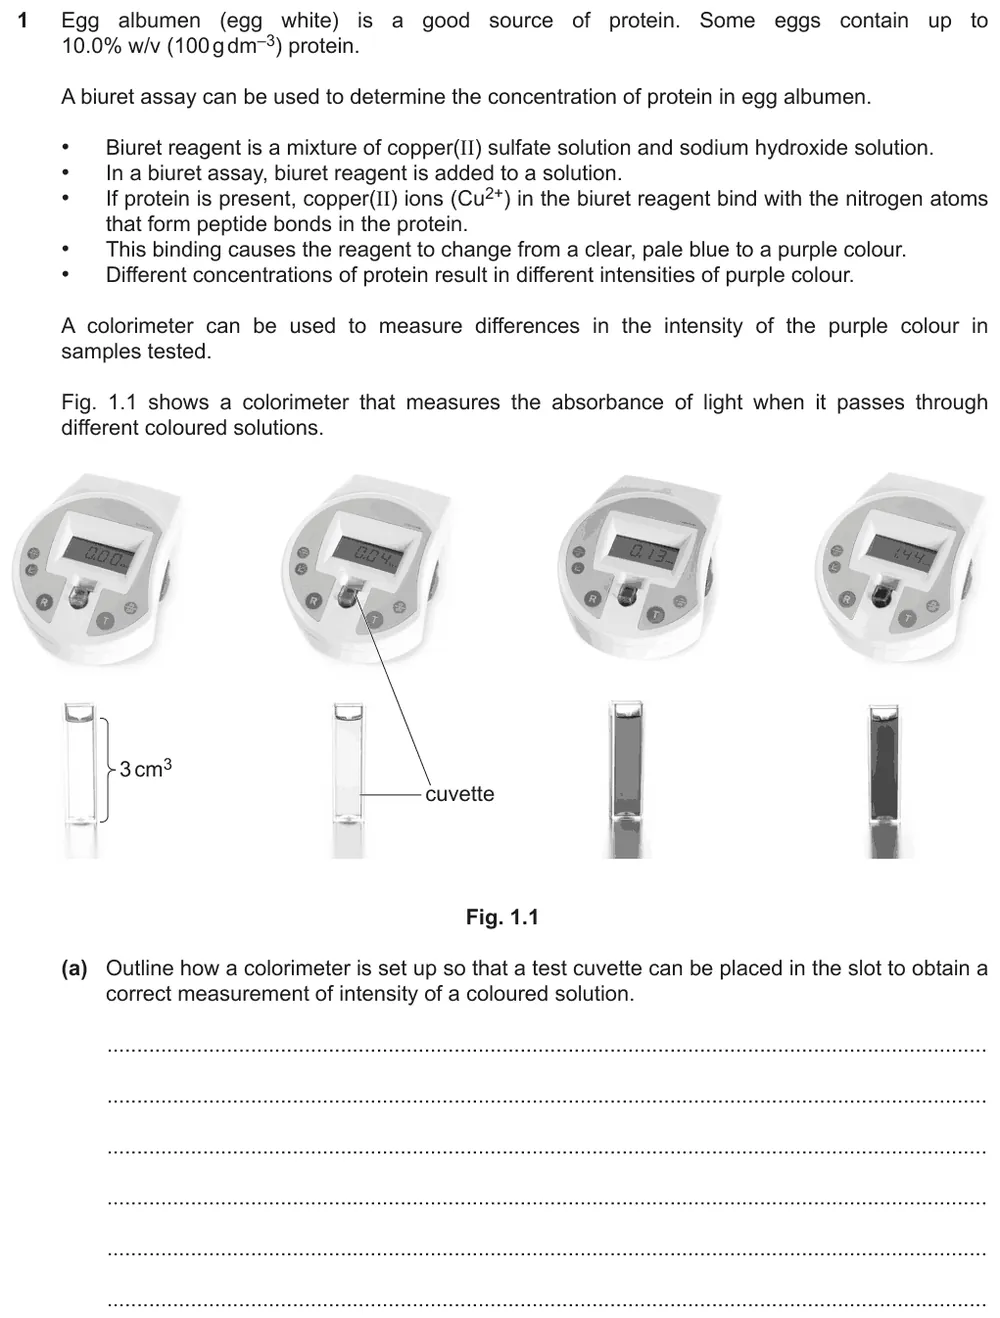
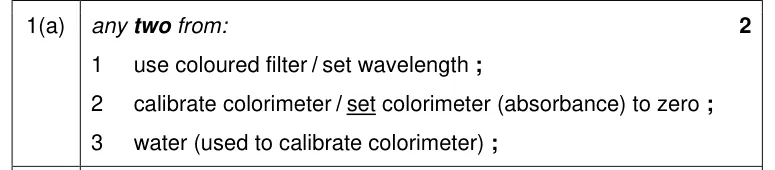
Outline how a colorimeter is set up before the absorbance of a coloured solution is measured.
Show the mark scheme
Tap an image to open it full size.
From the examiners' report: Say that the colorimeter is calibrated, for example set to zero using a cuvette of distilled water. The strongest answers also used a coloured filter of a suitable colour: orange, yellow or green for this purple solution.
Preparing dilutions (P5 2)
Question 15
Paper 5 · October/November 2022 (52) · Q1(b)(i) · 2 marks
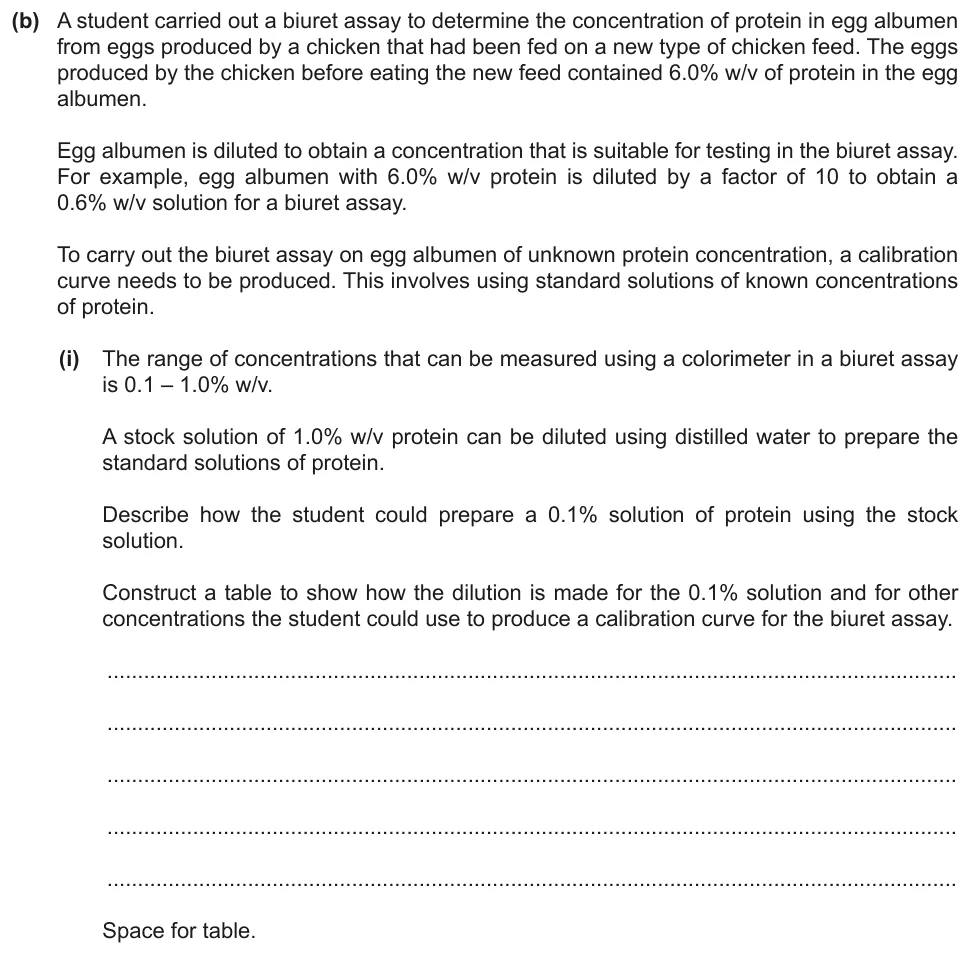
Describe how to prepare a 0.1% protein solution from the stock solution, and construct a table of dilutions for a calibration curve.
Show the mark scheme

Tap an image to open it full size.
From the examiners' report: Give the columns of your table detailed headings with units: without units it was not clear whether figures were volumes or concentrations. Include at least five concentrations, all within the range 0.1% to 1.0%.
Question 16
Paper 5 · May/June 2024 (52) · Q1(d)(i) · 2 marks · Easy
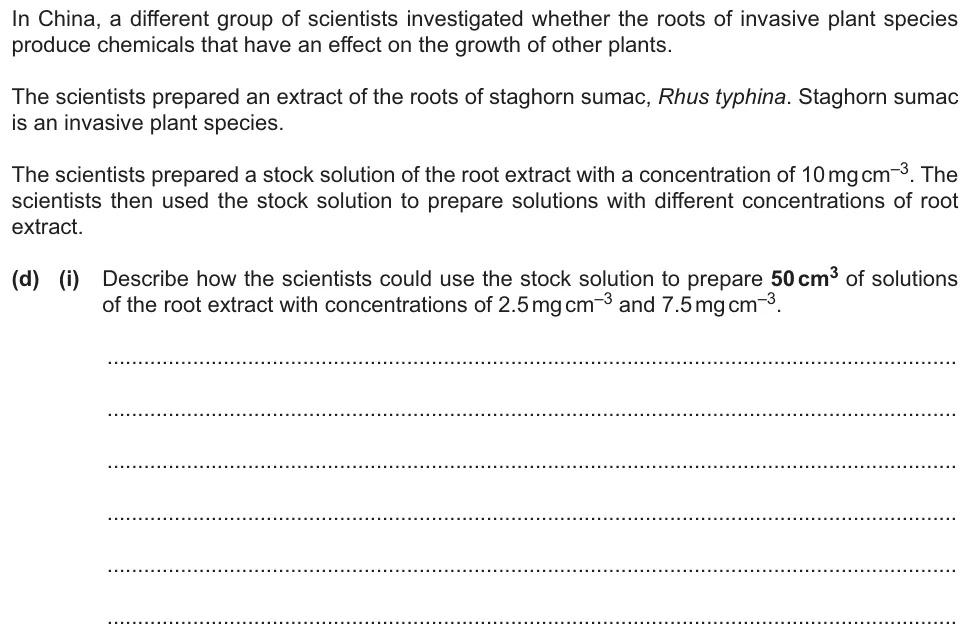
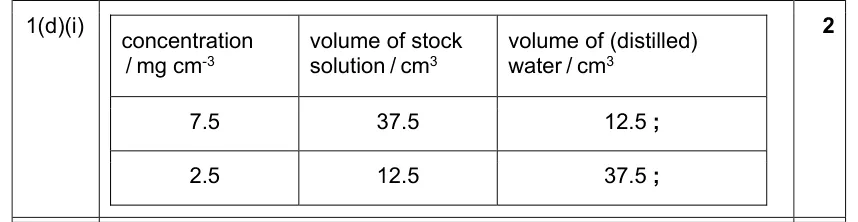
Describe how to prepare 50 cm³ of two concentrations of root extract from the stock solution.
Show the mark scheme
Tap an image to open it full size.
From the examiners' report: Describe both dilutions, with the volume and units for the stock solution and for the distilled water: 'repeat the opposite' was not enough. If you use C1V1 = C2V2, give units or say what each figure refers to.
Describing a method (P5 2)
Question 17
Paper 5 · February/March 2022 (52) · Q1(b)(i) · 7 marks · Easy
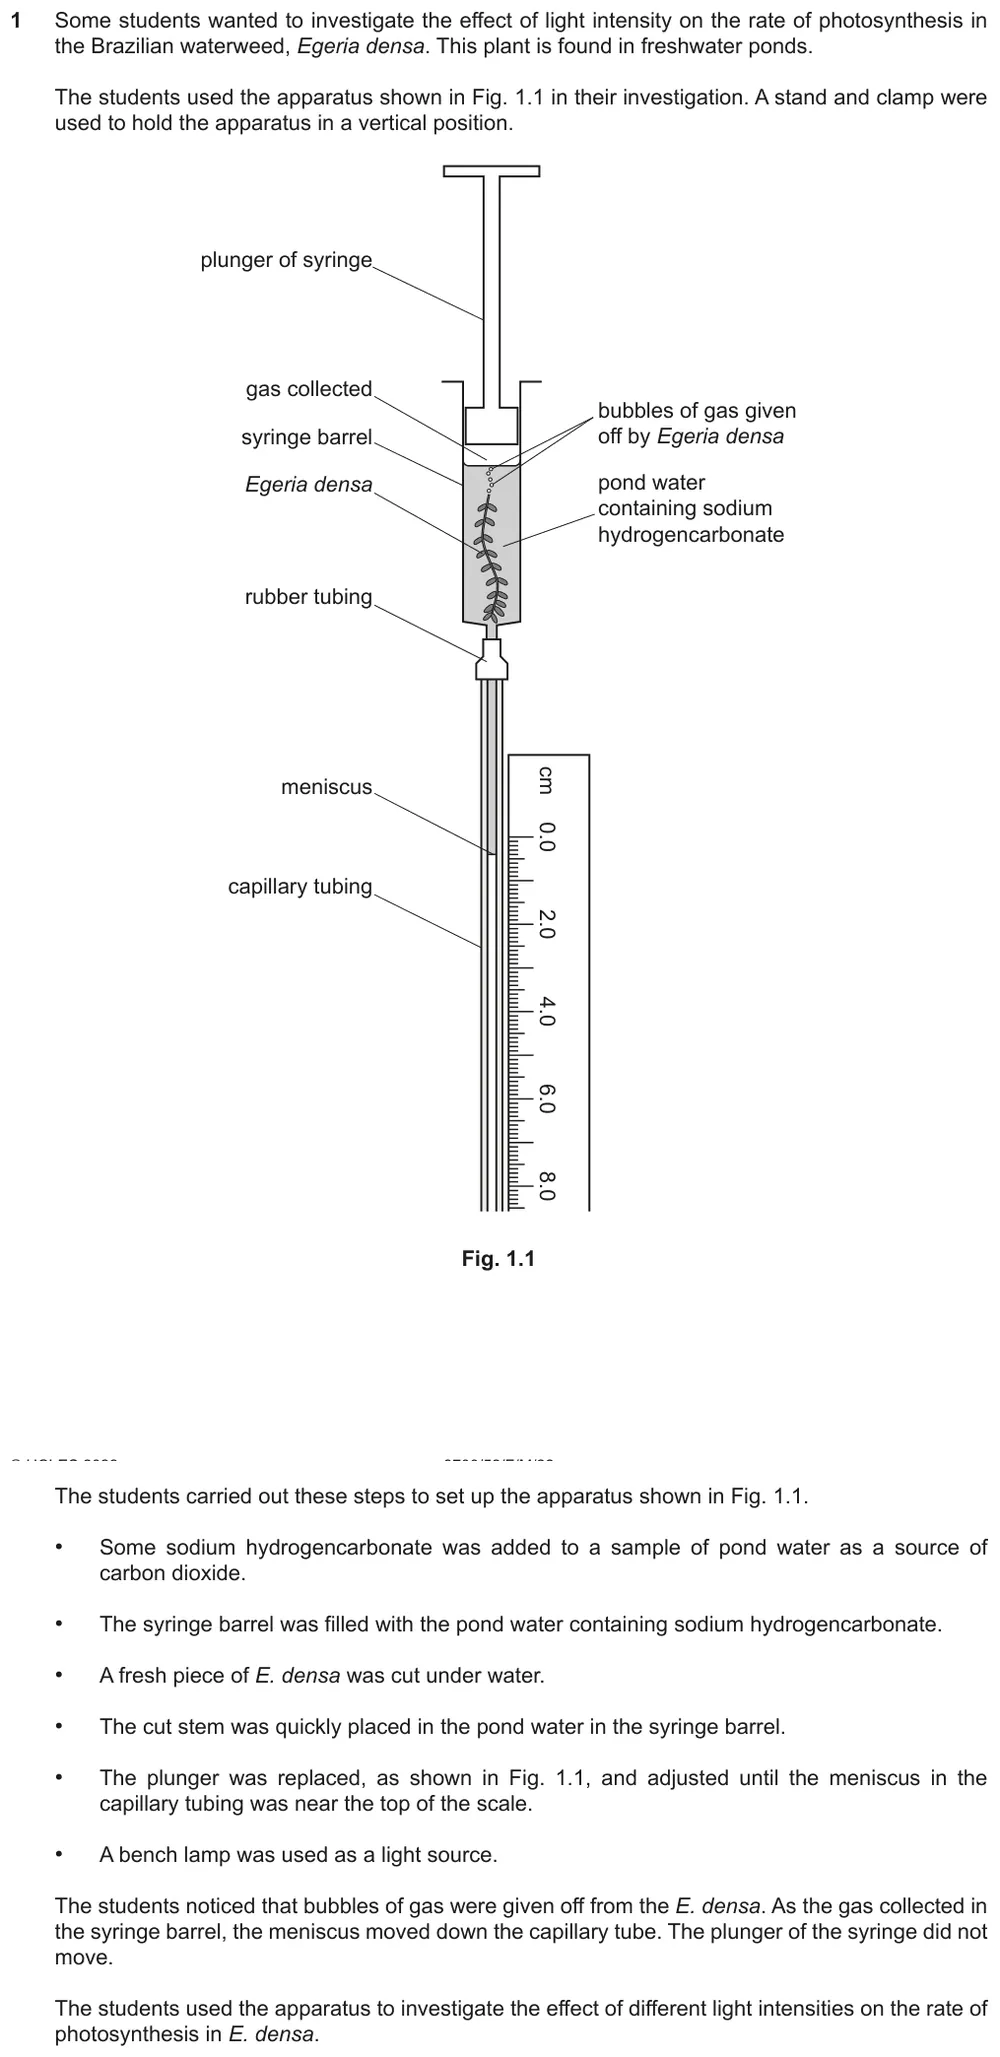
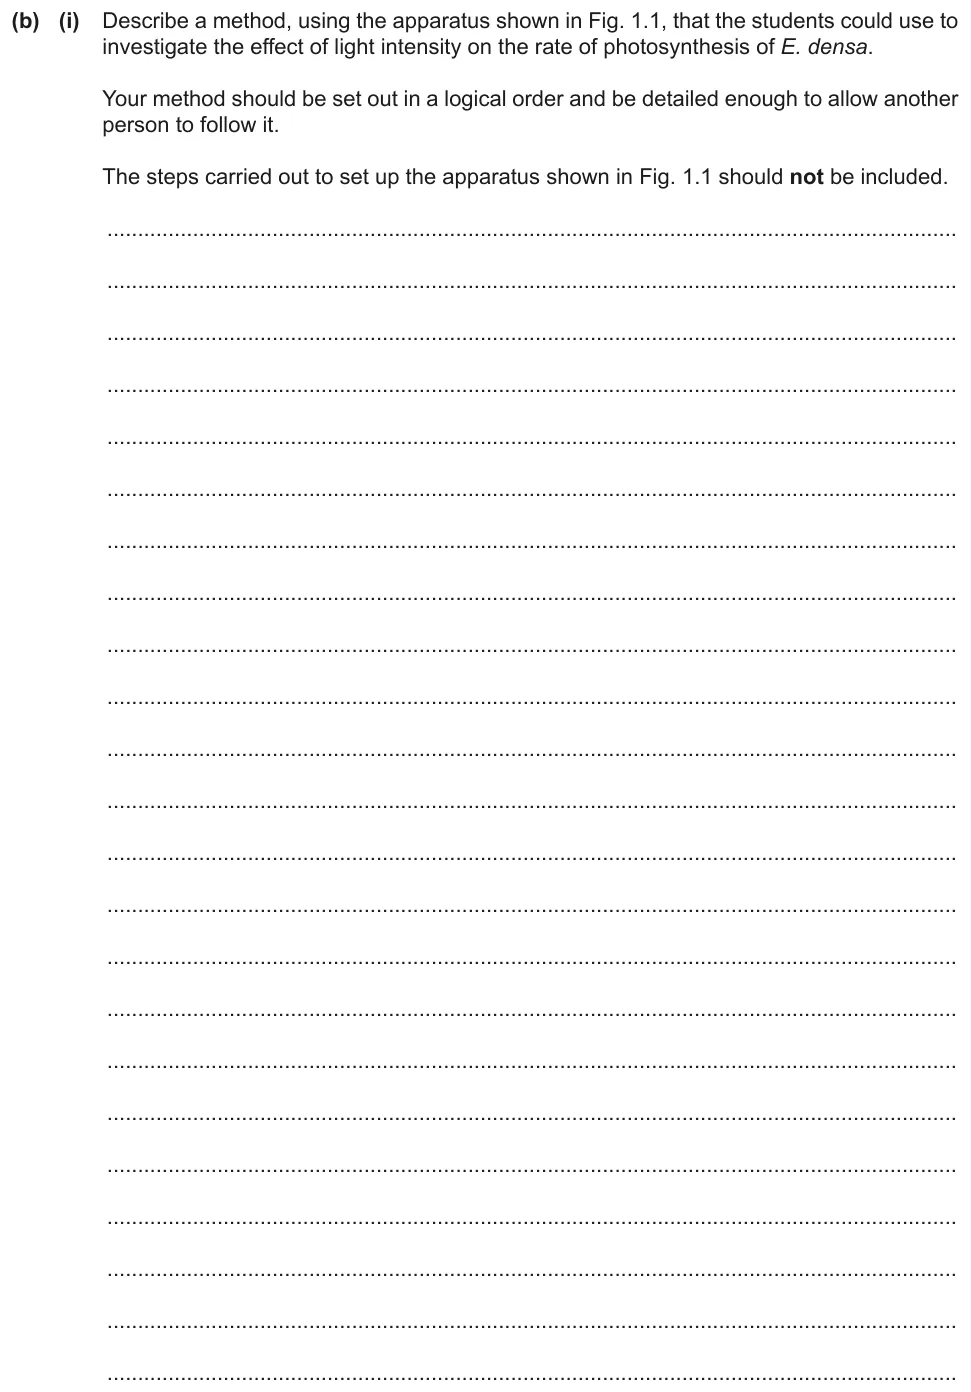
Describe a method to investigate the effect of light intensity on the rate of photosynthesis of a water plant.
Information from earlier in this question:
Show the mark scheme
Tap an image to open it full size.
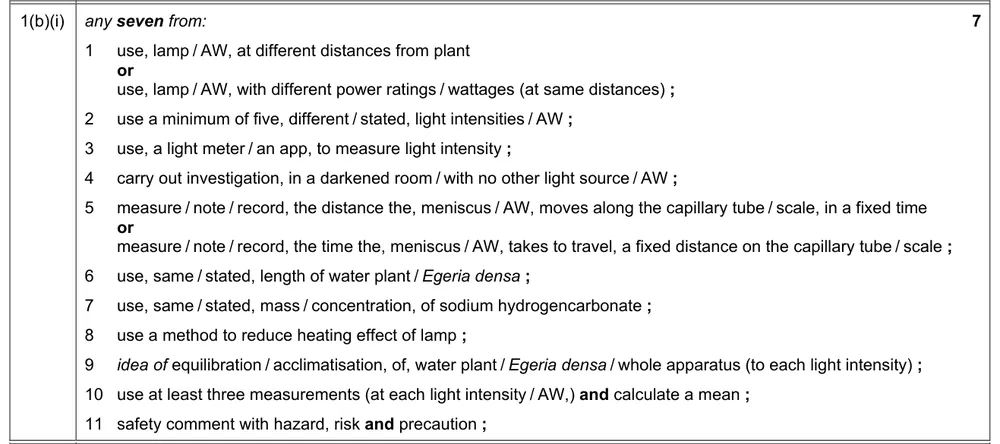
From the examiners' report: Use at least five light intensities and realistic distances from the lamp: more than 2 m, or all within 10 cm, was unrealistic. Measure the time taken as well as the distance moved by the meniscus.
Question 18
Paper 5 · February/March 2022 (52) · Q2(b)(ii) · 2 marks · Hard
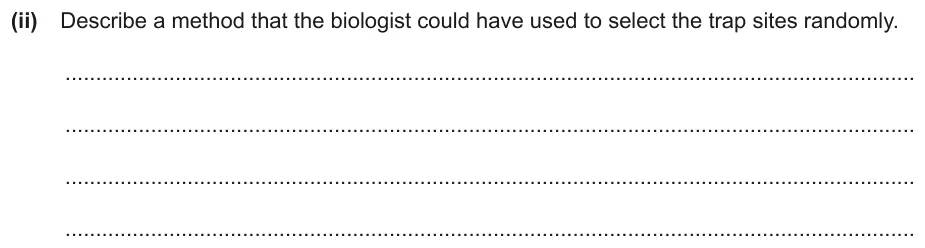
Describe a method the biologist could have used to select the trap sites randomly.
Information from earlier in this question:
Show the mark scheme

Tap an image to open it full size.
From the examiners' report: Map out a grid, then use random numbers to select the coordinates of each trap site. The order matters: choosing a site first and then giving it a random number is wrong, and so is throwing traps or markers.
Question 19
Paper 5 · May/June 2022 (52) · Q1(b)(i) · 7 marks
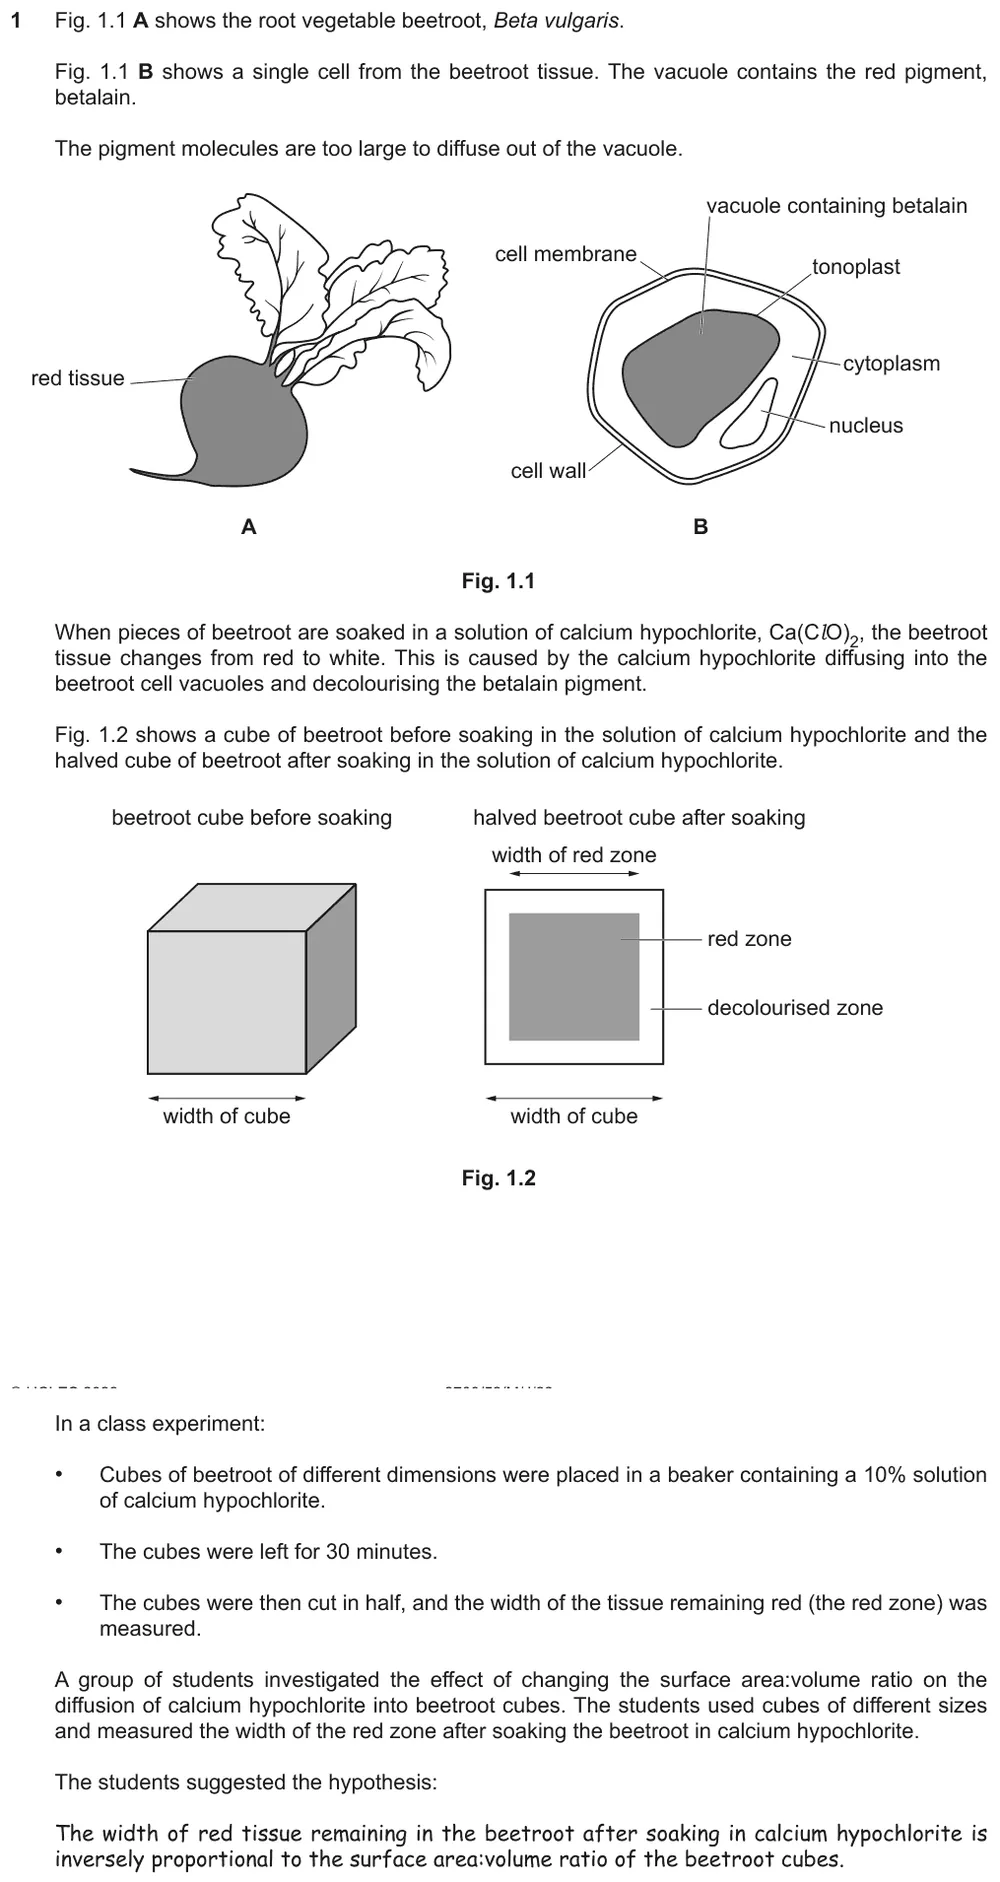
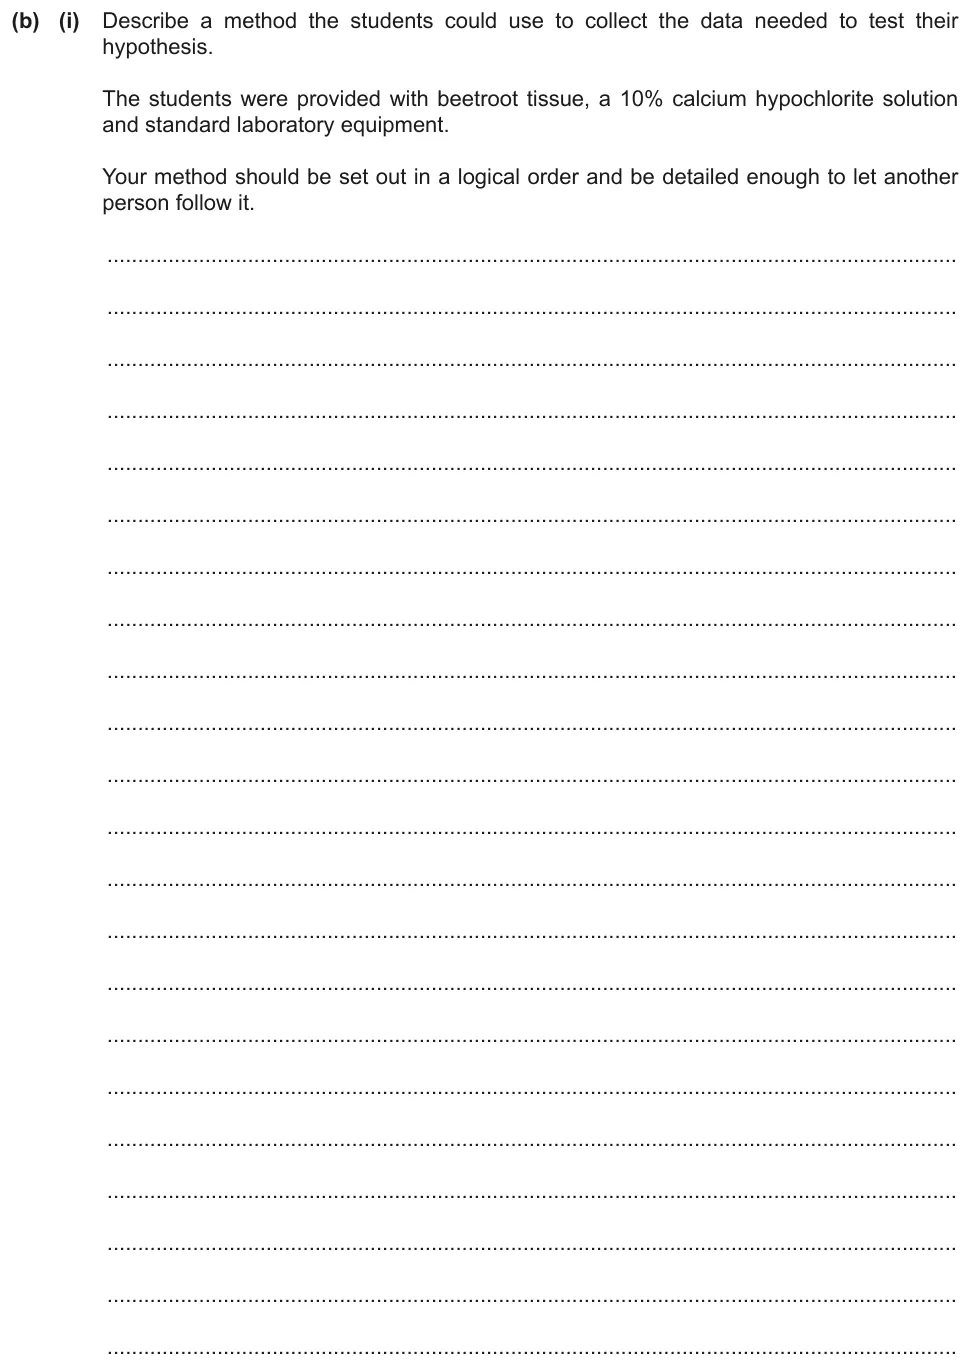
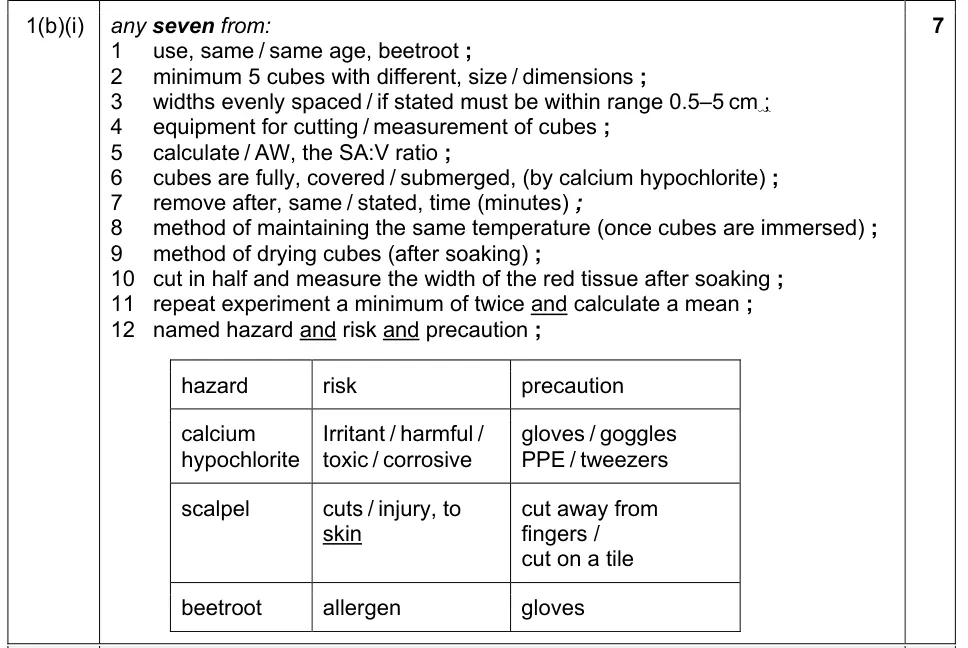
Describe a method to test the hypothesis about the surface area to volume ratio of beetroot cubes.
Information from earlier in this question:
Show the mark scheme
Tap an image to open it full size.
From the examiners' report: Do not repeat details given in the question, or describe at length how to cut the cubes. Five cube sizes with widths between 0.5 cm and 5 cm were sensible. The cubes need to be fully submerged for a fixed time and kept at a constant temperature in a thermostatically controlled water-bath.
Question 20
Paper 5 · October/November 2023 (52) · Q1(d) · 7 marks
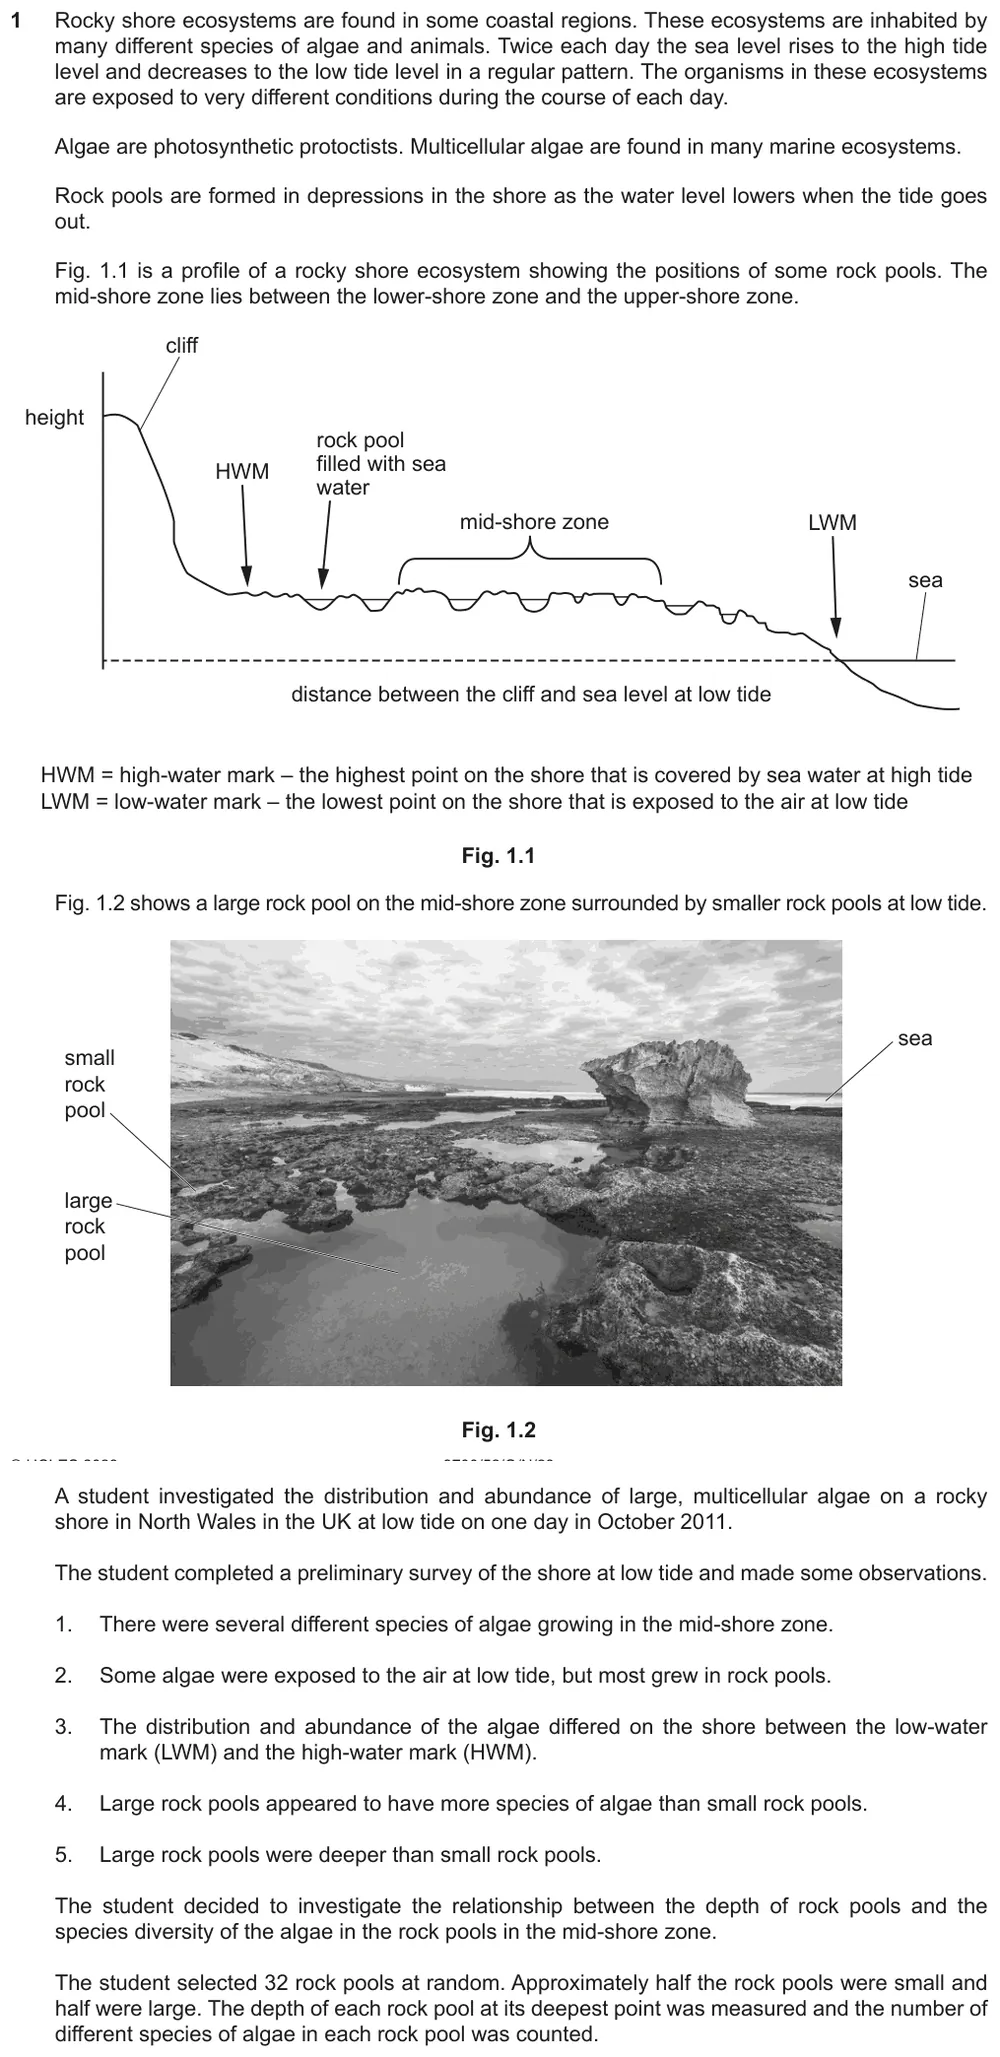
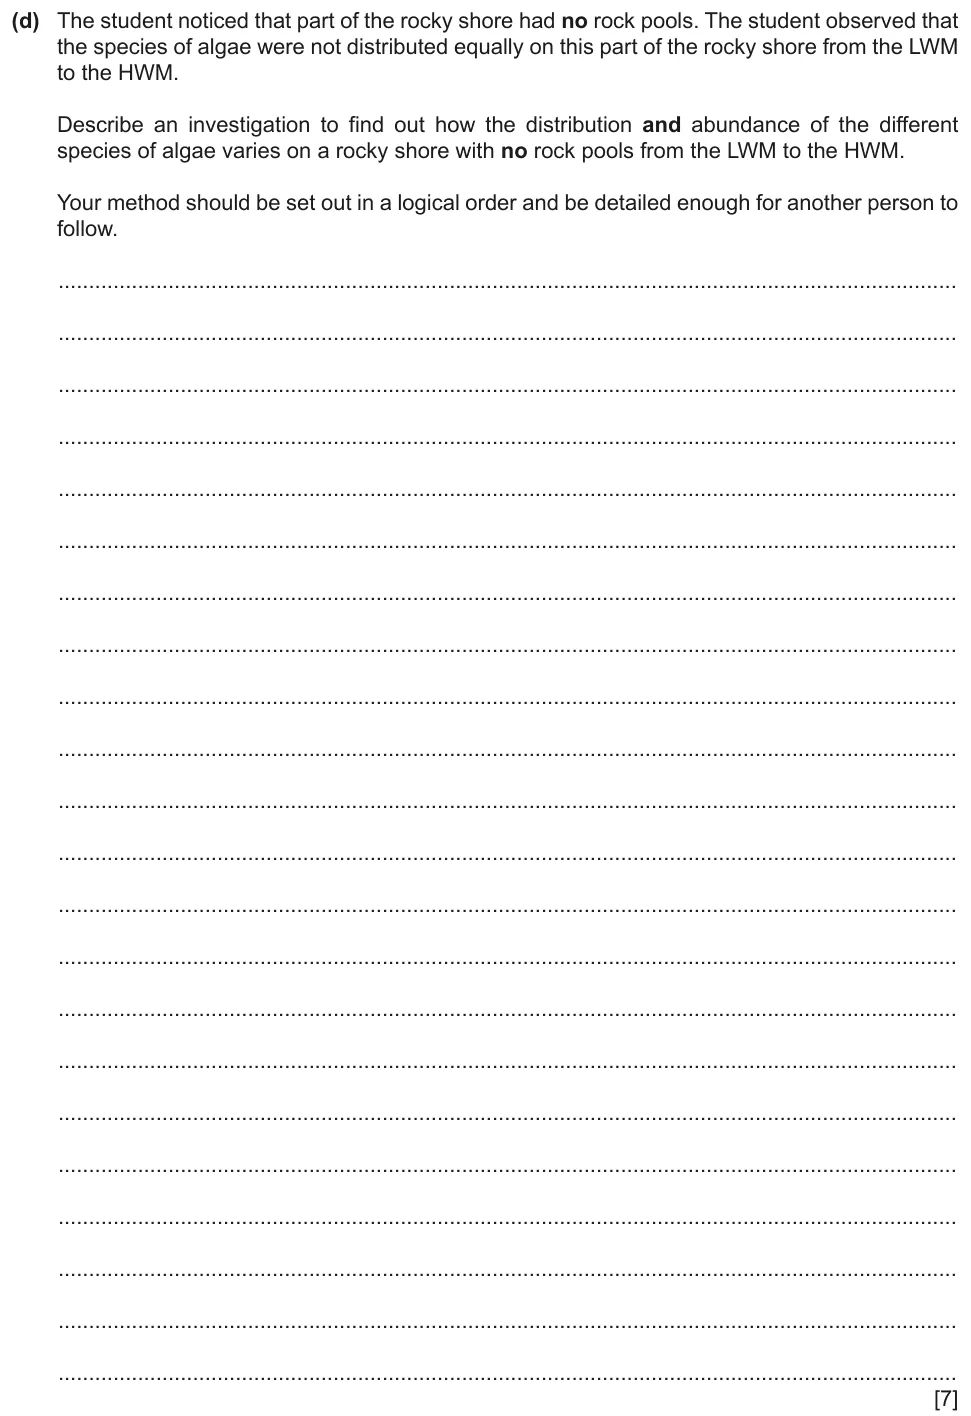
Describe an investigation of the distribution and abundance of algae from the low-water mark to the high-water mark of a rocky shore.
Information from earlier in this question:
Show the mark scheme
Tap an image to open it full size.
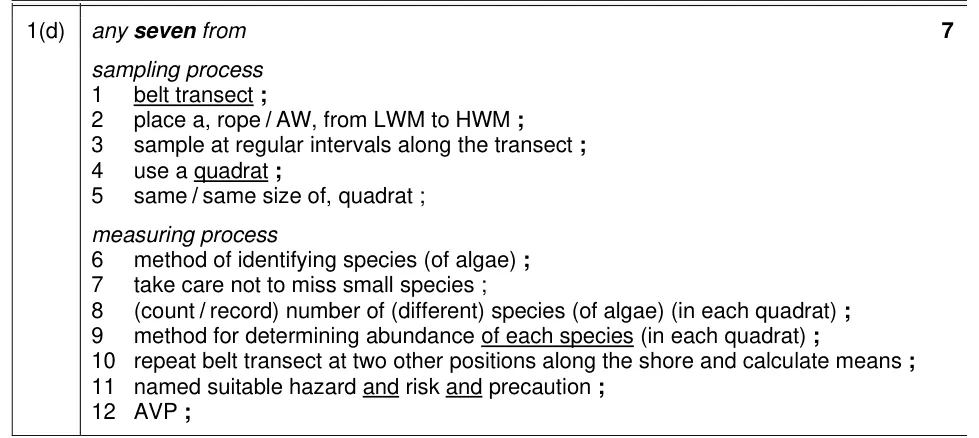
From the examiners' report: Use a belt transect from the low-water mark to the high-water mark, with quadrats at regular intervals: random sampling does not show how the algae change along the shore. Count the number of different species in each quadrat, and repeat the transect at different positions along the shore.
Question 21
Paper 5 · February/March 2025 (52) · Q1(c)(ii) · 7 marks · Easy
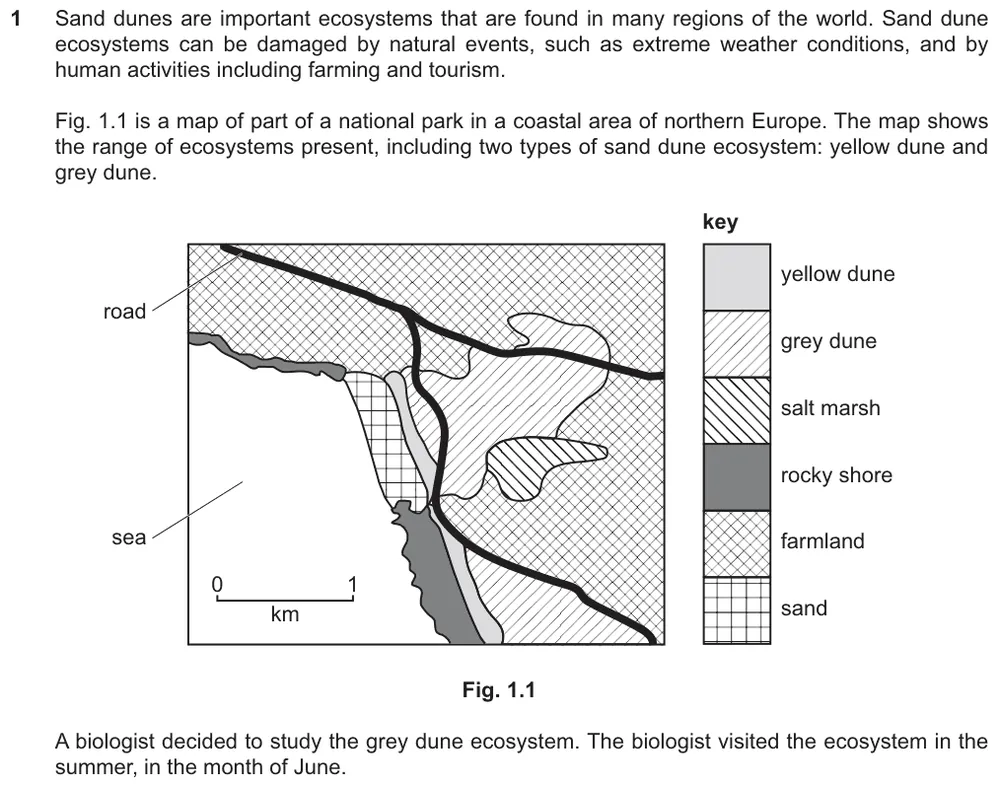
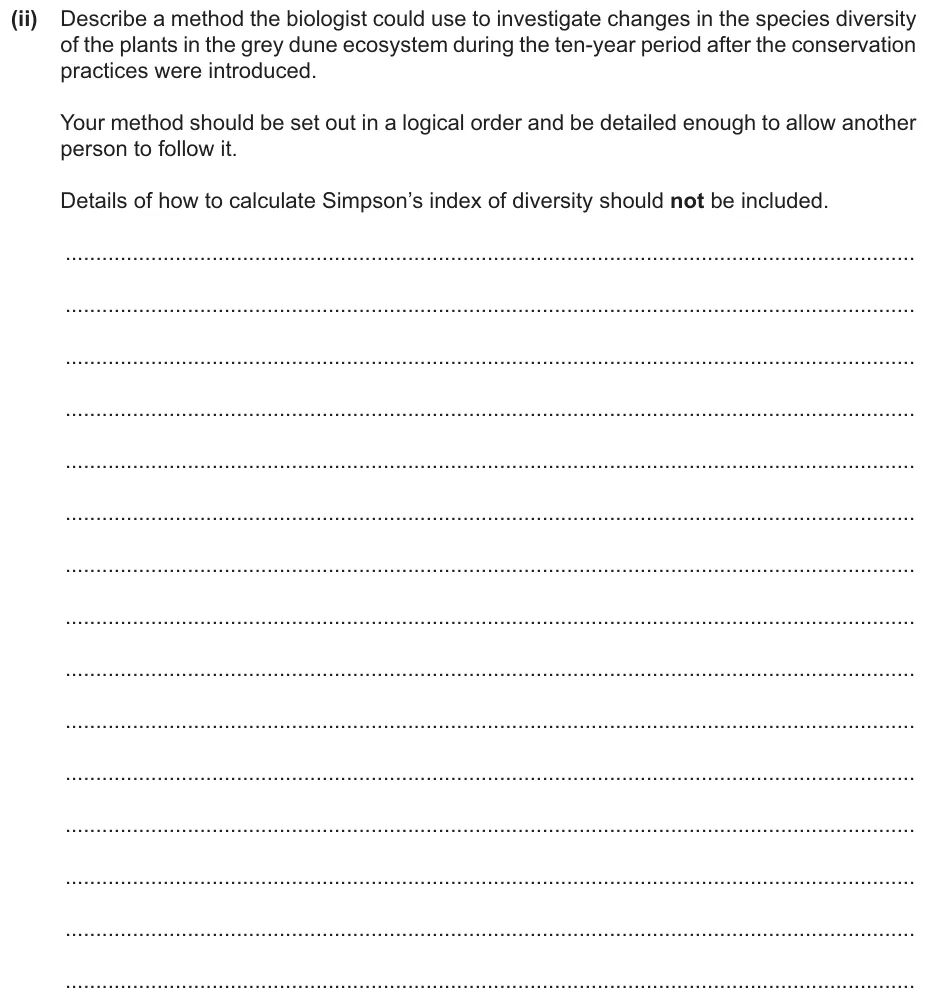
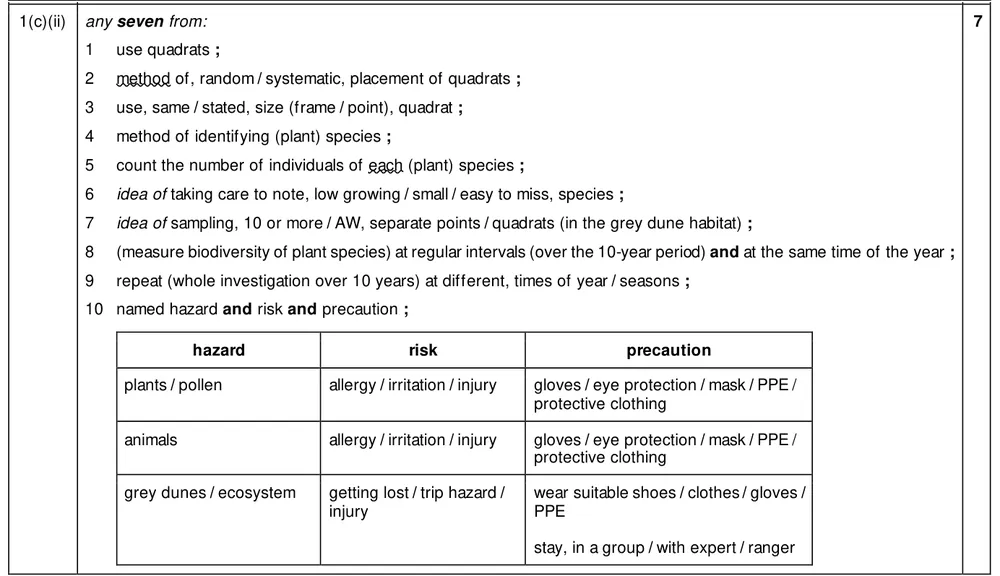
Describe a method to investigate changes in the species diversity of plants over a ten-year period.
Information from earlier in this question:

Show the mark scheme
Tap an image to open it full size.
From the examiners' report: Write quadrats, not 'quadrants', and give a suitable size: less than 0.5 m by 0.5 m is too small, and more than 2 m by 2 m is impractical. Repeat by sampling new quadrats, not by counting the same quadrats again, and sample every year at the same time of year.
Risk assessment (P5 2)
Question 22
Paper 5 · May/June 2023 (52) · Q2(a)(ii) · 2 marks
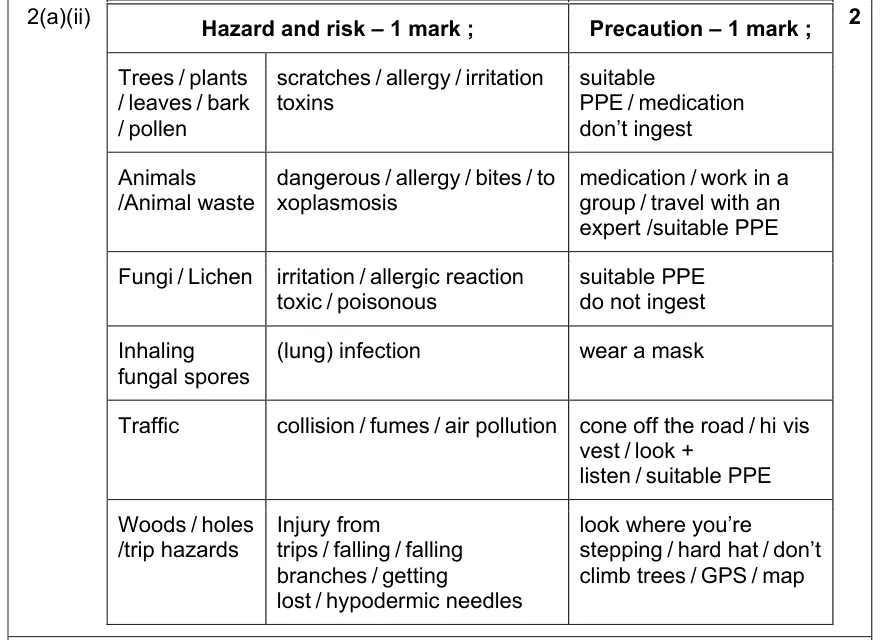
State one risk, and the safety precaution to take, when measuring the abundance of lichens on tree trunks.
Information from earlier in this question:
Show the mark scheme
Tap an image to open it full size.
From the examiners' report: Identify a hazard, the risk that hazard poses and a precaution that fits it. 'Wear gloves' or 'wear a mask' did not always match the risk given, and 'harmful' and 'infectious' were too general to gain credit.
Where students lose marks (from Cambridge examiners' reports and mark schemes)
Each point below comes from the examiners' reports and mark schemes, and is followed by wording that gained marks.
The undergrowth is not the variable. Students wrote a full sentence beginning 'The undergrowth', or referred to alien or indigenous species without mentioning trees.
✔ Gains credit: 'species of tree' or 'type of tree'.
Vaccinated or not vaccinated. Students gave 'vaccination against Rotavirus' as the independent variable, which was too vague without further qualification.
✔ Gains credit: independent variable 'vaccinated or not vaccinated'; dependent variable 'number of children with (type 1) diabetes'.
A control is not a control variable. Students described a variable that is kept constant when the question asked for a control.
✔ Gains credit: 'replace' the water plant with a 'dead' water plant 'of the same volume', or with 'sterile', 'inert' material or 'glass beads'.
Two standardised variables, not a list. Students described the grid from the information given, or wrote lists of variables in which incorrect suggestions cancelled correct ones.
✔ Gains credit: 'type' or 'species of tree', 'height (of grid) above ground', 'side' or 'aspect of tree', 'age' or 'size of tree'.
Describe both dilutions, with units. Students gave no units or the wrong units, or described one dilution and wrote 'repeat the opposite' for the other.
✔ Gains credit: for 7.5 mg cm-3, '37.5' cm3 of stock solution and '12.5' cm3 of distilled water; for 2.5 mg cm-3, '12.5' cm3 of stock solution and '37.5' cm3 of water.
Distance moved needs a time. Students measured the distance moved by the meniscus without measuring the time taken, or suggested unrealistic distances between the lamp and the plant.
✔ Gains credit: 'a minimum of five' light intensities; the distance the meniscus 'moves along the capillary tube' 'in a fixed time'; 'at least three measurements' 'and calculate a mean'.
A belt transect shows distribution. Students suggested random sampling, counted 'the algae' instead of the number of different species, or repeated 'the whole experiment' three times.
✔ Gains credit: 'belt transect'; place a 'rope' 'from LWM to HWM'; 'sample at regular intervals along the transect'; 'repeat belt transect at two other positions along the shore and calculate means'.
Match the precaution to the risk. Students gave general precautions such as wearing gloves, a mask or goggles that did not fit the risk they had identified, or called something 'harmful' or 'infectious'.
✔ Gains credit: hazard, risk and precaution that go together, such as 'traffic', 'collision' and 'hi vis vest', or 'inhaling fungal spores', '(lung) infection' and 'wear a mask'.
Download the questions
Download the PDF pack (22 questions, mark schemes at the end)
Keep practising
- Paper 5: Data and Statistics: Cambridge (CIE) Paper 5 exam questions
- Paper 5: Conclusions and Evaluation: Cambridge (CIE) Paper 5 exam questions
- How Cambridge (CIE) A level Biology Paper 5 is marked: planning, analysis and evaluation
- Cambridge (CIE) A level Biology 9700 past papers, mark schemes and examiners' reports
- Cambridge (CIE) A level Biology grade thresholds
- Book a one-to-one CIE lesson or a free 15-minute discovery chat with Tom
- Register your interest in a CIE A level Biology group class
Questions, mark schemes and examiners' report extracts © Cambridge University Press & Assessment.