

Paper 5: Data and Statistics: Cambridge (CIE) A Level Biology 9700 Exam Questions
Dealing with data is the analysis part of Paper 5, Planning, Analysis and Evaluation, in the Cambridge International AS & A Level Biology syllabus (9700). Paper 5 is a written A level paper worth 30 marks. You need to carry out calculations such as means, percentage changes and rates, complete tables and plot graphs, and use standard deviation, standard error and 95% confidence intervals. You also need to recognise different types of data, choose a statistical test and justify the choice, and state a null hypothesis. The questions on this page use the t-test, the chi-squared test, Spearman's rank correlation and Pearson's linear correlation.
The examiners' reports show where the marks go. Show your working, and say whether a percentage change is an increase or a decrease. Take an initial rate from the straight section at the start of the line. When you describe how to calculate a percentage, remember to multiply by 100. A null hypothesis for a correlation says that there is no correlation; a null hypothesis for a t-test says that there is no difference between the means. To justify a test, say what kind of data you have, and refer to the scatter diagram if the relationship is linear.
Studying Cambridge International A level Biology and want more help? Tom teaches CIE students one-to-one online, including students in the UAE, Saudi Arabia, Hong Kong, India and Indonesia, and every lesson is recorded. You can book a one-to-one lesson or a free 15-minute discovery chat, or register your interest in a CIE group class starting in September 2027, using the links at the bottom of this page.
What you need before you start
Each question on this page assumes you're secure on these ideas. If any of them feels shaky, look it up before you start.
- A mean is the sum of the values divided by the number of values.
- Percentage change is the change divided by the original value, multiplied by 100.
- A rate is a change divided by the time taken.
- On a graph, the independent variable goes on the x-axis and the dependent variable goes on the y-axis.
Key terms
These words come up in the questions and mark schemes. Examiners expect you to use them exactly.
- Standard deviation: a measure of the spread of a set of results about the mean.
- Standard error: a measure of how close the sample mean is likely to be to the true mean; it is the standard deviation divided by the square root of the sample size.
- 95% confidence interval: the mean plus and minus two standard errors.
- Null hypothesis: the statement that a statistical test tests: that there is no difference, or no correlation.
- Continuous data: data that can take any value within a range, such as mass or length.
- Nominal data: data in named categories that have no order, such as species.
- t-test: a statistical test that compares the means of two sets of continuous data with a normal distribution.
- Correlation: a relationship between two variables; Pearson's linear correlation and Spearman's rank correlation test whether paired data are correlated.
What these questions cover (Cambridge 9700 Paper 5)
The questions test these Paper 5 skills (Planning, analysis and evaluation) from the Cambridge International AS & A Level Biology syllabus (9700) for 2025 to 2027. The syllabus expects you to be able to:
- Dealing with data (P5 3): use tables and graphs to show the key points in quantitative data; decide which calculations are necessary in order to draw conclusions; carry out appropriate calculations to simplify or explain data, including means, percentages and rates of change; use values of standard deviation or standard error, or graphs with standard error bars, to determine whether differences in mean values are likely to be statistically significant; choose and carry out statistical tests; state a null hypothesis for a statistical test; recognise the different types of variable and the different types of data presented
How to use this page
Write your answer on paper before you open the mark scheme. Allow about 1.2 minutes per mark: the 21 questions are worth 42 marks, so about 50 minutes in total. Then mark your answer strictly against the mark scheme and read the examiners' tip underneath it. If you'd rather print the questions, download the PDF pack.
Calculating percentages and rates (P5 3)
Question 1
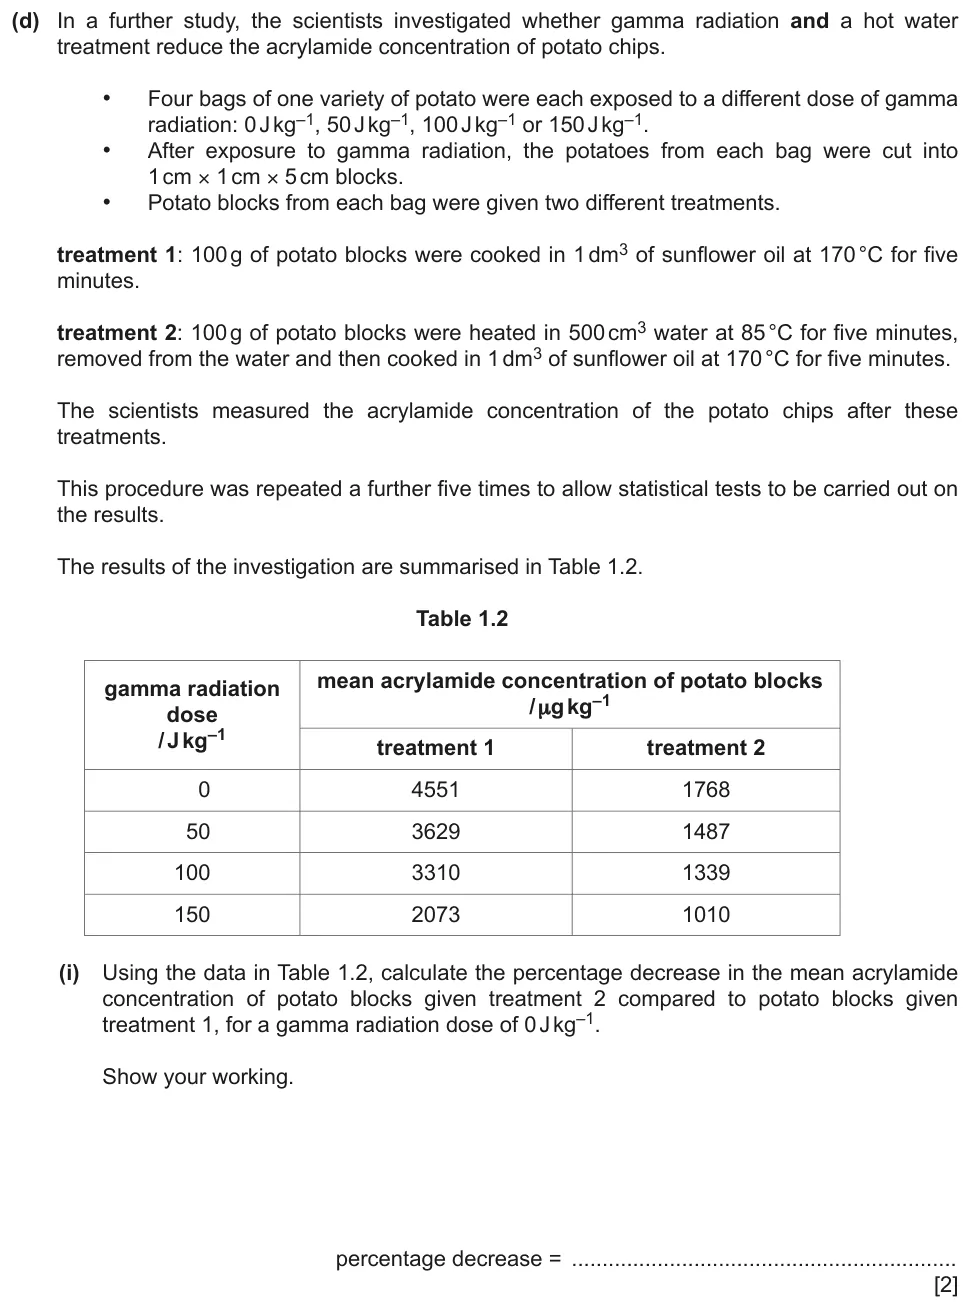
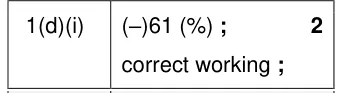
Paper 5 · February/March 2023 (52) · Q1(d)(i) · 2 marks · Easy
Calculate a percentage decrease from a table of results.
Show the mark scheme
Tap an image to open it full size.
From the examiners' report: Most students calculated the percentage decrease correctly, but not all followed the instruction to show their working.
Question 2
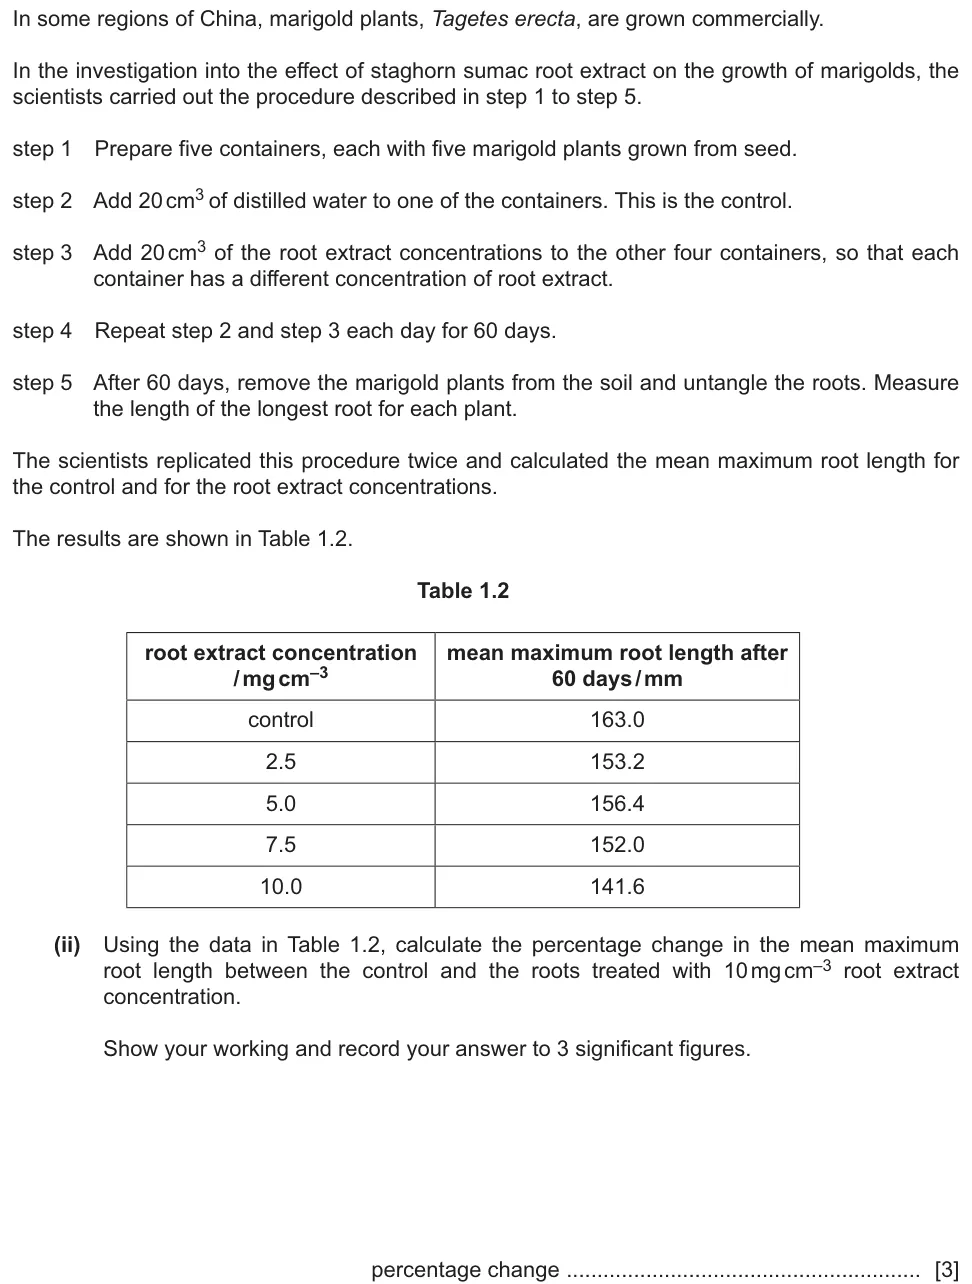
Paper 5 · May/June 2024 (52) · Q1(d)(ii) · 3 marks
Calculate a percentage change and give the answer to three significant figures.
Show the mark scheme

Tap an image to open it full size.
From the examiners' report: Many students calculated correctly and gave three significant figures, but fewer stated that the change was a decrease, −13.1%. Weaker answers used the wrong numerator or denominator.
Question 3
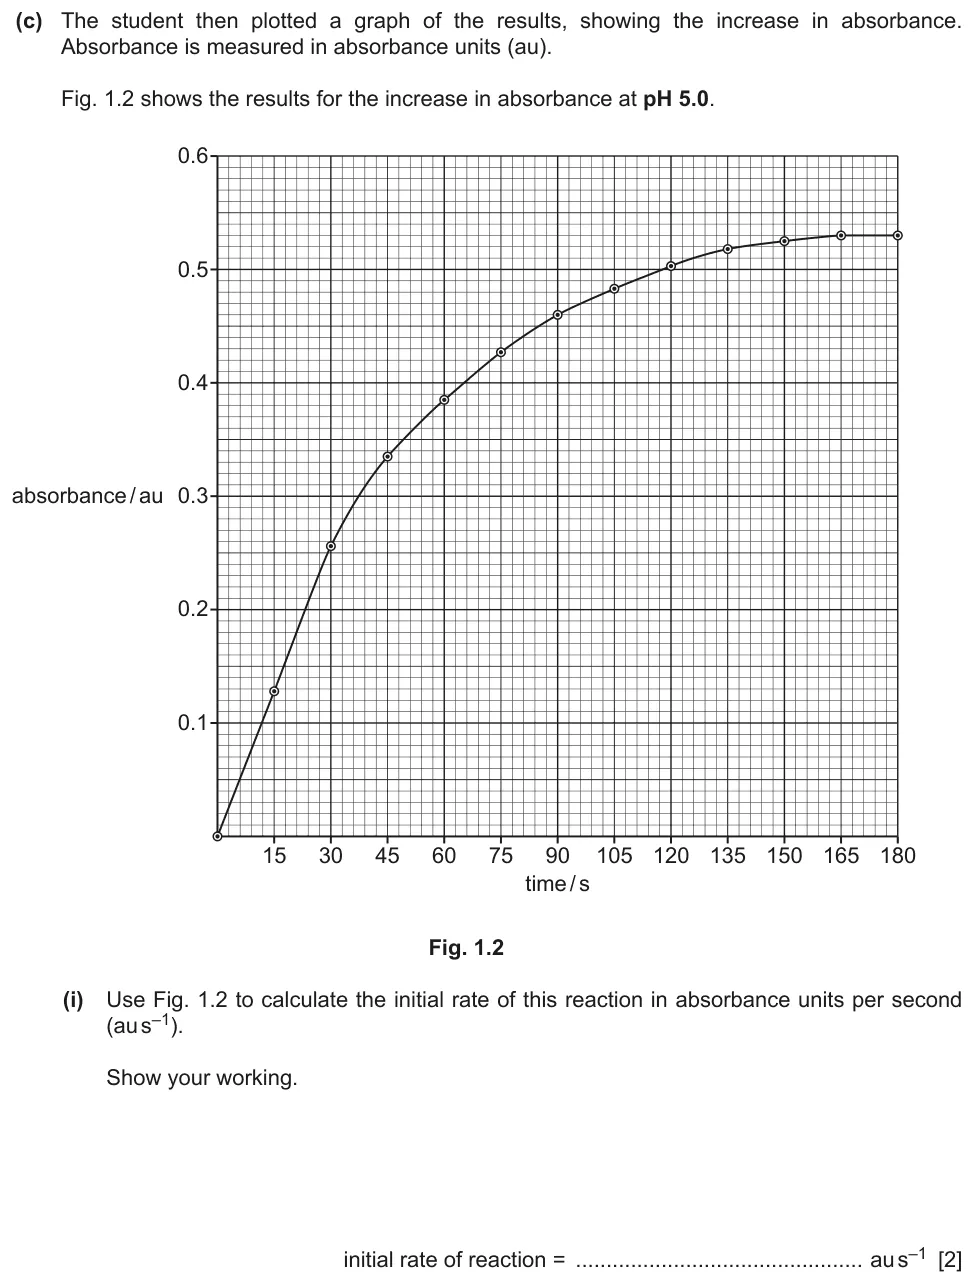
Paper 5 · May/June 2023 (52) · Q1(c)(i) · 2 marks
Use a graph to calculate the initial rate of an enzyme-catalysed reaction.
Show the mark scheme

Tap an image to open it full size.
From the examiners' report: Use the straight section of the line, from 0 to 30 s and 0 to 0.26 au, or a tangent that starts at the origin. Weaker answers used the whole graph to calculate a rate. Show on the graph where your figures come from.
Question 4
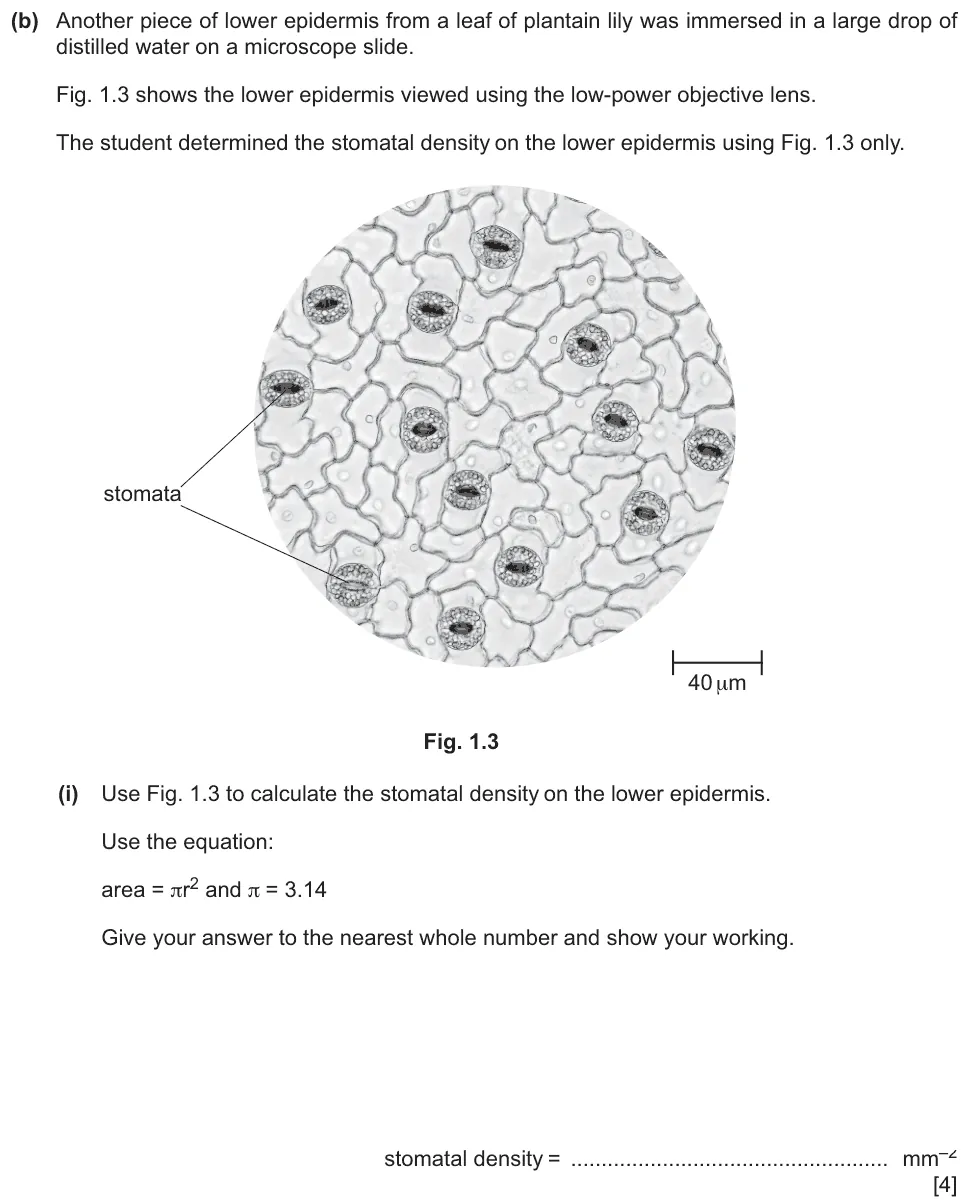
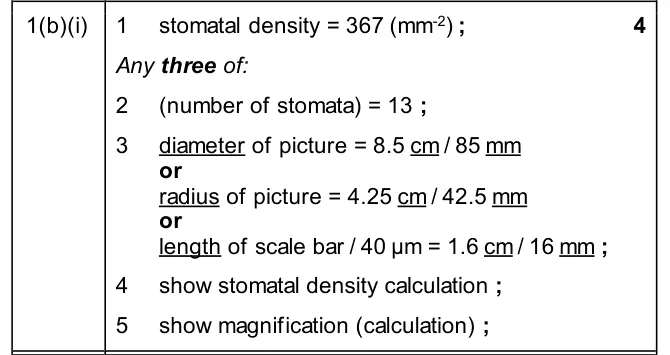
Paper 5 · October/November 2025 (52) · Q1(b)(i) · 4 marks
Calculate the stomatal density from a photomicrograph with a scale bar.
Show the mark scheme
Tap an image to open it full size.
Deciding how to process data (P5 3)
Question 5
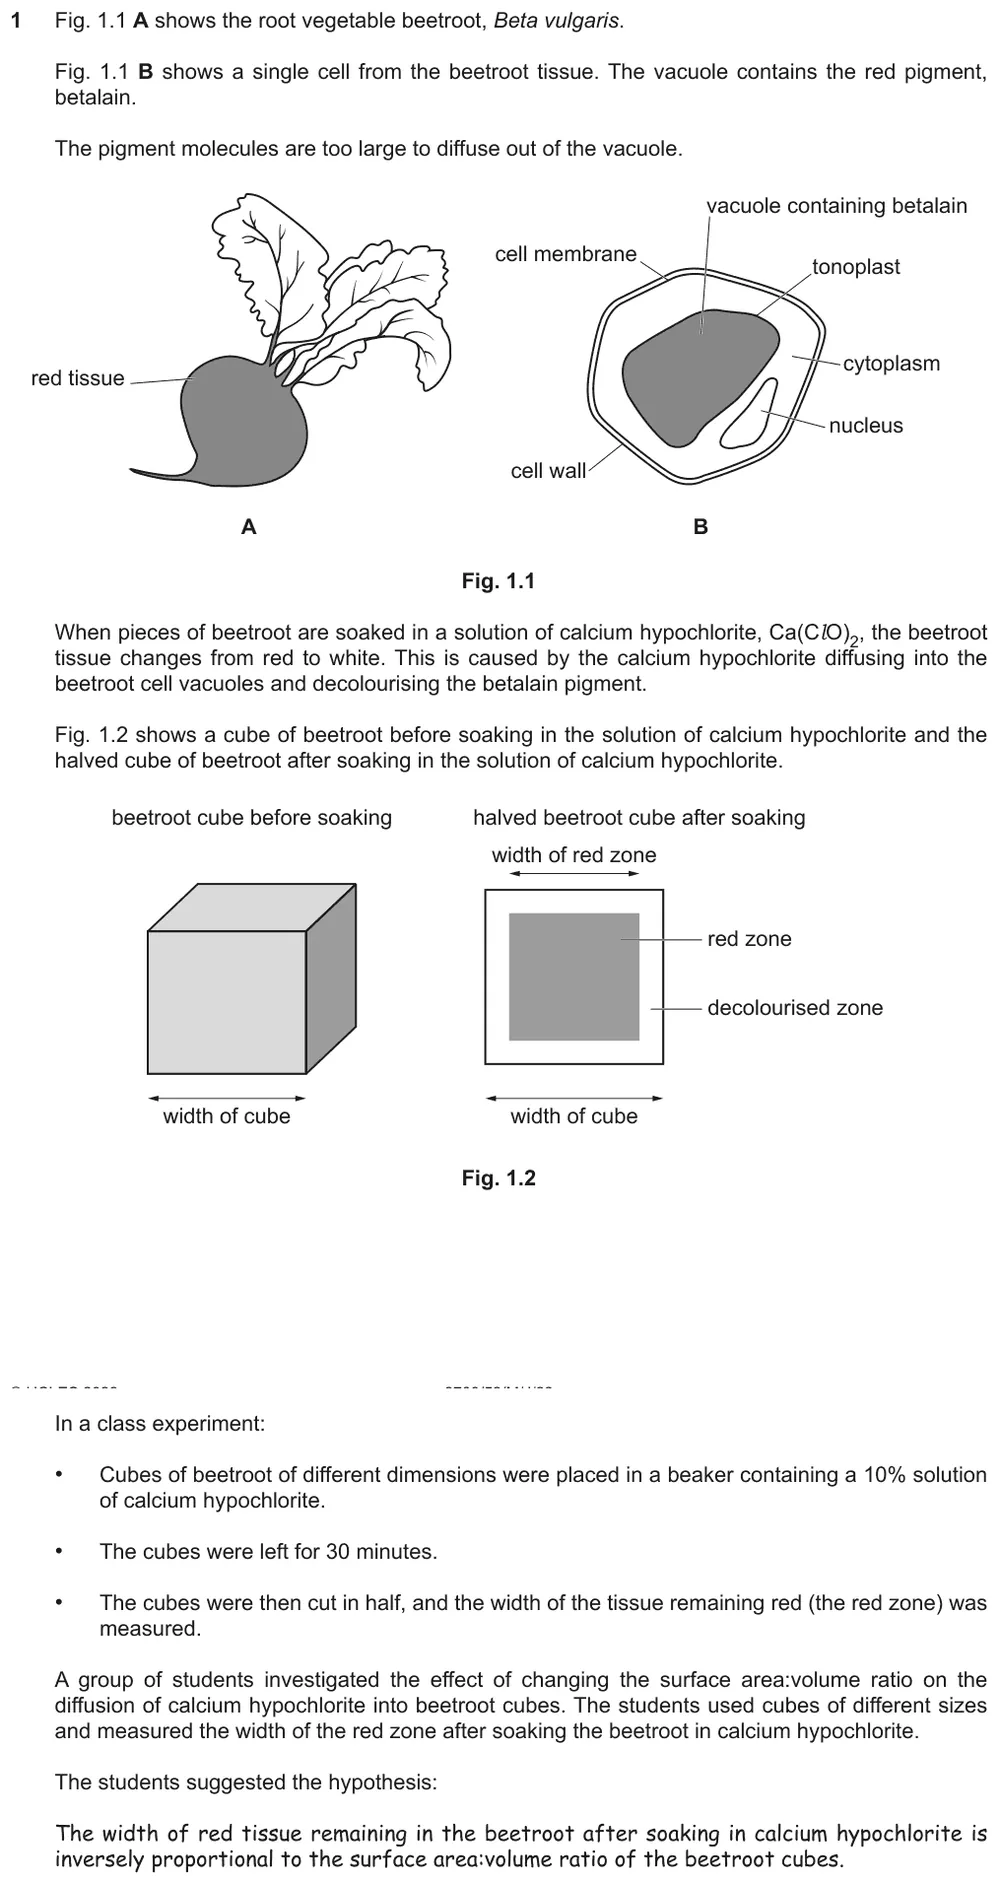
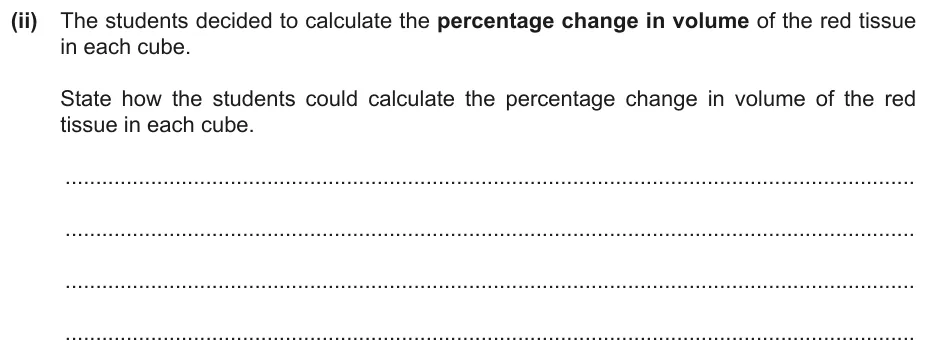
Paper 5 · May/June 2022 (52) · Q1(b)(ii) · 2 marks
State how to calculate the percentage change in volume of the red tissue in a cube.
Information from earlier in this question:
Show the mark scheme

Tap an image to open it full size.
From the examiners' report: Give an equation, or clear steps, that include the subtraction, the division and the multiplication. Many answers did not mention multiplying by 100.
Question 6
Paper 5 · May/June 2022 (52) · Q2(b)(i) · 2 marks
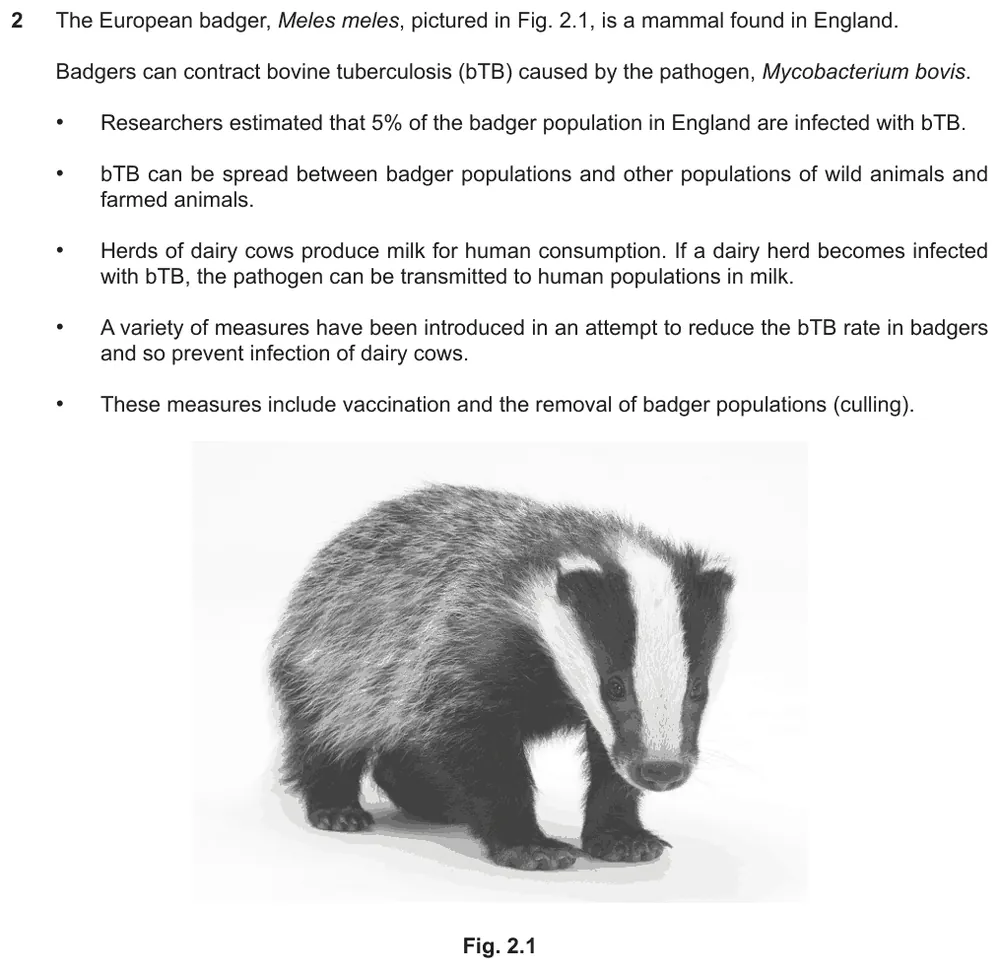
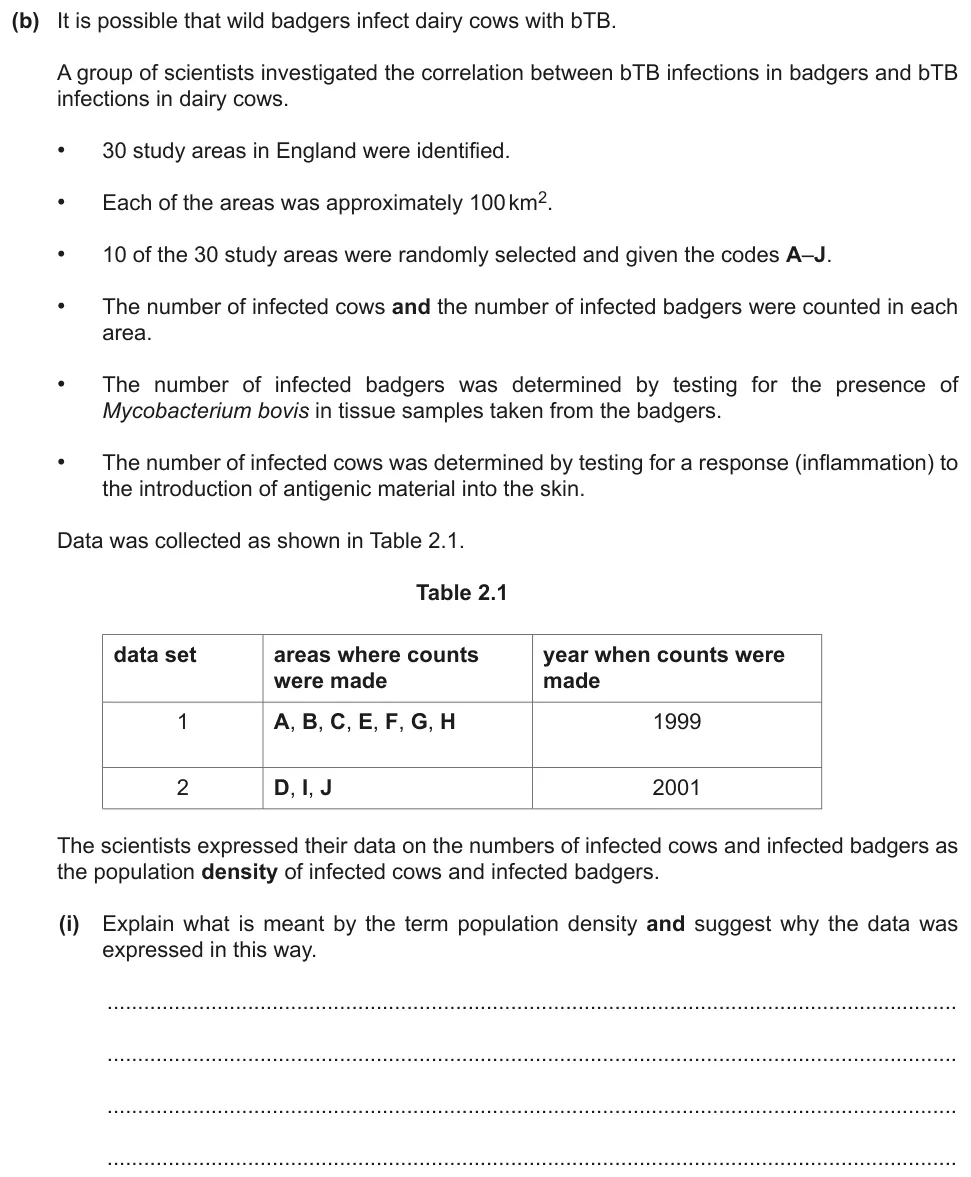
Explain what population density means and suggest why the data were expressed in this way.
Information from earlier in this question:
Show the mark scheme

Tap an image to open it full size.
From the examiners' report: Population density is the number of a single species per unit area, so the numbers of cows and badgers cannot be combined. 'Making the data easier to analyse' was too vague: say that it allows valid comparisons to be made.
Standard deviation, standard error and confidence intervals (P5 3)
Question 7
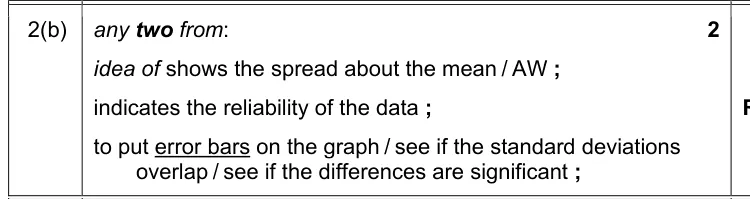
Paper 5 · February/March 2018 (52) · Q2(b) · 2 marks · Hard
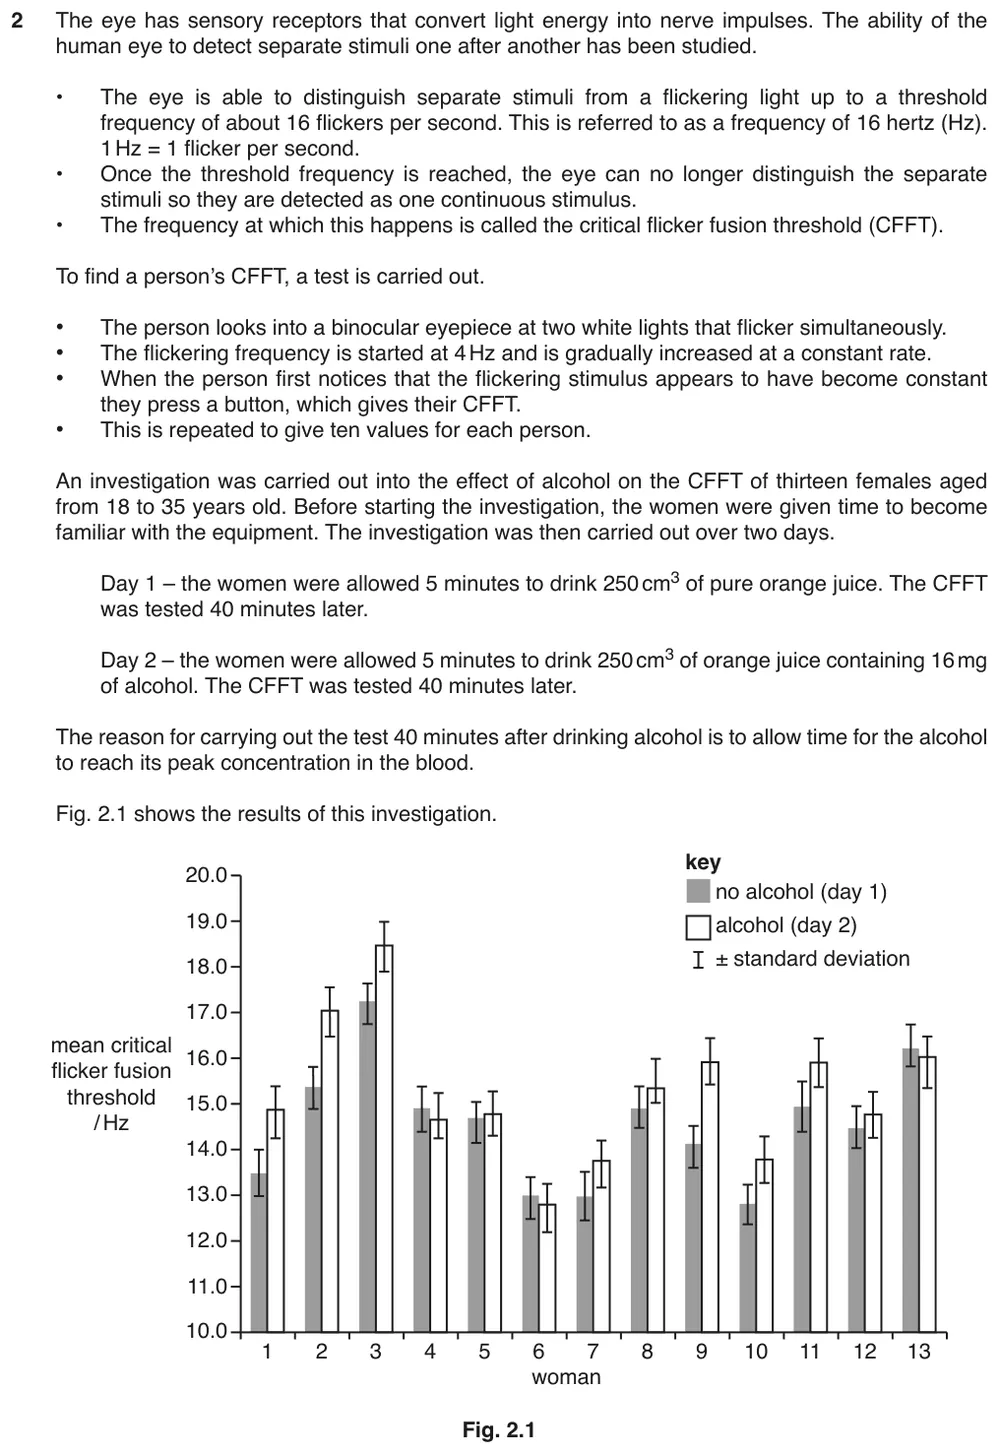
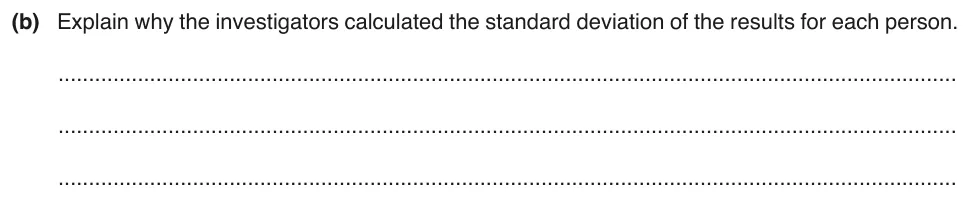
Explain why the standard deviation of the results was calculated for each person.
Information from earlier in this question:
Show the mark scheme
Tap an image to open it full size.
From the examiners' report: Few students understood why standard deviations are calculated. 'A range of values' did not gain credit without a reference to the mean.
Question 8
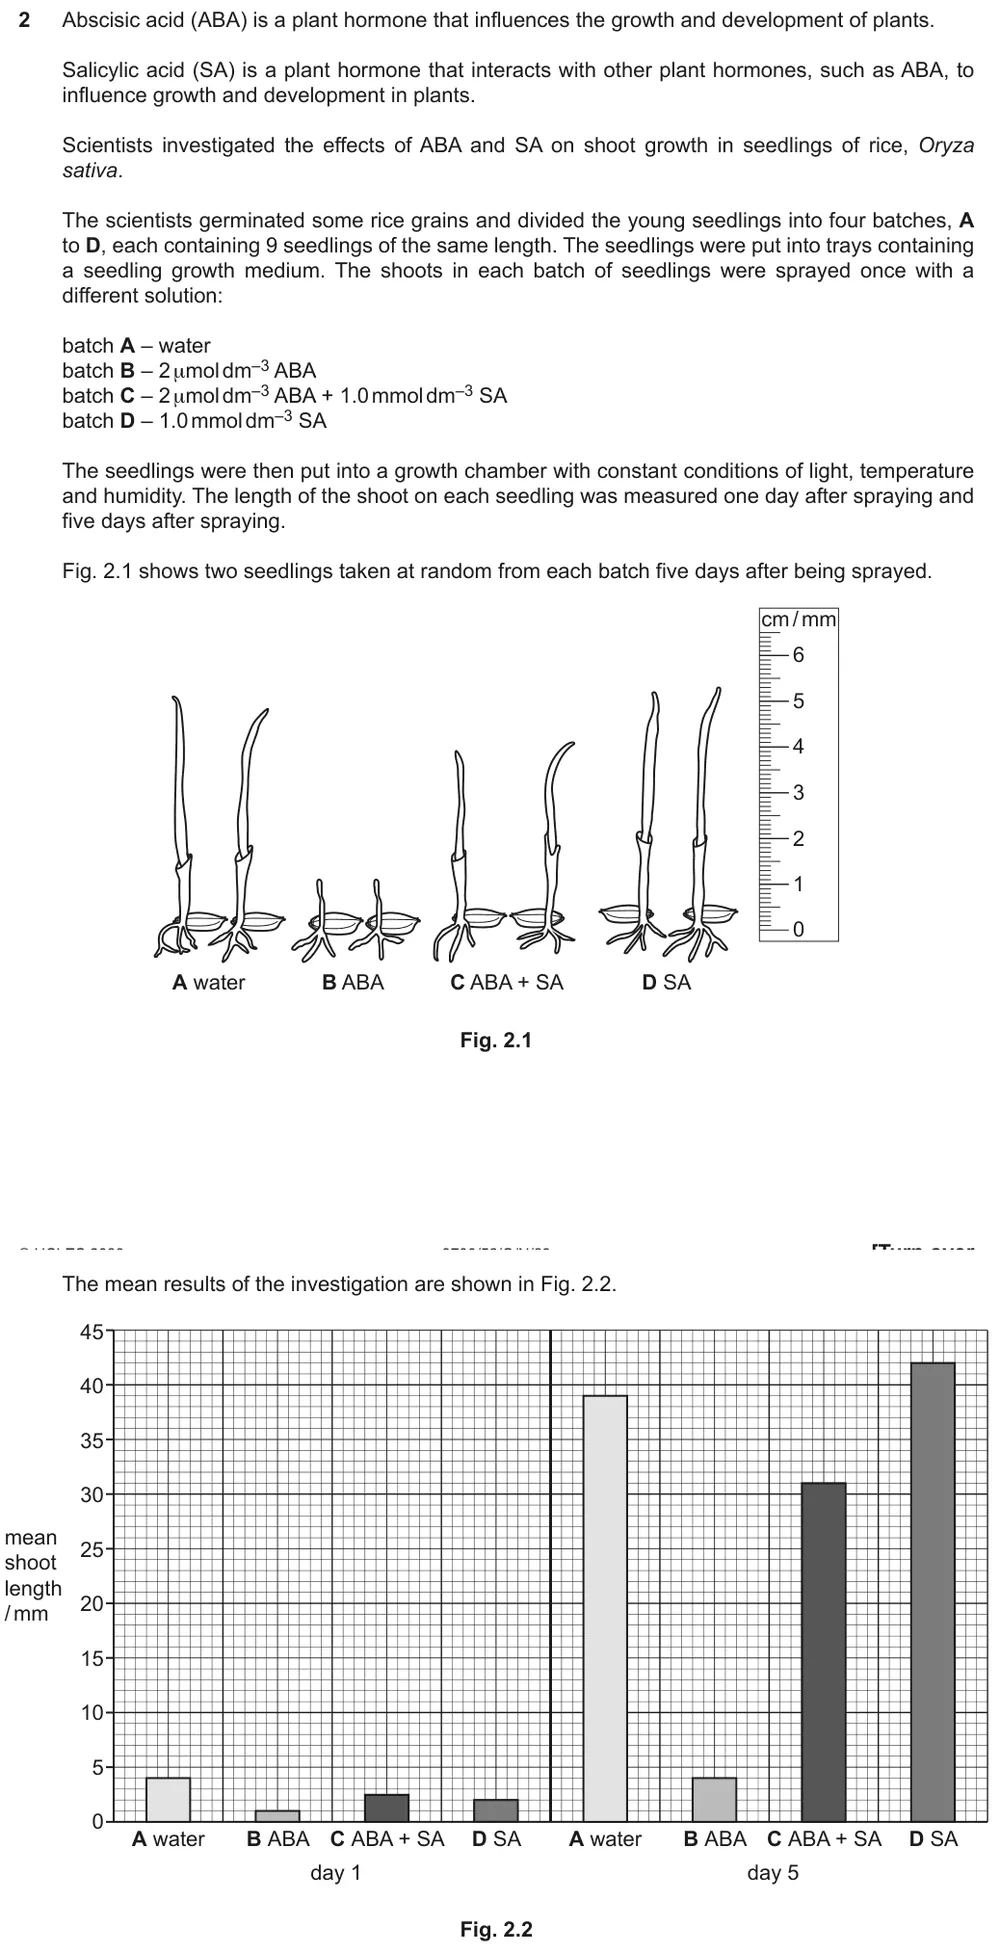
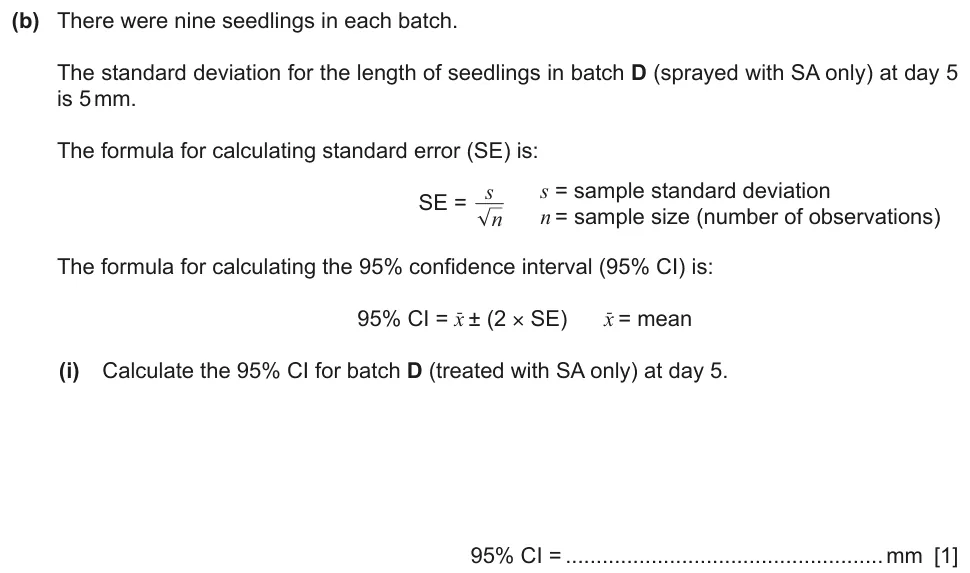
Paper 5 · October/November 2023 (52) · Q2(b)(i) · 1 mark
Calculate a 95% confidence interval, using a mean read from a bar chart.
Information from earlier in this question:
Show the mark scheme

Tap an image to open it full size.
From the examiners' report: Read the mean shoot length from the graph and calculate the standard error first. Give the answer as 42 ± 3.3, or give both ends of the interval: both values were needed.
Question 9
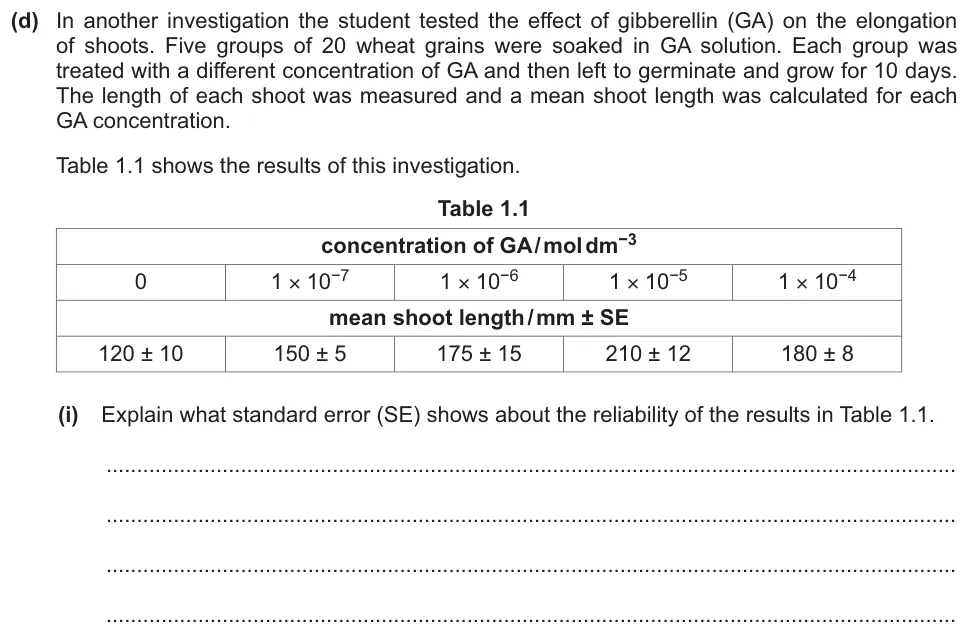
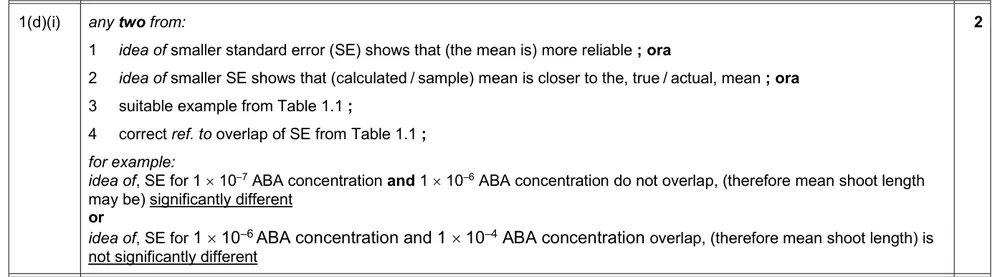
Paper 5 · May/June 2025 (54) · Q1(d)(i) · 2 marks
Explain what the standard error shows about the reliability of the results in a table.
Show the mark scheme
Tap an image to open it full size.
Tables and graphs (P5 3)
Question 10
Paper 5 · May/June 2024 (53) · Q1(b)(i) · 2 marks · Easy
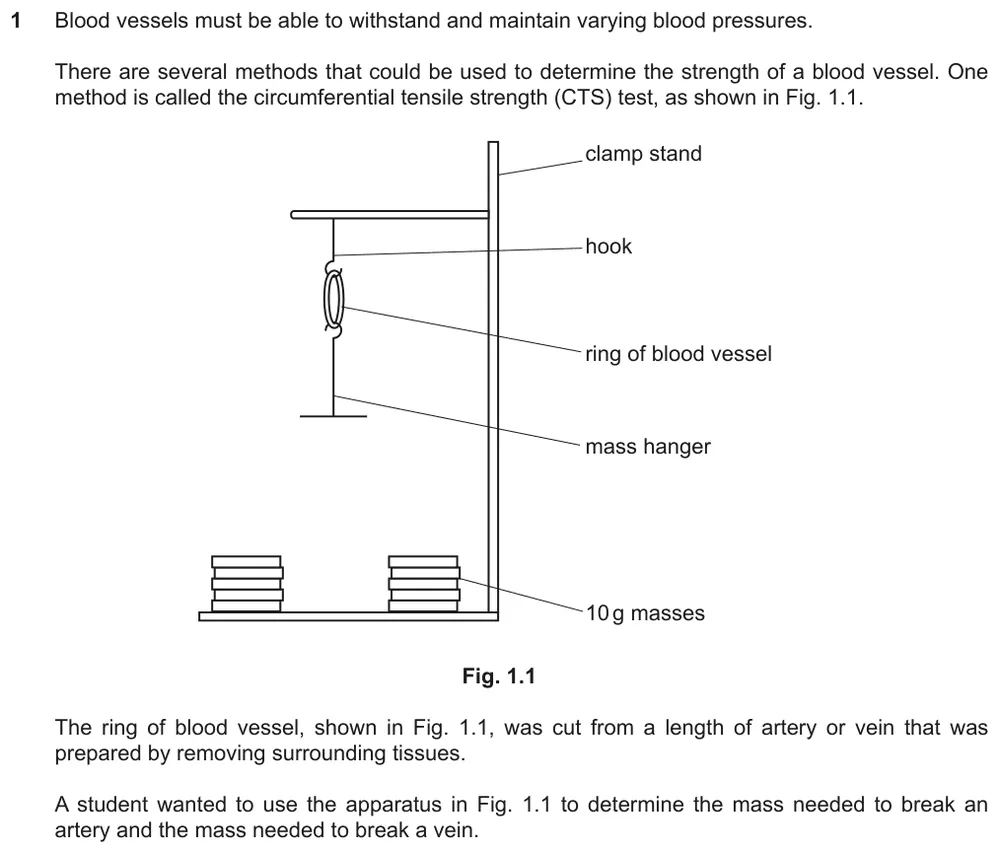
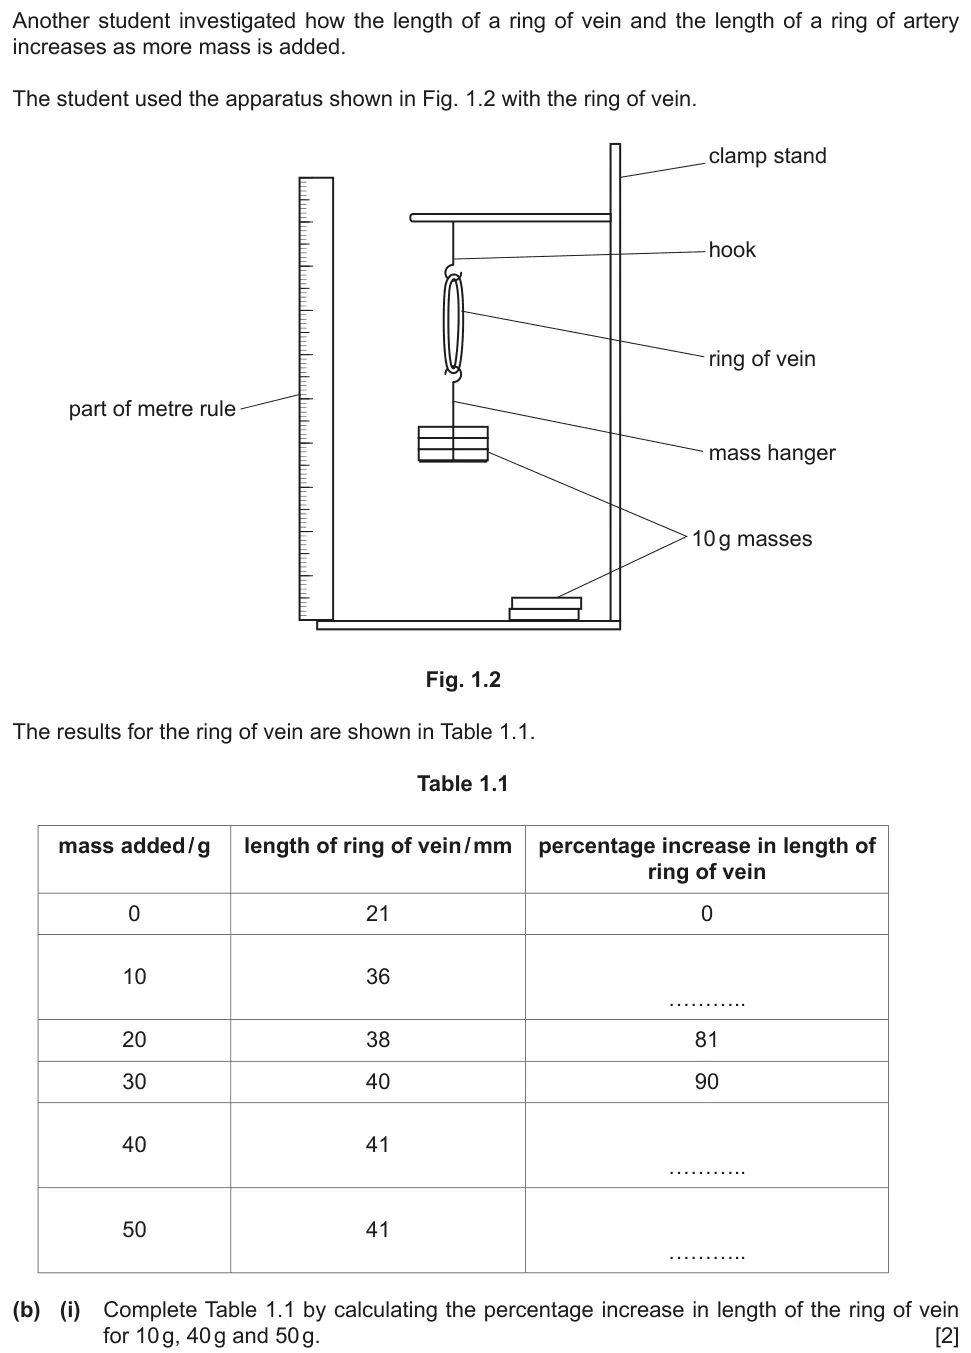
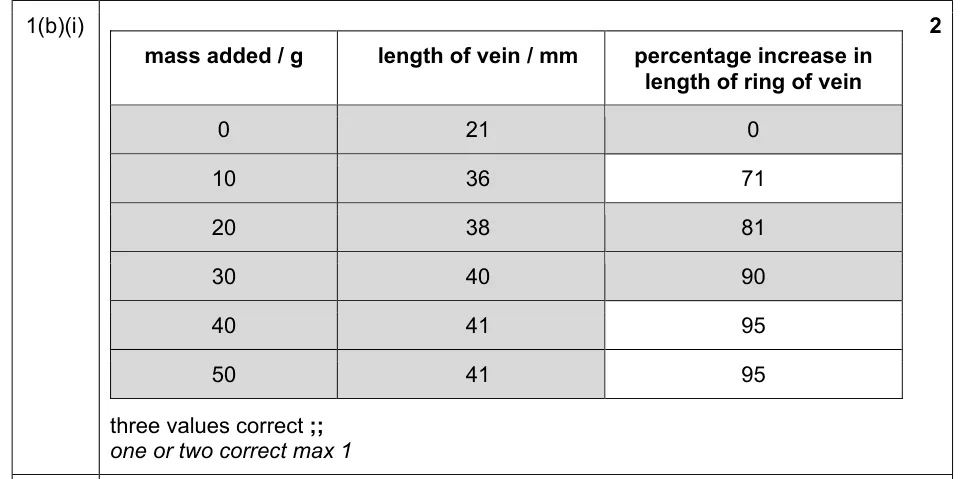
Complete a table by calculating percentage increases in length.
Information from earlier in this question:
Show the mark scheme
Tap an image to open it full size.
From the examiners' report: Most students completed the table correctly. Follow the convention already used in the table for the number of decimal places.
Question 11
Paper 5 · May/June 2024 (53) · Q1(b)(ii) · 1 mark
Explain why the student calculated the percentage increase in length.

Show the mark scheme

Tap an image to open it full size.
From the examiners' report: Many answers were too general, for example that the results can then be compared. Add that the starting lengths of the veins are likely to vary, so the percentage change makes the comparison more valid.
Question 12
Paper 5 · May/June 2024 (53) · Q1(b)(iii) · 3 marks
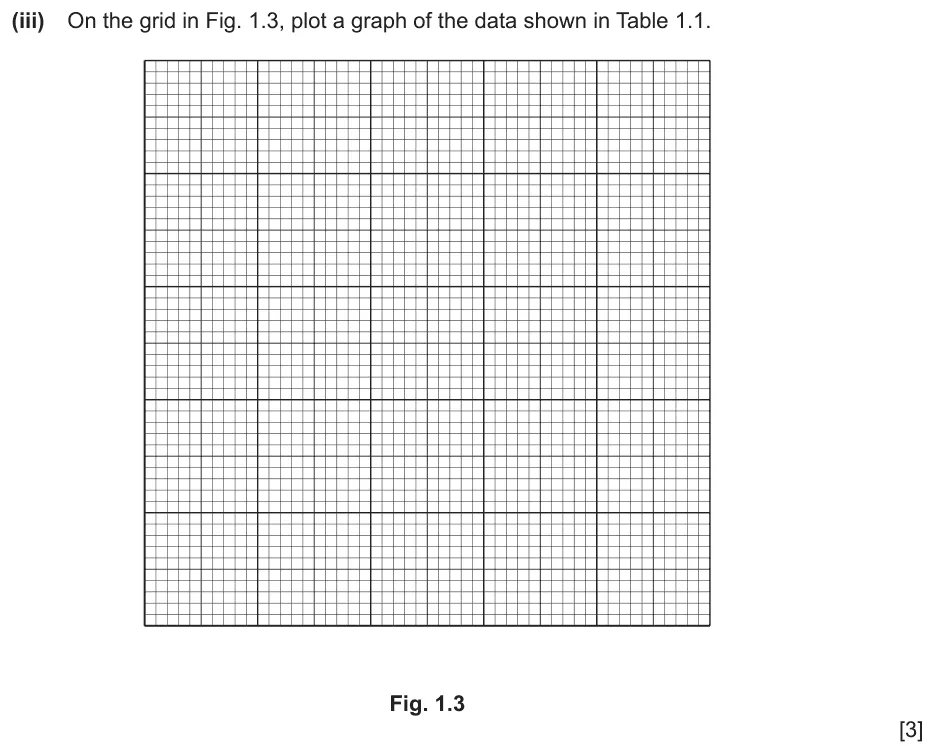
Plot a graph of the data in the table.
Show the mark scheme

Tap an image to open it full size.
From the examiners' report: Plot the percentage increase in length, not the length, on the y-axis. Include every data point, including the origin, so do not use a truncated y-axis, and draw a line that connects all the points.
Question 13
Paper 5 · October/November 2023 (52) · Q2(e)(i) · 3 marks · Easy
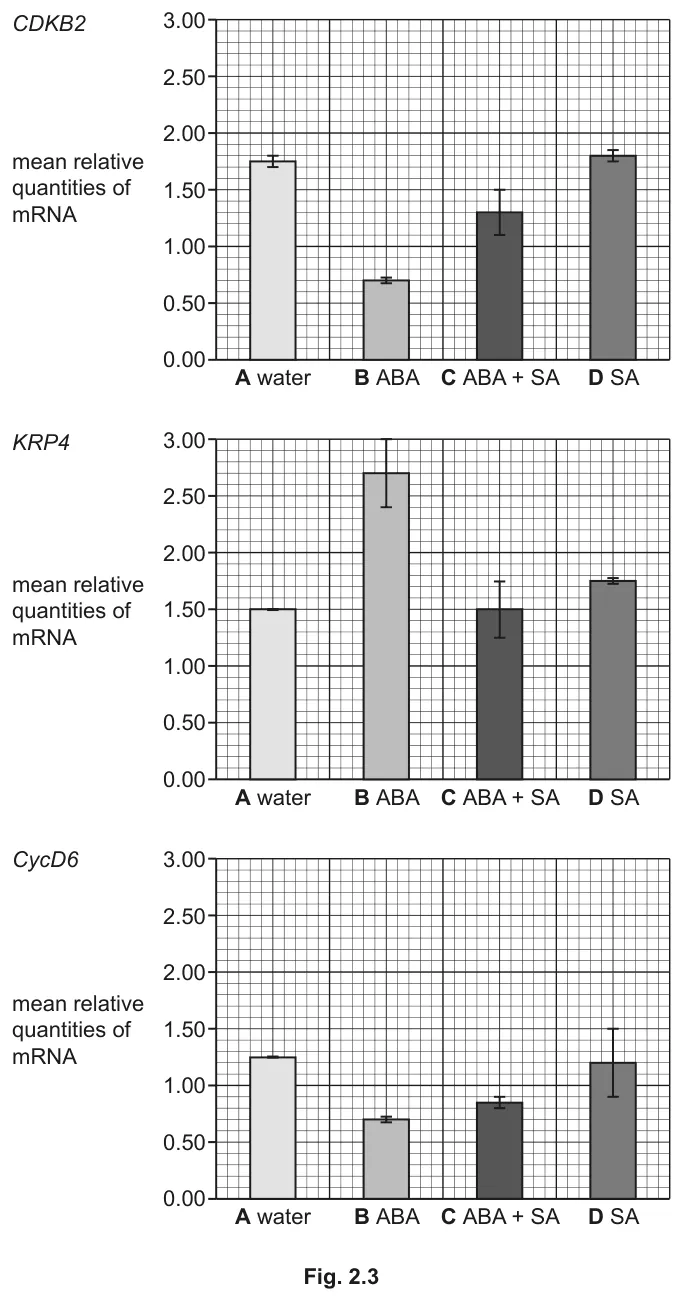
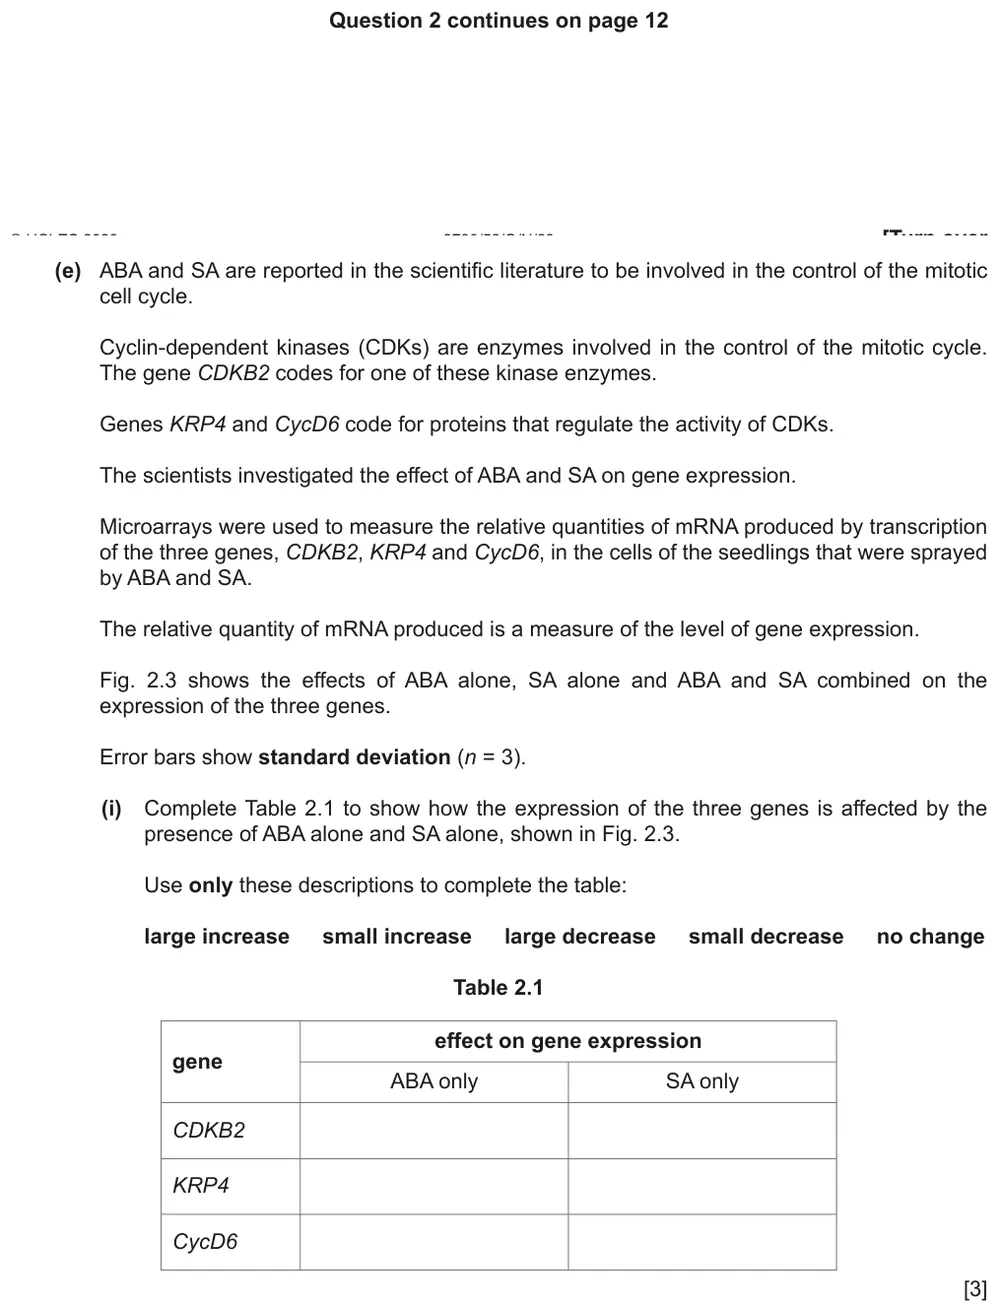
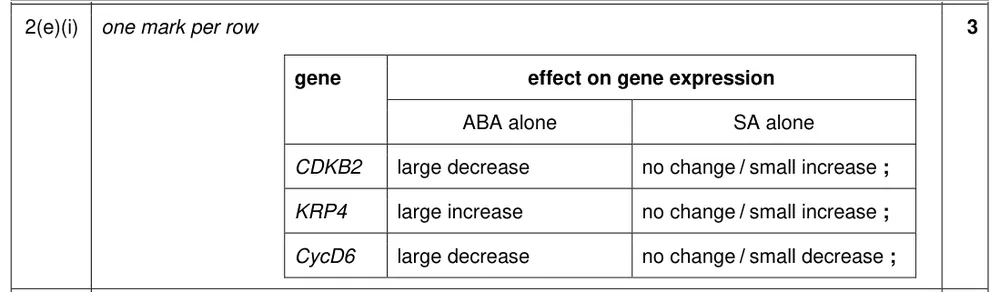
Use two bar charts to complete a table describing how two plant hormones affect the expression of three genes.
Information from earlier in this question:
Show the mark scheme
Tap an image to open it full size.
From the examiners' report: Use only the descriptions given in the question. Compare the quantity of mRNA for each hormone with the quantity when only water was applied.
Types of data and choosing a statistical test (P5 3)
Question 14
Paper 5 · October/November 2025 (51) · Q2(b)(i) · 2 marks
State the type of data represented by each of two variables on a bar chart.
Information from earlier in this question:
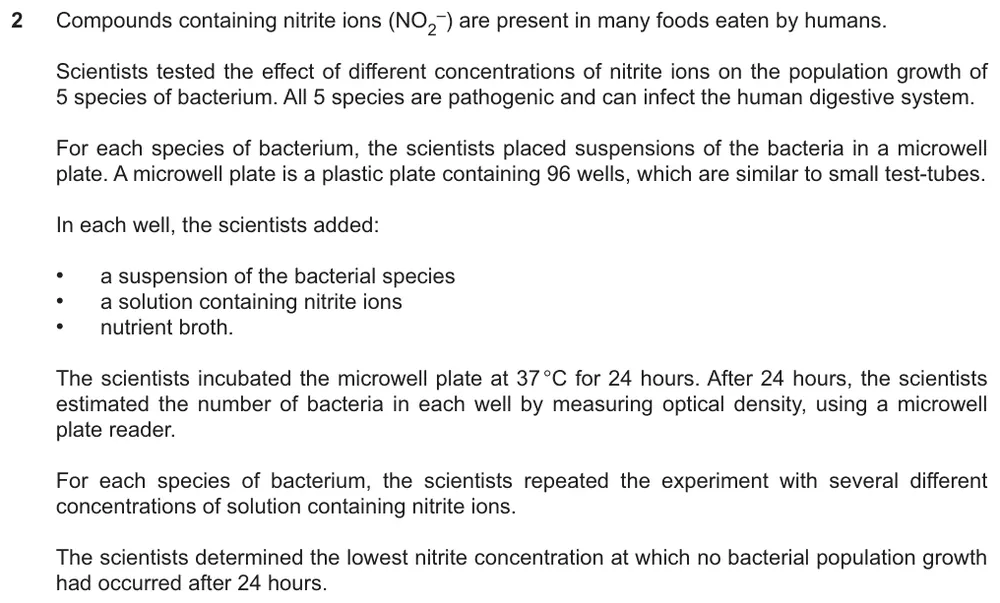
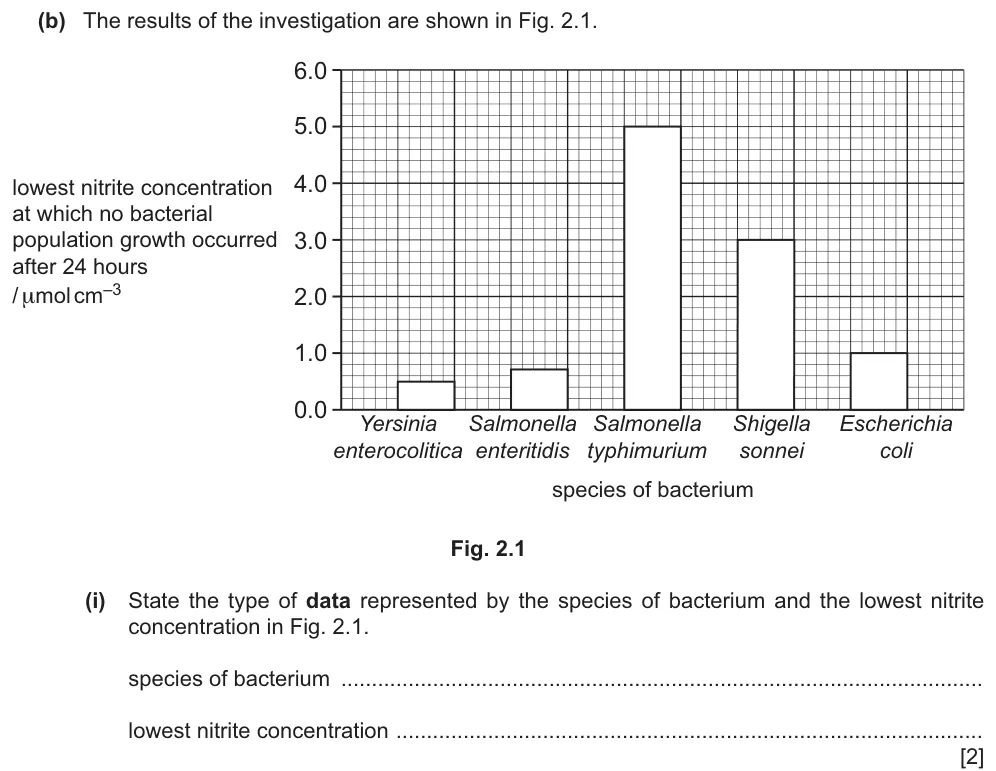
Show the mark scheme

Tap an image to open it full size.
Question 15
Paper 5 · October/November 2022 (52) · Q2(c)(i) · 2 marks · Easy
State which statistical test was used to compare two sets of data, and explain why it was suitable.
Information from earlier in this question:
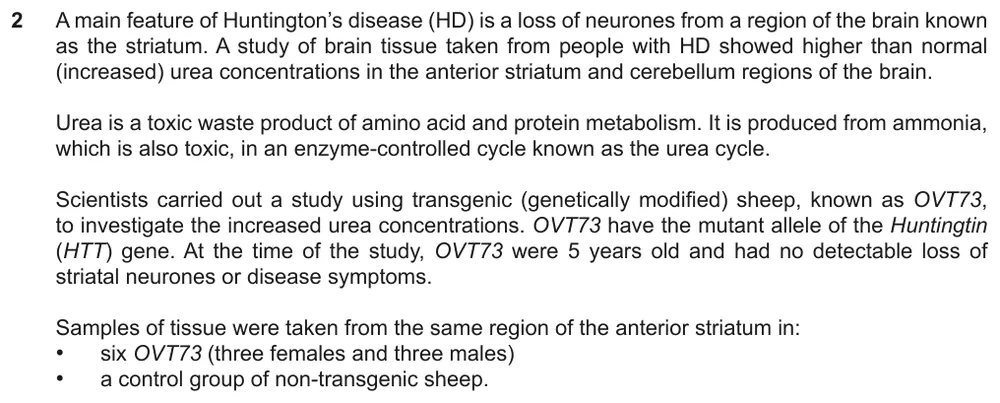
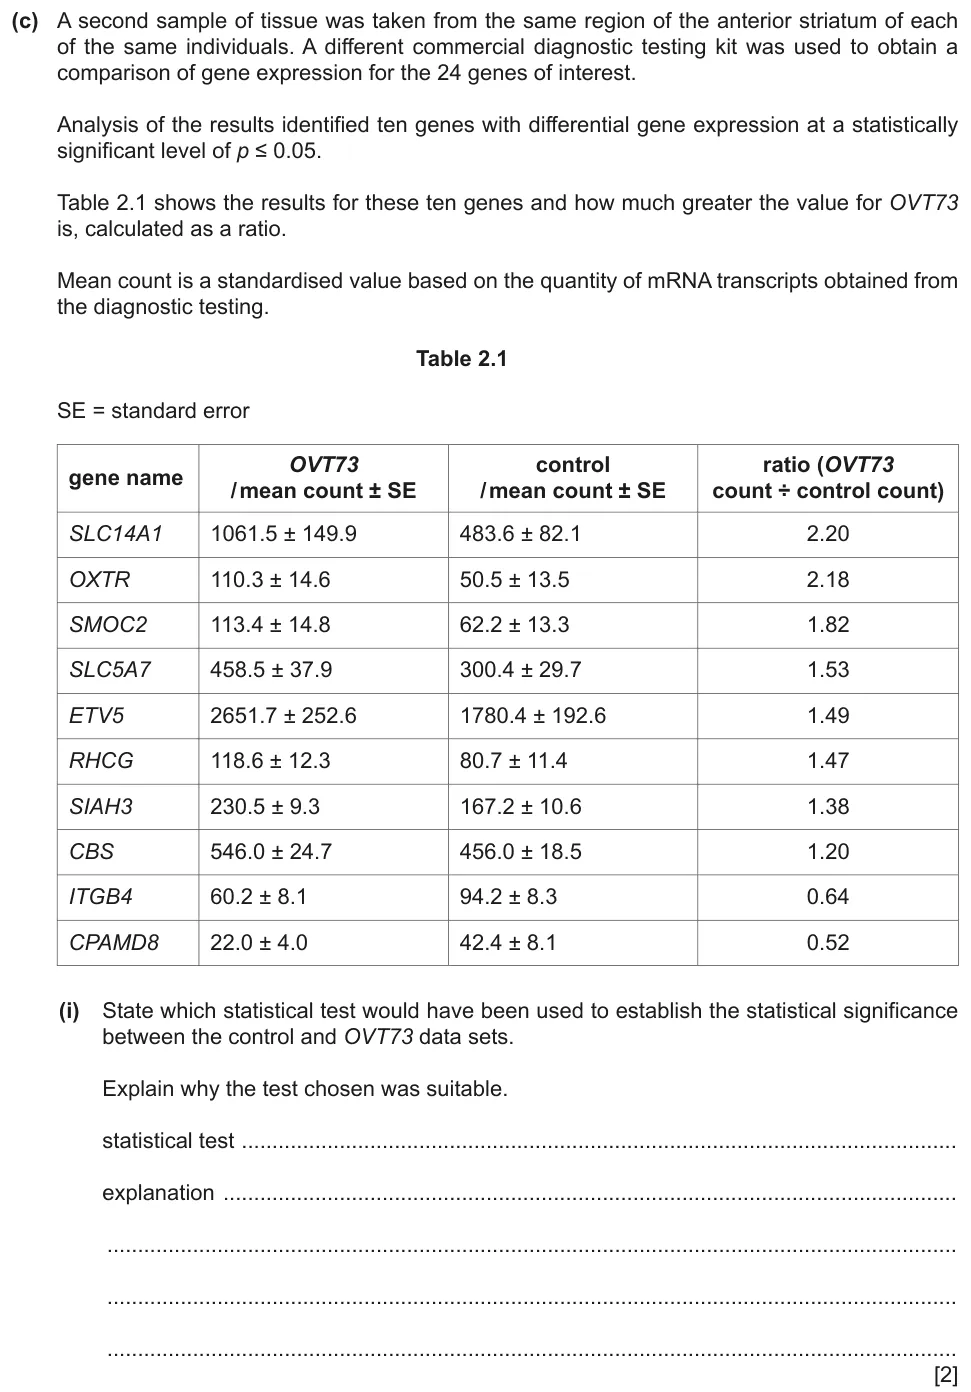
Show the mark scheme

Tap an image to open it full size.
From the examiners' report: Most students chose the t-test. Suitable reasons were that two means are compared, that the data are continuous or that the data have a normal distribution. The most common incorrect answer was that the data were discrete.
Question 16
Paper 5 · October/November 2024 (52) · Q2(c) · 3 marks
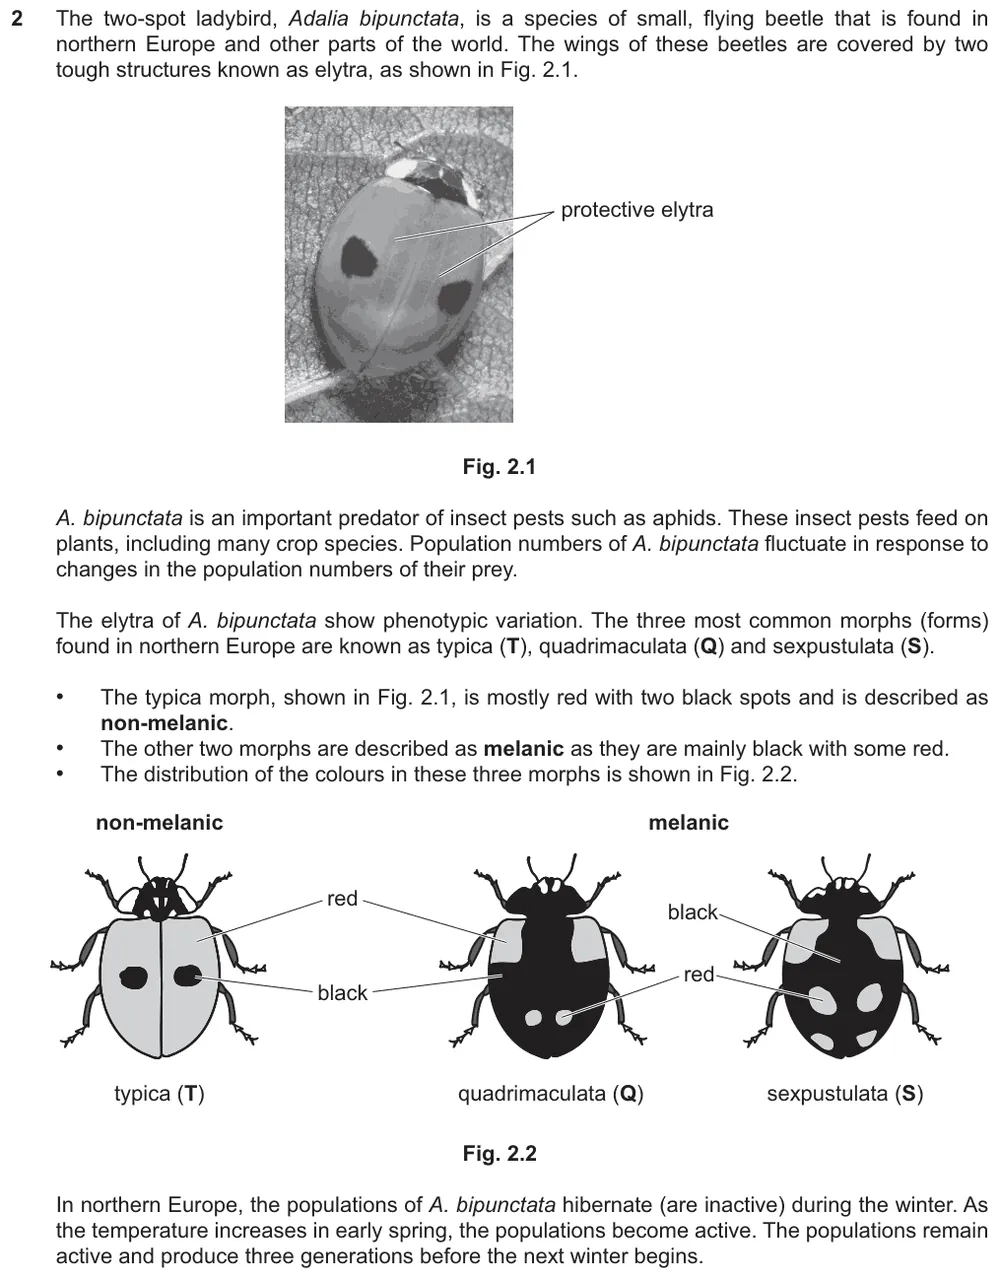
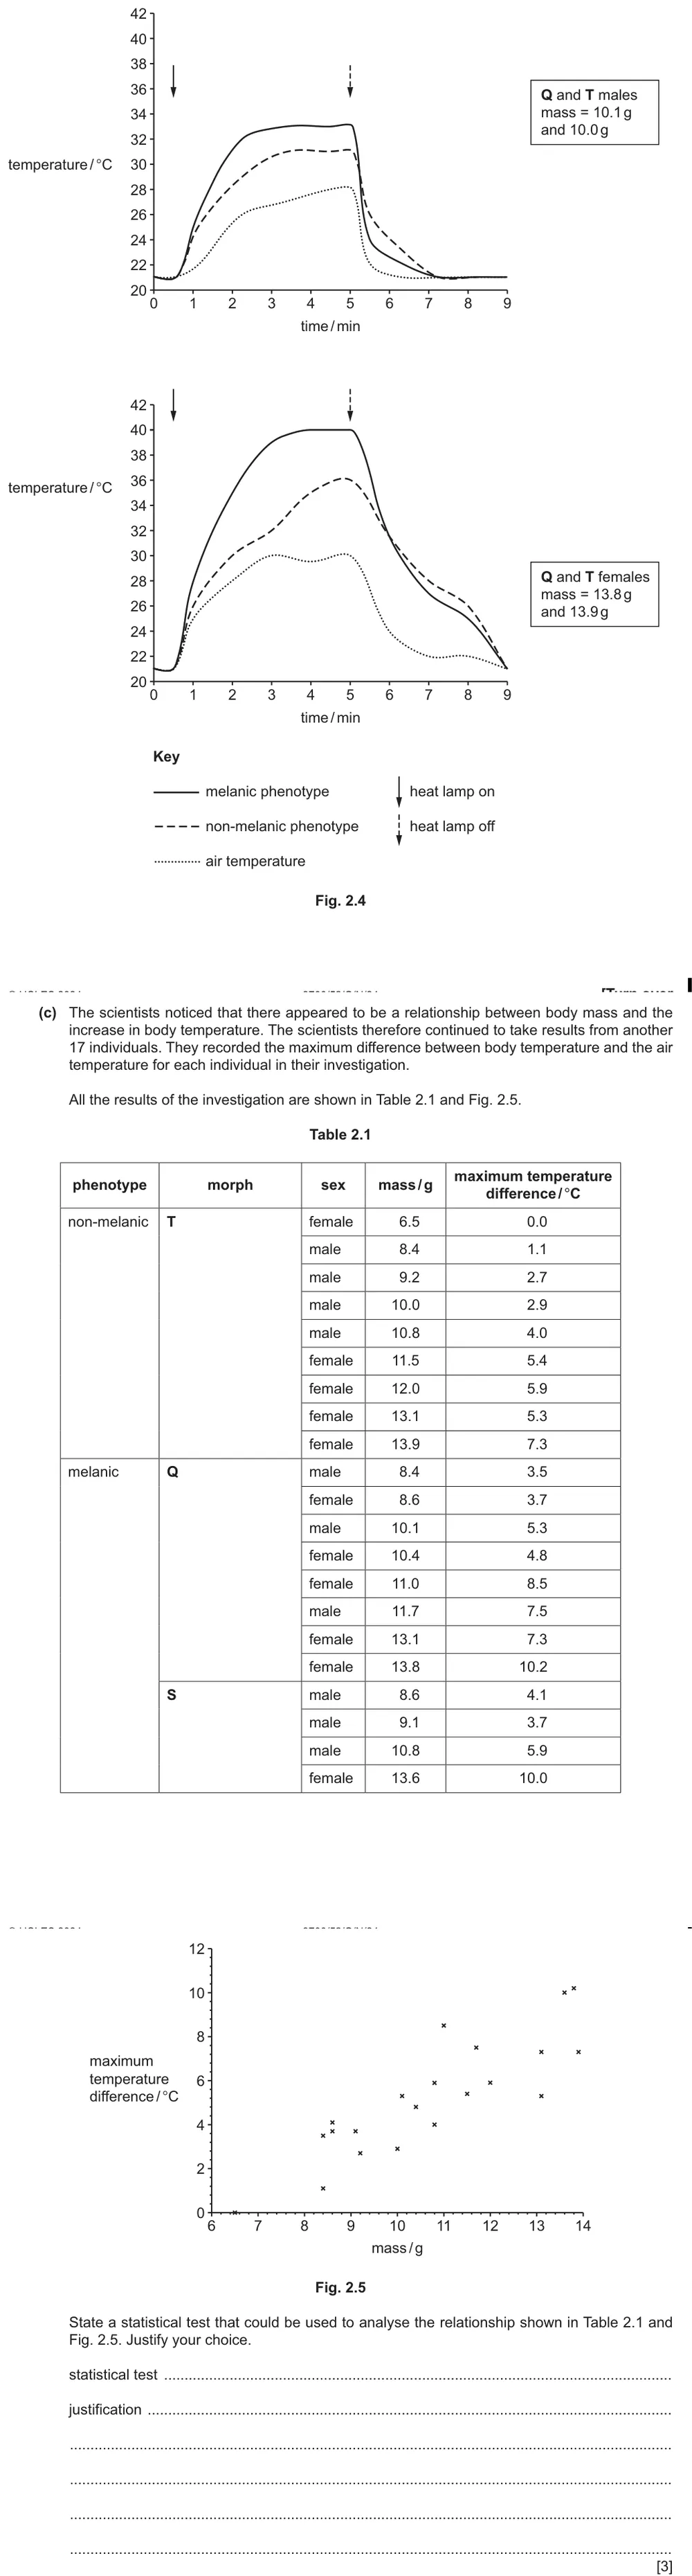
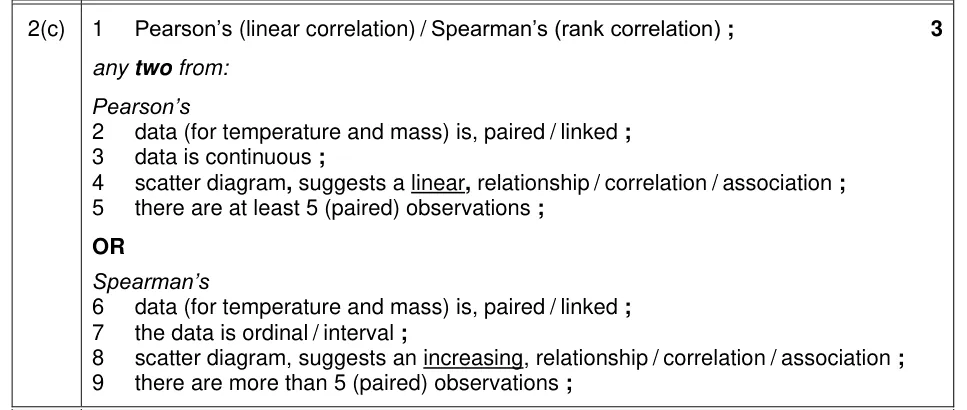
State a statistical test that could be used to analyse the relationship in a scatter graph, and justify the choice.
Information from earlier in this question:
Show the mark scheme
Tap an image to open it full size.
Null hypotheses and statistical tests (P5 3)
Question 17
Paper 5 · February/March 2025 (52) · Q2(b) · 1 mark
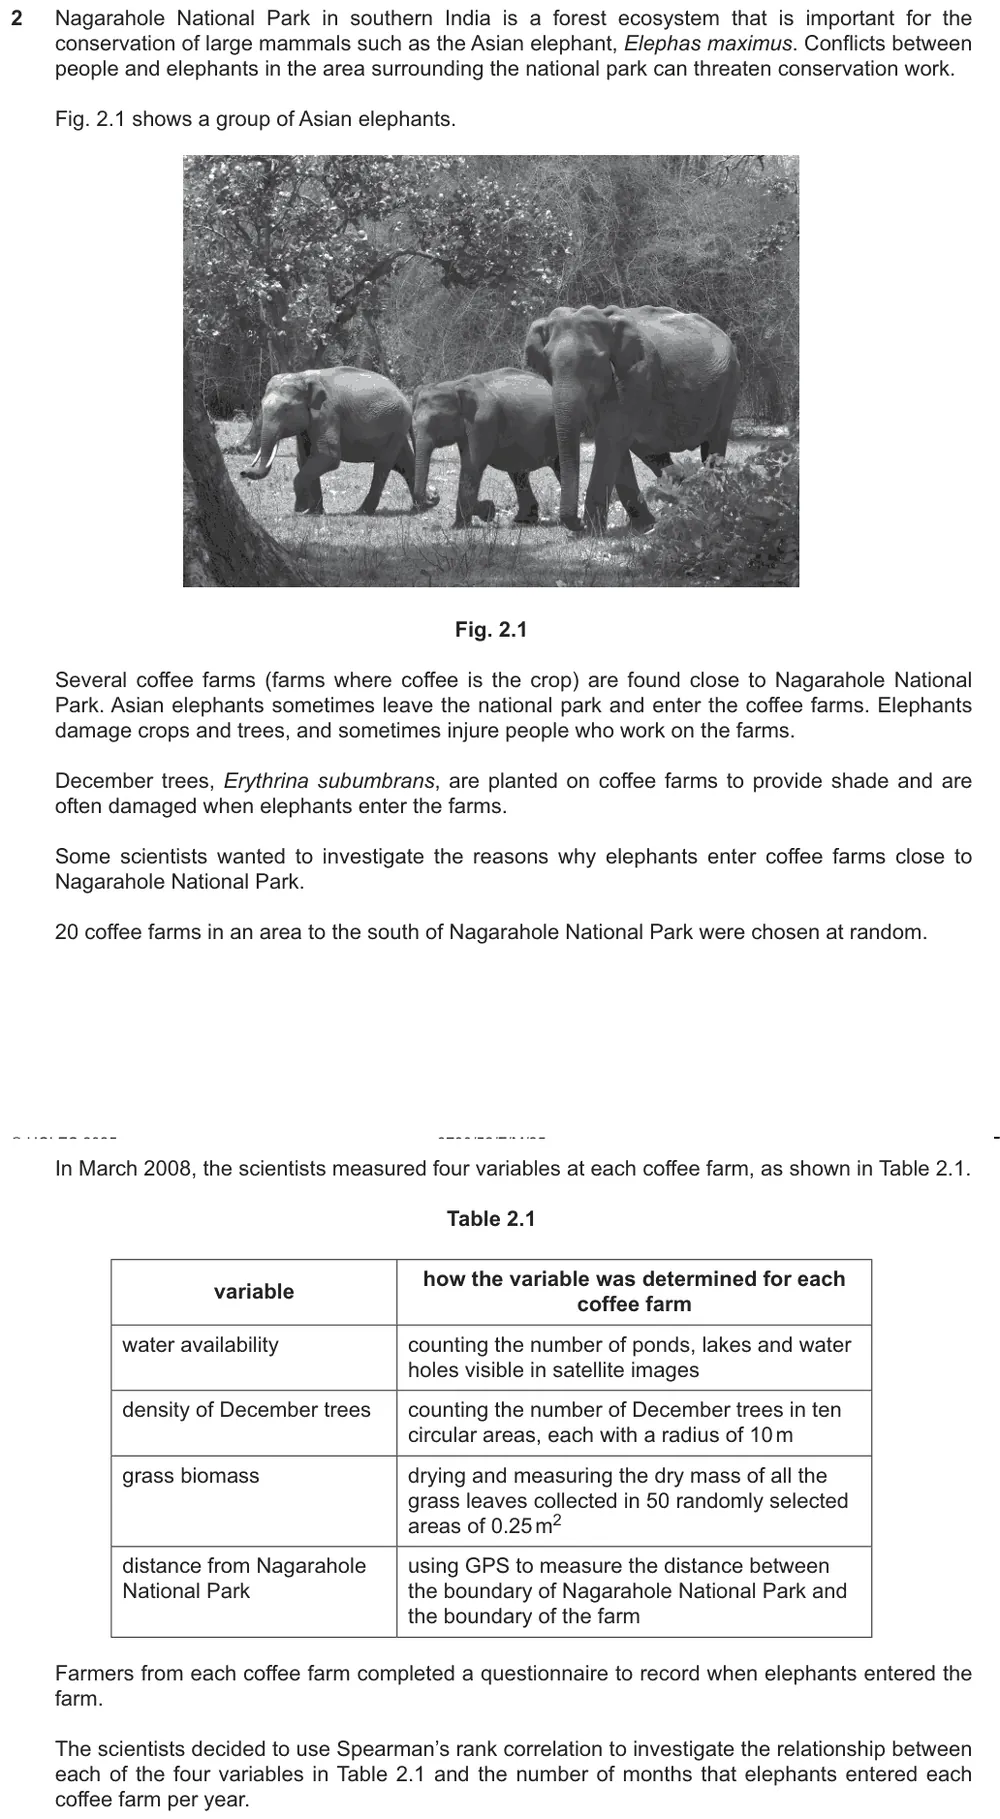
State a null hypothesis for a Spearman's rank correlation test.
Information from earlier in this question:

Show the mark scheme

Tap an image to open it full size.
From the examiners' report: Write 'no correlation', not 'no difference'. The observations are paired, so refer to each coffee farm, not to coffee farms in general.
Question 18
Paper 5 · February/March 2025 (52) · Q2(c)(i) · 1 mark · Easy
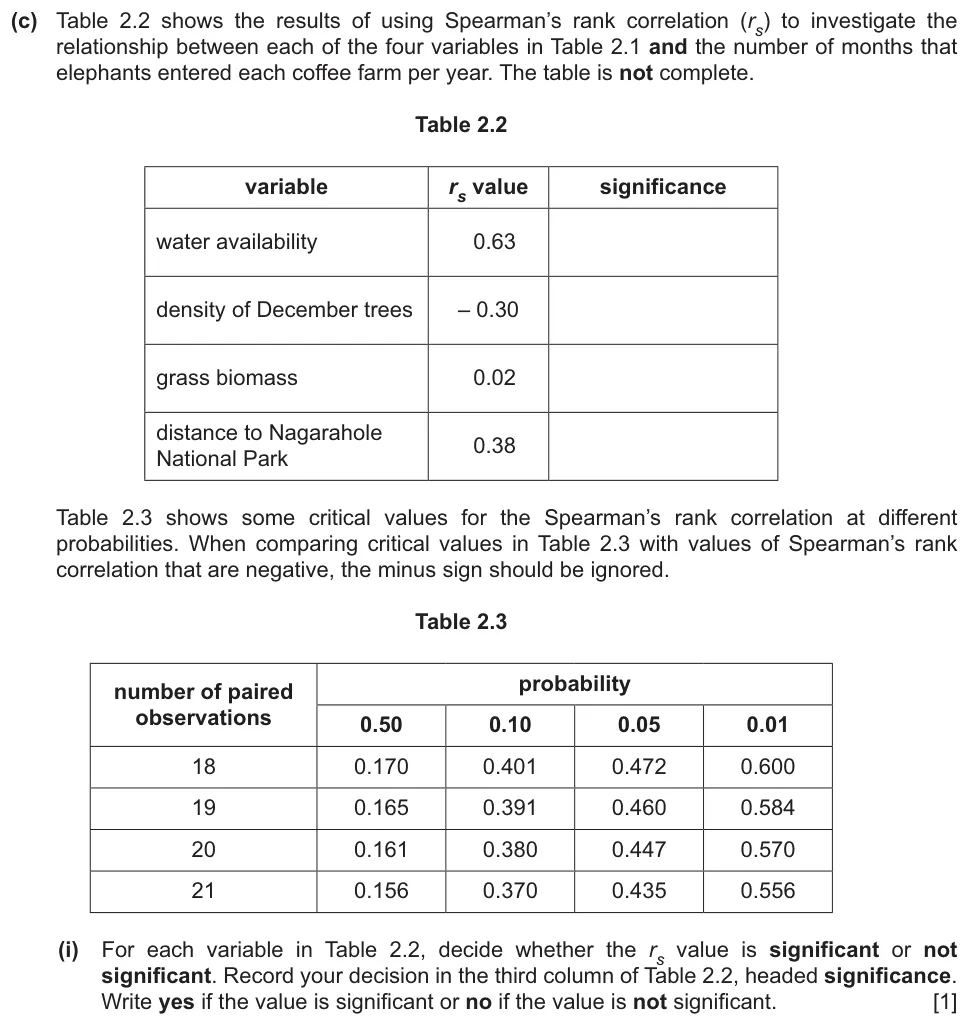
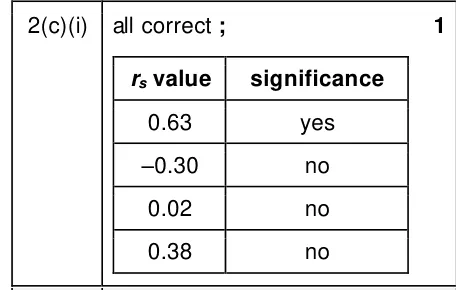
Use a table of critical values to decide whether each of four values of rs is significant.
Show the mark scheme
Tap an image to open it full size.
Question 19
Paper 5 · May/June 2024 (52) · Q2(b)(iii) · 1 mark
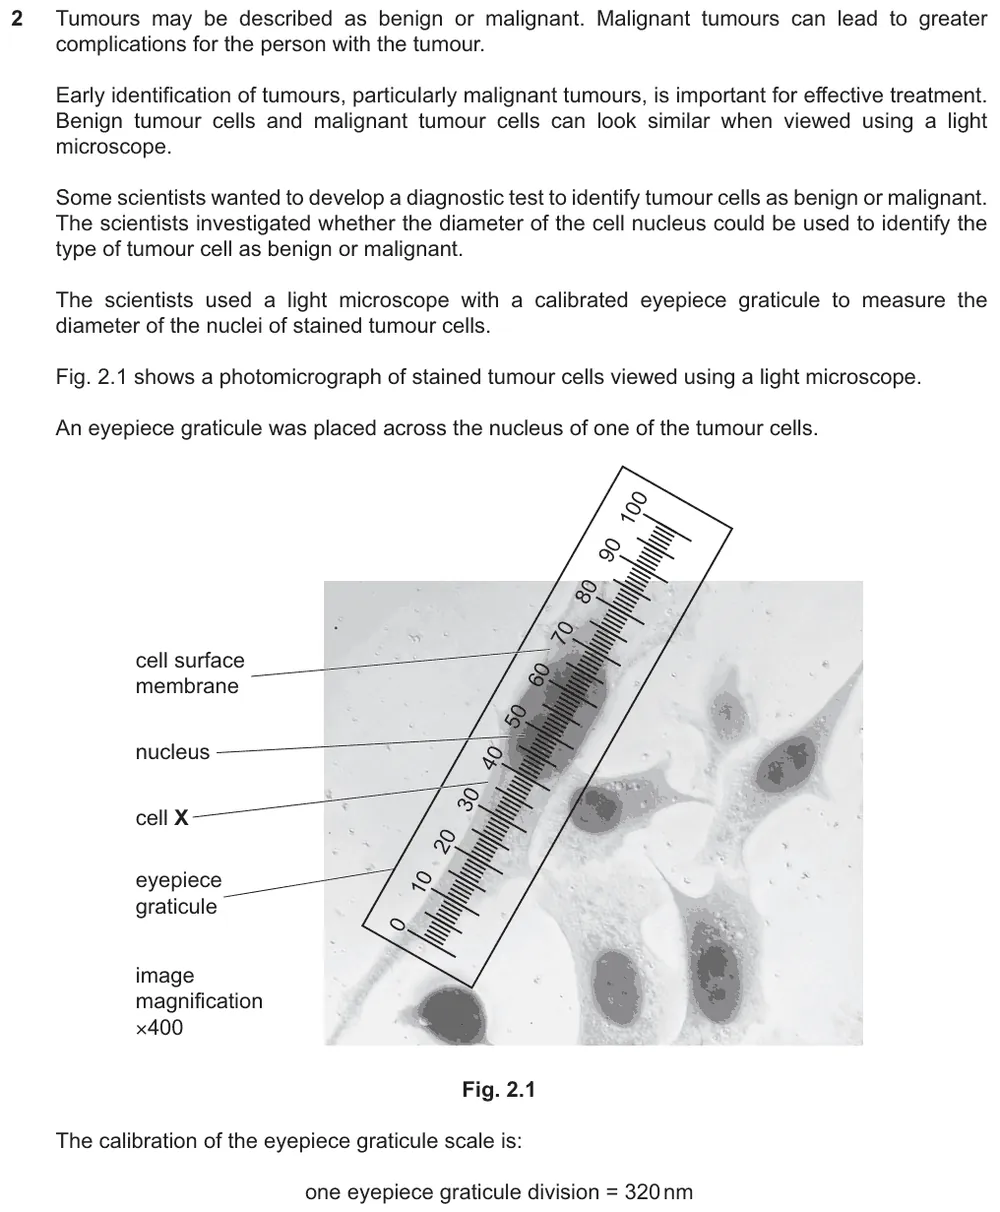
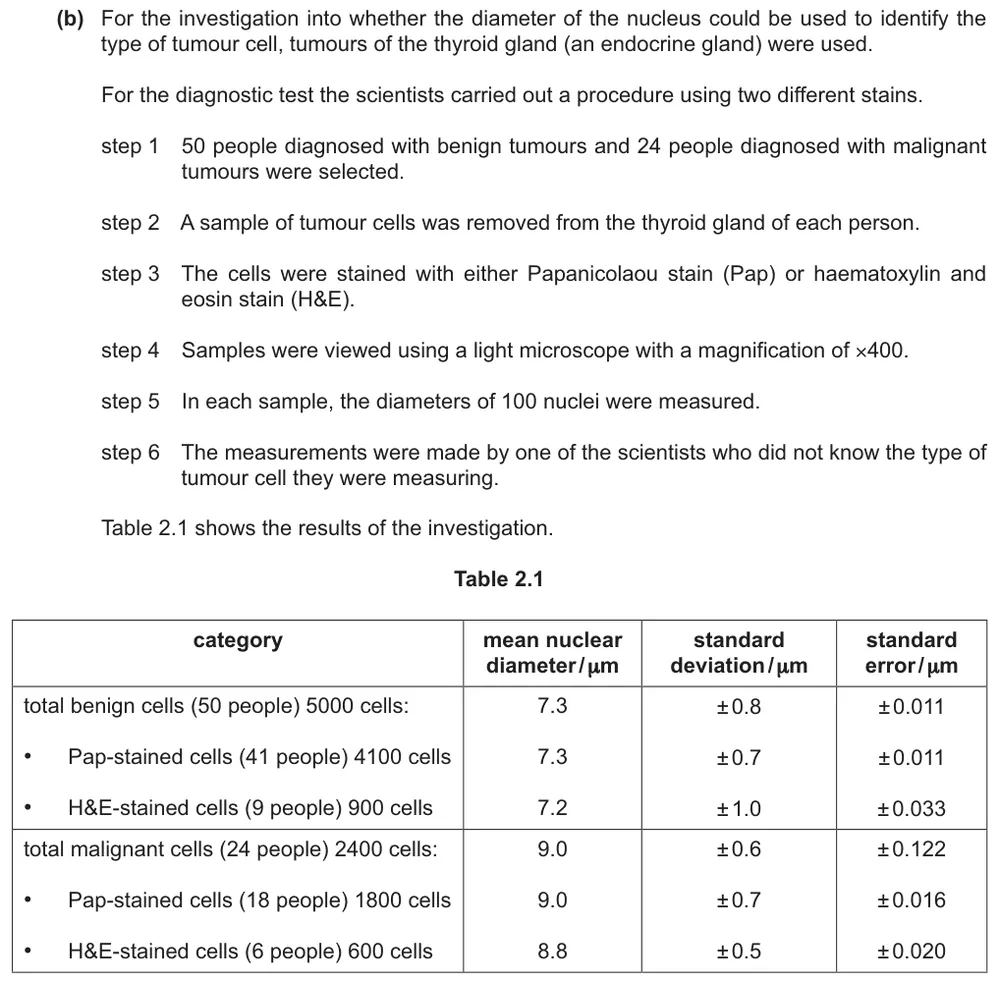
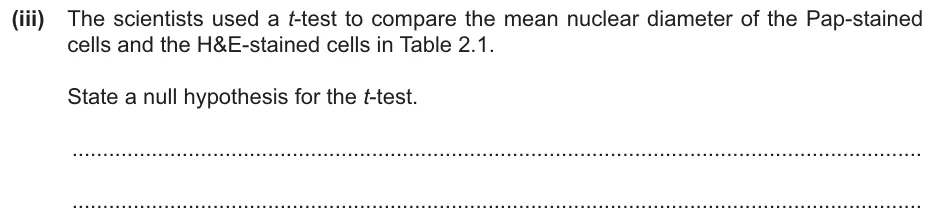
State a null hypothesis for a t-test.
Information from earlier in this question:
Show the mark scheme

Tap an image to open it full size.
From the examiners' report: Keep the null hypothesis short: weaker answers were long and confused. Do not write about correlations or relationships here. Include 'mean nuclear diameter', or the answer suggests that the diameter of the cell was measured.
Question 20
Paper 5 · October/November 2016 (52) · Q2(b)(ii) · 1 mark
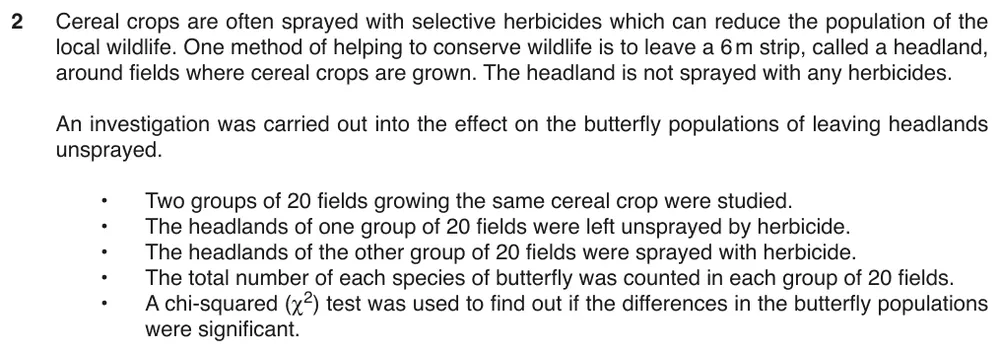
State a null hypothesis for a chi-squared test.
Information from earlier in this question:

Show the mark scheme

Tap an image to open it full size.
From the examiners' report: Many students could not give a suitable null hypothesis. It needs three parts: no significant difference between; the numbers of butterflies; and the fields with headlands and the fields without them.
Question 21
Paper 5 · May/June 2021 (52) · Q2(c)(i) · 2 marks · Hard
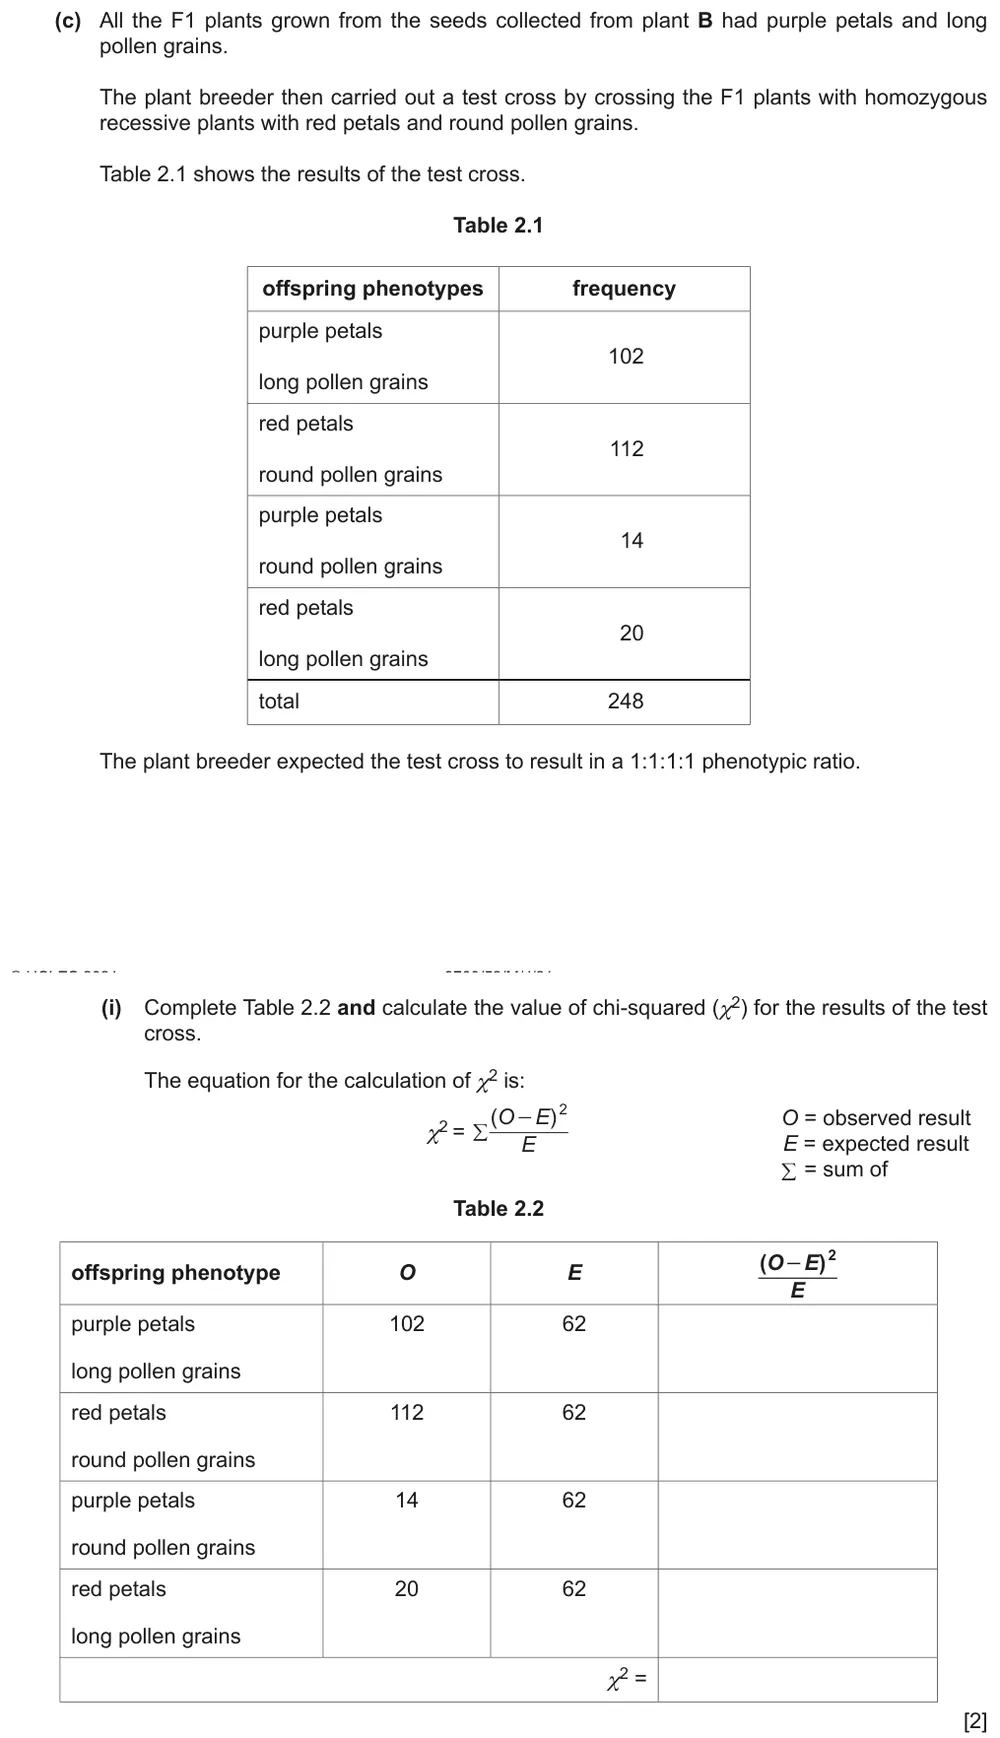
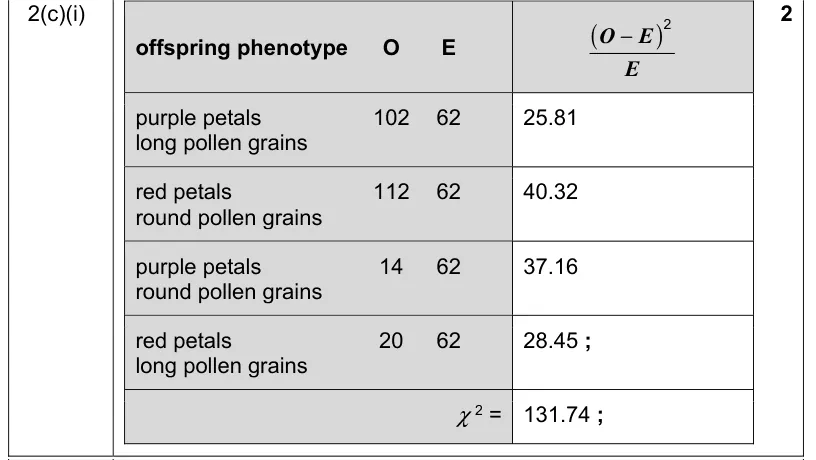
Complete a table to calculate the value of chi-squared for the results of a test cross.
Show the mark scheme
Tap an image to open it full size.
From the examiners' report: Many students calculated chi-squared correctly. The most common mistake was to round the values incorrectly, or to give values with a mixture of decimal places.
Where students lose marks (from Cambridge examiners' reports and mark schemes)
Each point below comes from the examiners' reports and mark schemes, and is followed by wording that gained marks.
A percentage change needs its sign. Students calculated the figure but did not state that the change was a decrease, or used an incorrect numerator or denominator.
✔ Gains credit: 'correct processes and correct figures'; an 'answer to 3 significant figures'; 'decrease' or 'minus'.
Initial rate comes from the straight section. Students used the whole graph to calculate a rate, or took figures from an incorrect tangent.
✔ Gains credit: 'figures from printed line at or below 0.26 au and 30 s' or 'figures from correct tangent', giving '0.0083 to 0.0089'.
A percentage needs multiplying by 100. Students wrote long descriptions that were not clear about where the measurements came from, and many did not refer to multiplying by 100.
✔ Gains credit: 'initial volume of red cube' minus the 'final' volume, divided by the 'initial volume of red cube', then '× 100'.
Population density is per unit area. Students copied the wording of the question, combined the numbers of cows and badgers, or wrote that density makes the data 'easier to analyse'.
✔ Gains credit: 'numbers (of infected badgers / cows) per unit area'; 'allow (valid) comparison'.
Standard deviation is spread about the mean. Students referred to 'a range of values' without any reference to the mean, or thought that standard deviations allow for errors.
✔ Gains credit: 'shows the spread about the mean'; 'indicates the reliability of the data'; 'see if the standard deviations overlap'.
Means of continuous data: t-test. Students chose the t-test but explained it by saying that the data were discrete.
✔ Gains credit: 't-test'; 'comparing means', 'continuous data' or 'data has a normal distribution'.
Say why a percentage is fairer. Students gave general answers, such as that the percentage change was calculated so that the results can be compared.
✔ Gains credit: 'to make a valid comparison'; 'allows comparison as' the 'initial' or 'starting' length is 'not constant'.
No correlation, not no difference. Students stated that there was no difference, rather than no correlation, or did not treat each coffee farm as a separate piece of data.
✔ Gains credit: 'no correlation between the water availability and the number of months that elephants entered each (coffee) farm per year'.
Download the questions
Download the PDF pack (21 questions, mark schemes at the end)
Keep practising
- Paper 5: Planning an Investigation: Cambridge (CIE) Paper 5 exam questions
- Paper 5: Conclusions and Evaluation: Cambridge (CIE) Paper 5 exam questions
- How Cambridge (CIE) A level Biology Paper 5 is marked: planning, analysis and evaluation
- Cambridge (CIE) A level Biology 9700 past papers, mark schemes and examiners' reports
- Cambridge (CIE) A level Biology grade thresholds
- Book a one-to-one CIE lesson or a free 15-minute discovery chat with Tom
- Register your interest in a CIE A level Biology group class
Questions, mark schemes and examiners' report extracts © Cambridge University Press & Assessment.