

Biodiversity (18.2): Cambridge (CIE) A Level Biology 9700 Exam Questions by Topic
Biodiversity is sub-topic 18.2 of Topic 18, Classification, biodiversity and conservation, in the Cambridge International AS & A Level Biology syllabus (9700). You need to define ecosystem and niche, explain the three levels at which biodiversity can be assessed, explain why random sampling matters, describe and use frame quadrats, line and belt transects and mark-release-recapture with the Lincoln index, use Spearman's rank correlation and Pearson's linear correlation to analyse the relationship between two variables, and calculate and interpret Simpson's index of diversity. This is A level content, examined on Paper 4.
The examiners' reports return to the same points. An ecosystem is a self-contained unit made up of all the organisms in it and their interactions with each other and with the abiotic environment. Know the three levels of biodiversity by name: ecosystem or habitat, species, and genetic. Sample at random when you measure abundance, and say what you record in each quadrat, such as percentage cover. For mark-release-recapture, say how the animals are marked, allow time for them to mix, and name the Lincoln index. Do not confuse its assumptions with those of the Hardy-Weinberg equations. With Simpson's index, remember to subtract the total from 1.
Studying Cambridge International A level Biology and want more help? Tom teaches CIE students one-to-one online, including students in the UAE, Saudi Arabia, Hong Kong, India and Indonesia, and every lesson is recorded. You can book a one-to-one lesson or a free 15-minute discovery chat, or register your interest in a CIE group class starting in September 2027, using the links at the bottom of this page.
What you need from AS Level
Each question on this page assumes you're secure on these ideas. If any of them feels shaky, look it up before you start.
- A gene is a length of DNA that codes for a polypeptide, and a mutation can produce a new allele of a gene. Different alleles are the source of genetic variation within a species.
- A population is all the organisms of one species living in the same place at the same time; a community is all the populations of the different species living there.
- A correlation is a relationship between two variables: positive if both increase together, negative if one decreases as the other increases.
- To work out a proportion, divide the number in one group by the total. Keep to the number of decimal places the question asks for.
Key terms
These words come up in the questions and mark schemes. Examiners expect you to use them exactly.
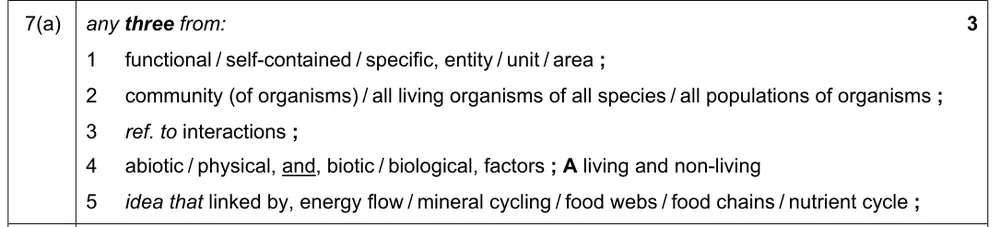
- Ecosystem: a self-contained, functional unit made up of a community of organisms and the abiotic factors of their environment, and the interactions between them.
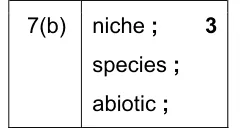
- Niche: the role of a species within its ecosystem.
- Biodiversity: the variety of ecosystems and habitats, the number of species and their relative abundance, and the genetic variation within each species.
- Abiotic factor: a physical, non-living factor in the environment, such as temperature or soil pH.
- Frame quadrat: a square frame of known area, placed at random coordinates, in which the species present are identified and their number or percentage cover is recorded.
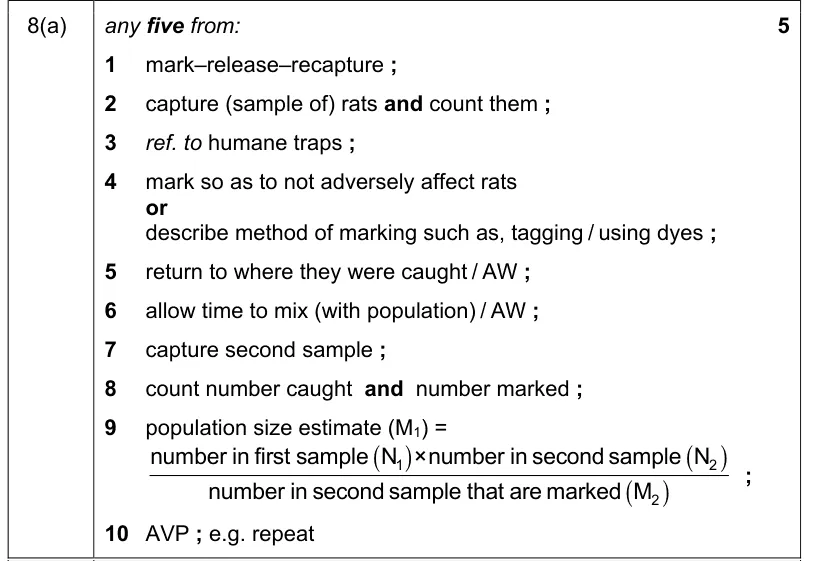
- Mark-release-recapture: a method of estimating the population size of a mobile animal: a first sample is captured, marked and released, and after time to mix a second sample is captured and the marked animals in it are counted.
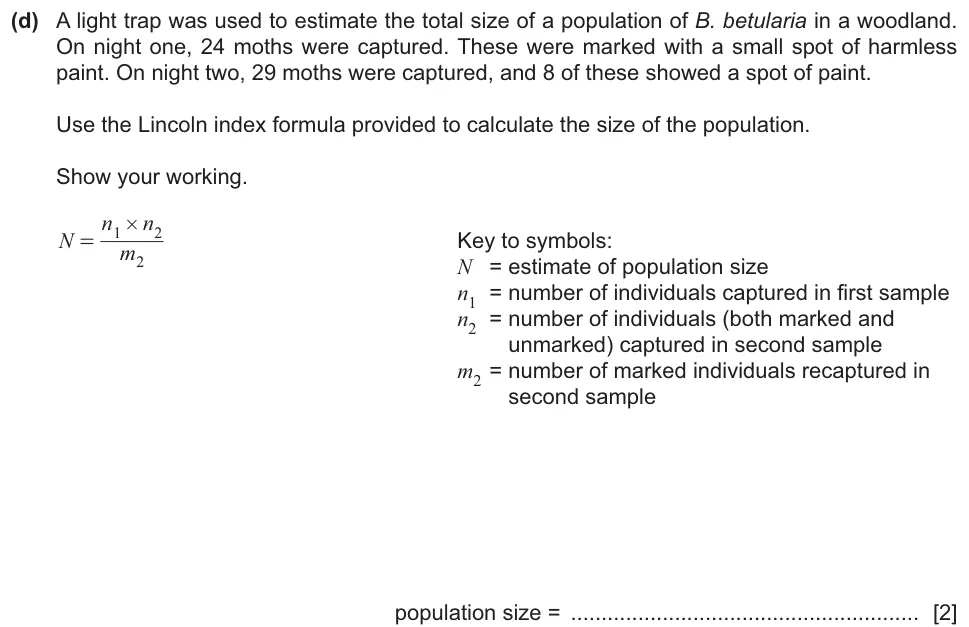
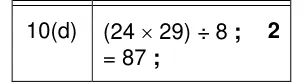
- Lincoln index: the estimate of population size from mark-release-recapture: the number in the first sample multiplied by the number in the second sample, divided by the number of marked animals in the second sample.
- Simpson's index of diversity (D): a measure of biodiversity calculated from the number of individuals of each species. The closer D is to 1, the higher the diversity.
What these questions cover (Cambridge 9700 Topic 18: Classification, biodiversity and conservation)
The questions test these learning outcomes from sub-topic 18.2 of the Cambridge International AS & A Level Biology syllabus (9700) for 2025 to 2027.
- 18.2.1 define the terms ecosystem and niche
- 18.2.2 explain that biodiversity can be assessed at different levels
- 18.2.4 describe and use suitable methods to assess the distribution and abundance of organisms in an area, limited to frame quadrats, line transects, belt transects and mark-release-recapture using the Lincoln index
- 18.2.5 use Spearman’s rank correlation and Pearson’s linear correlation to analyse the relationships between two variables, including how biotic and abiotic factors affect the distribution and abun
- 18.2.6 use Simpson’s index of diversity (D) to calculate the biodiversity of an area, and state the significance of different values of D
How to use this page
Write your answer on paper before you open the mark scheme. Allow about 1.2 minutes per mark: the 22 questions are worth 64 marks, so about 77 minutes in total. Then mark your answer strictly against the mark scheme and read the examiners' tip underneath it. If you'd rather print the questions, download the PDF pack.
Ecosystem and niche (18.2.1)
Question 1
Paper 4 · May/June 2019 (42) · Q7(a) · 3 marks · Easy
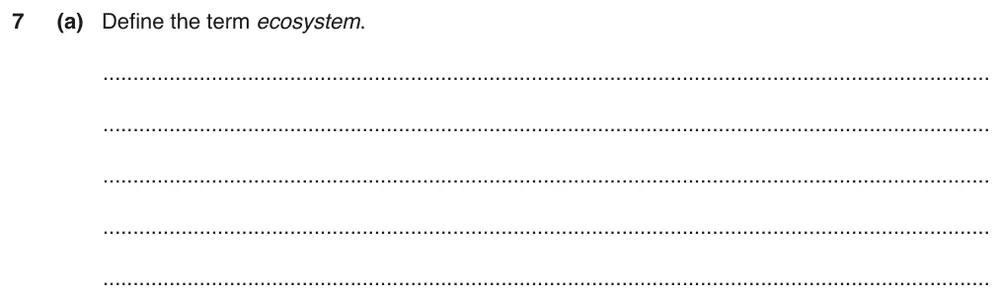
Define the term ecosystem.
Show the mark scheme
Tap an image to open it full size.
From the examiners' report: Most knew that there are interactions within an ecosystem, and many mentioned a community of organisms and biotic and abiotic factors. Not everyone recognised that an ecosystem includes all of the organisms present. Few gave a full and coherent definition.
Question 2
Paper 4 · May/June 2019 (42) · Q7(b) · 3 marks
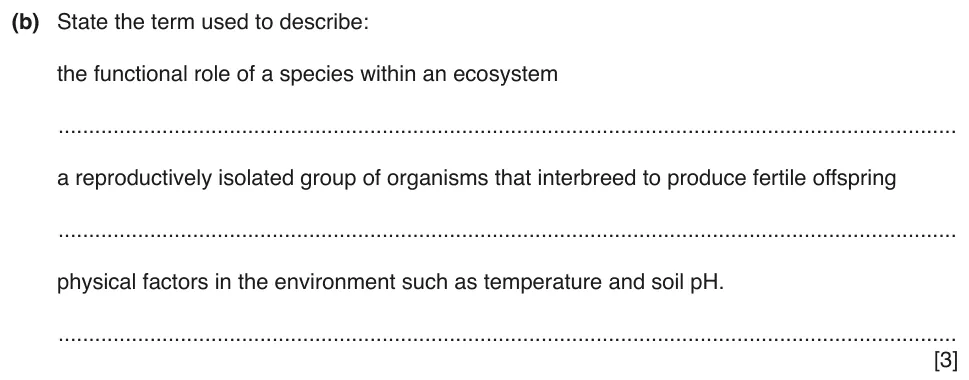
State the term that matches each of three descriptions.
Show the mark scheme
Tap an image to open it full size.
From the examiners' report: 'Habitat' was sometimes wrongly given for both the first and the third descriptions. Some students confused biotic factors and abiotic factors.
Question 3
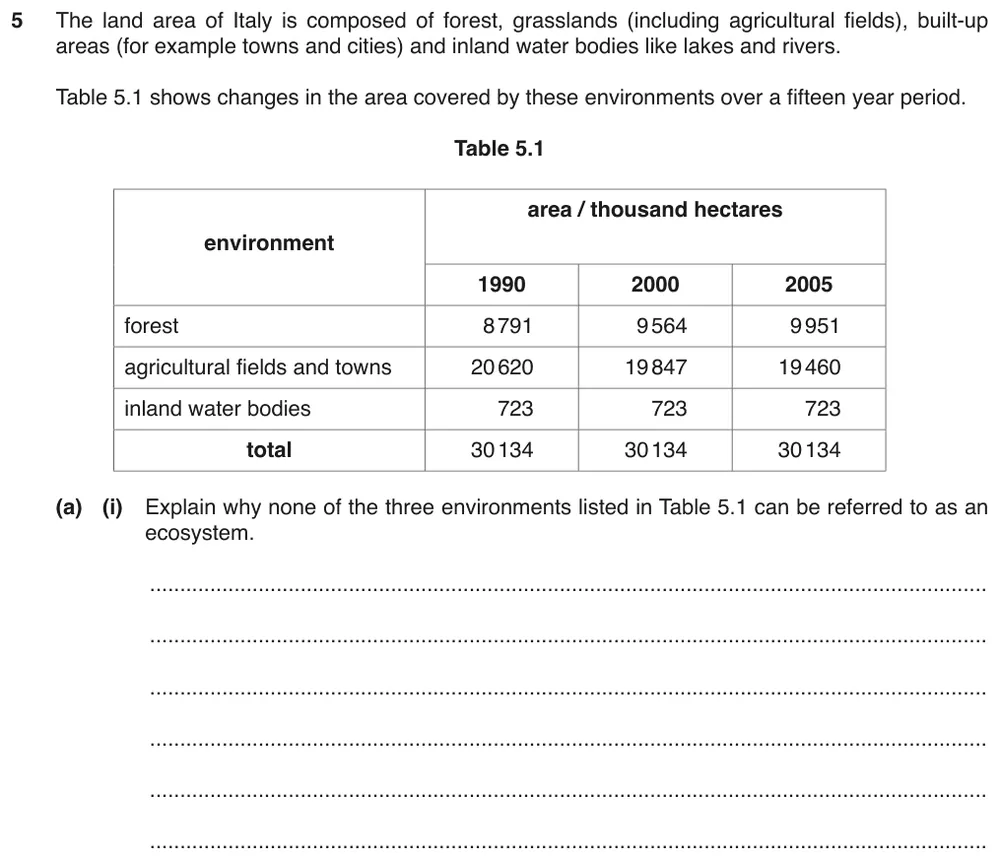
Paper 4 · October/November 2016 (42) · Q5(a)(i) · 2 marks · Easy
Explain why none of the three environments in the table can be called an ecosystem.
Show the mark scheme

Tap an image to open it full size.
From the examiners' report: Start from what an ecosystem is: a defined area that is self-contained, or a functional unit. Most students did not appreciate this, so the explanations that followed were vague and largely incorrect.
Levels of biodiversity (18.2.2)
Question 4
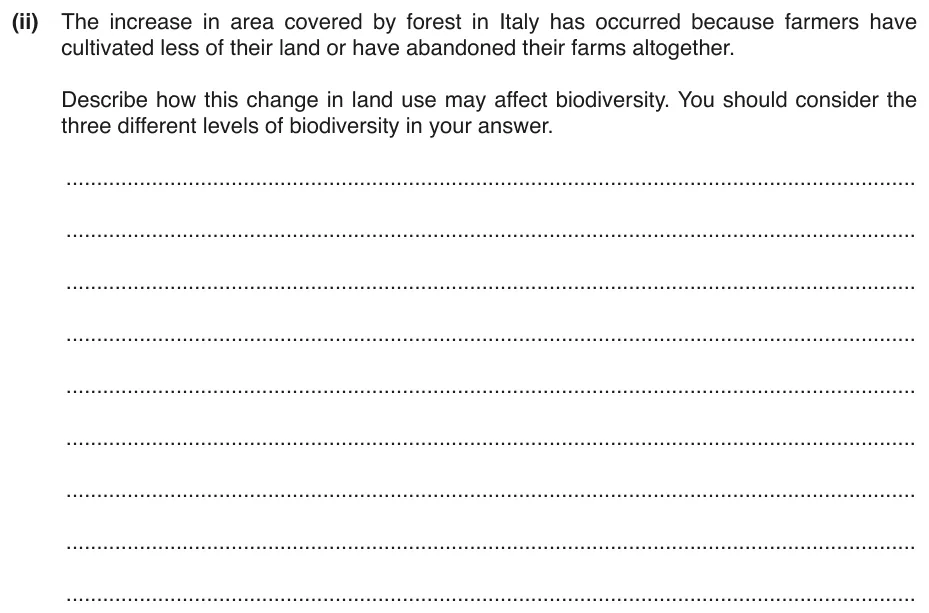
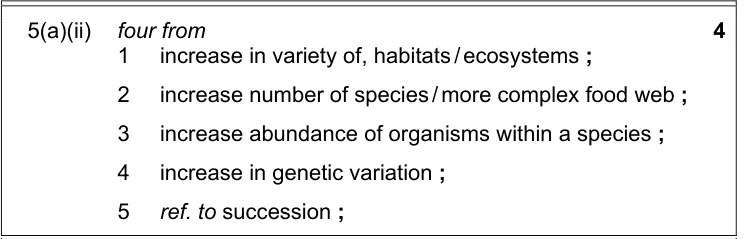
Paper 4 · October/November 2016 (42) · Q5(a)(ii) · 4 marks
Describe how a change in land use from farmland to forest may affect biodiversity at its three levels.
Show the mark scheme
Tap an image to open it full size.
From the examiners' report: Full marks went to answers that referred to ecosystem diversity, species diversity, species abundance and genetic diversity; many did not mention these levels at all. Make clear that it is the variety of habitats that increases, not just that more habitat becomes available. Some wrongly argued that biodiversity would decrease.
Question 5
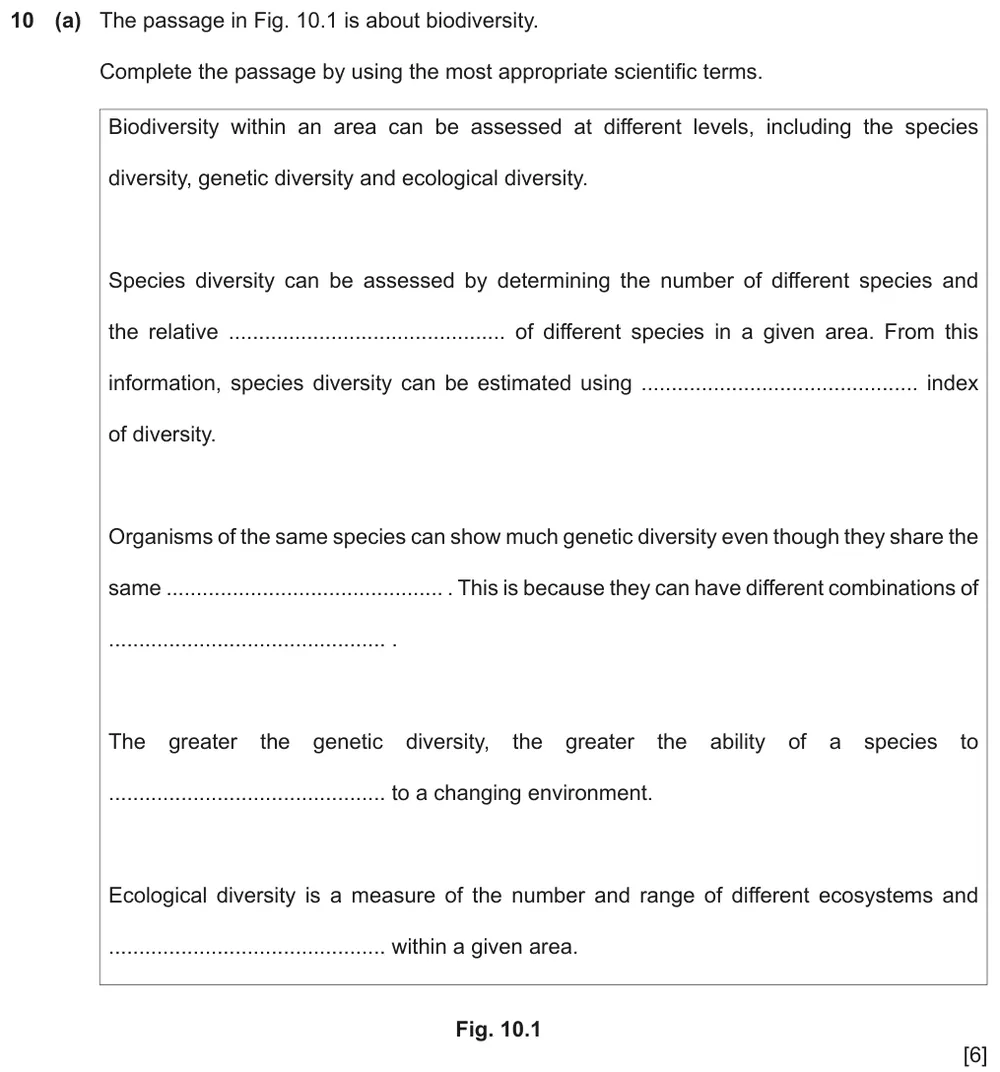
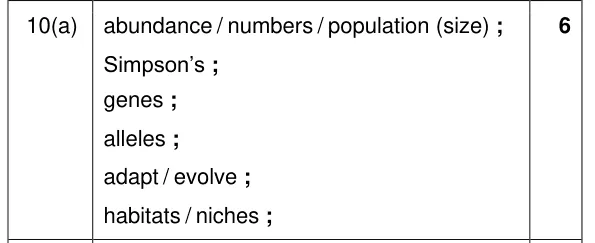
Paper 4 · February/March 2023 (42) · Q10(a) · 6 marks · Easy
Complete the passage about biodiversity with the most appropriate scientific terms.
Show the mark scheme
Tap an image to open it full size.
Question 6
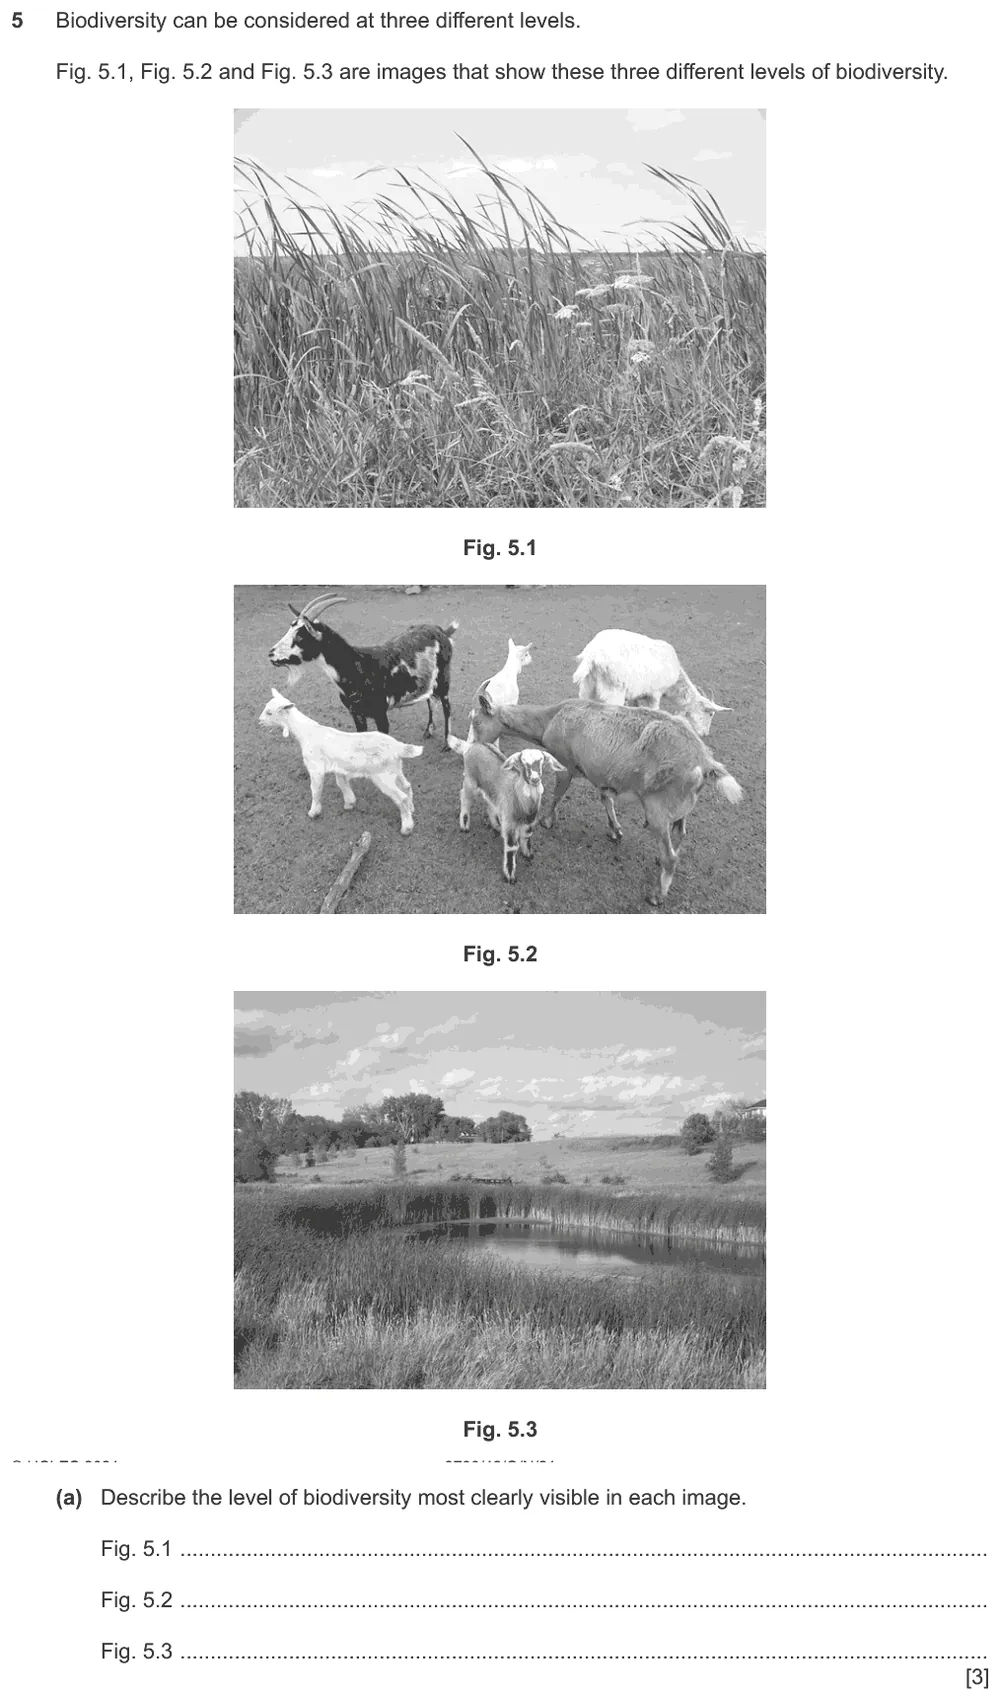
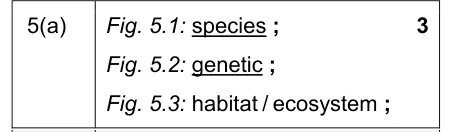
Paper 4 · October/November 2021 (42) · Q5(a) · 3 marks
Describe the level of biodiversity most clearly shown in each of three images.
Show the mark scheme
Tap an image to open it full size.
From the examiners' report: The correct answers (species, genetic, and ecosystem or habitat) were rarely given. The most common wrong answers were 'low', 'medium' or 'high'.
Quadrats and sampling (18.2.4)
Question 7
Paper 4 · May/June 2025 (42) · Q9(a) · 4 marks
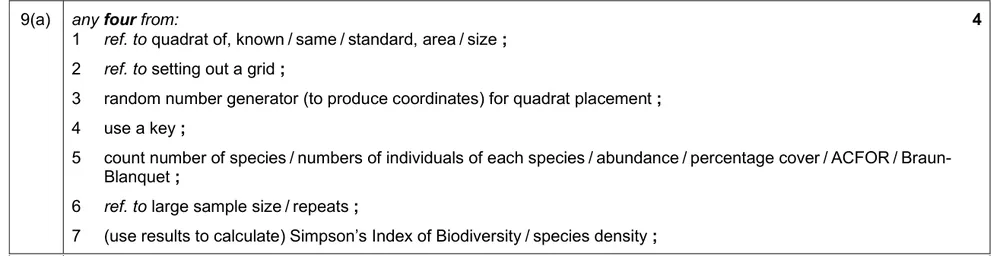
Outline how a frame quadrat could be used to assess the biodiversity of plants in a field.
Show the mark scheme
Tap an image to open it full size.
Question 8
Paper 4 · May/June 2017 (42) · Q8(a) · 4 marks · Easy
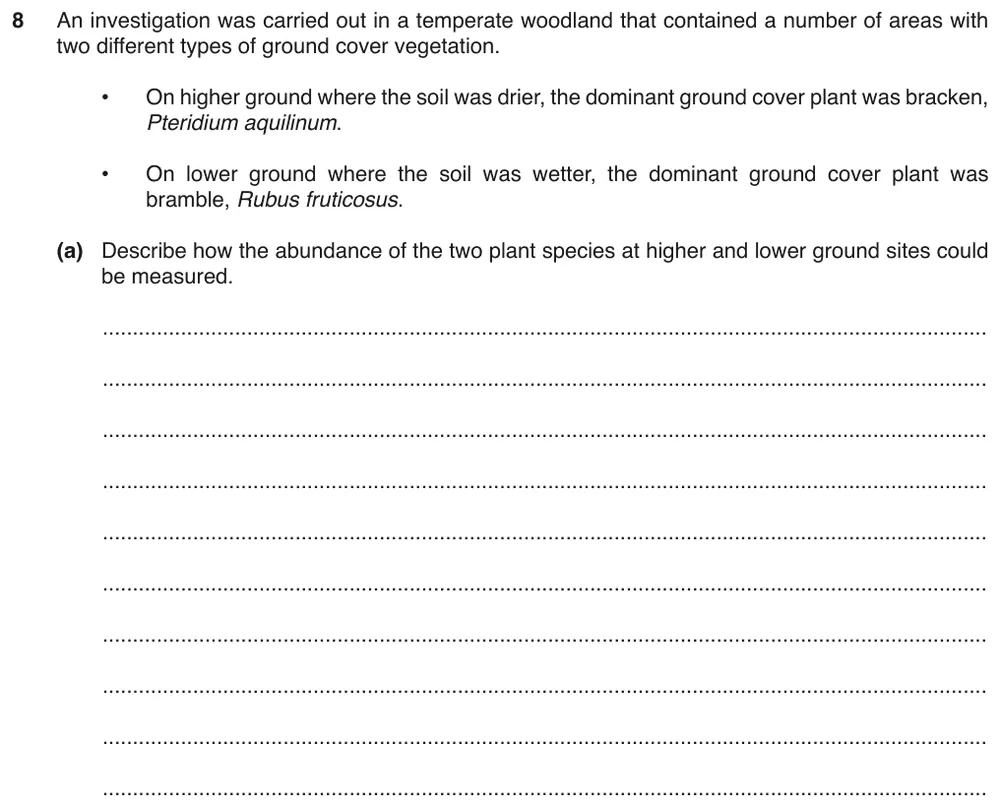
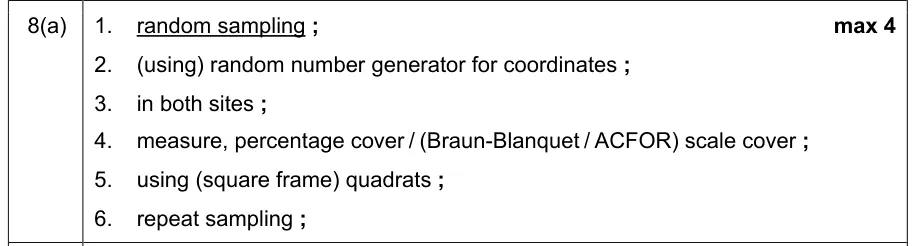
Describe how the abundance of two plant species could be measured at higher and lower ground sites.
Show the mark scheme
Tap an image to open it full size.
From the examiners' report: Most described using quadrats in both areas. Many wrongly described systematic sampling instead of random sampling. Few described measuring percentage cover; most only described identifying and counting all the species in the quadrats.
Question 9
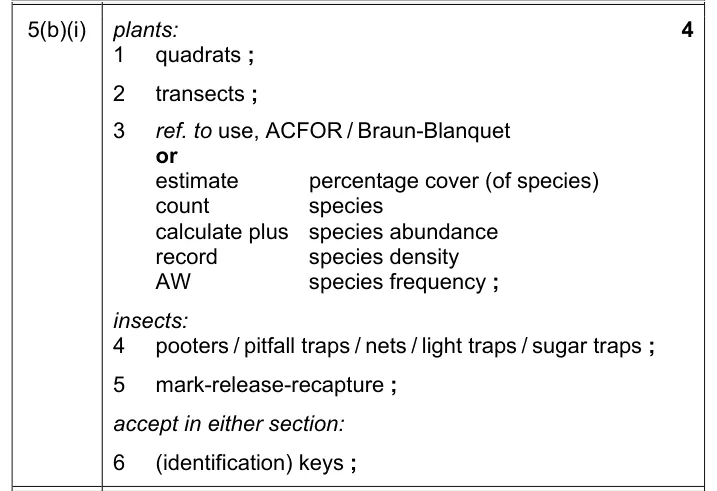
Paper 4 · October/November 2021 (42) · Q5(b)(i) · 4 marks · Hard
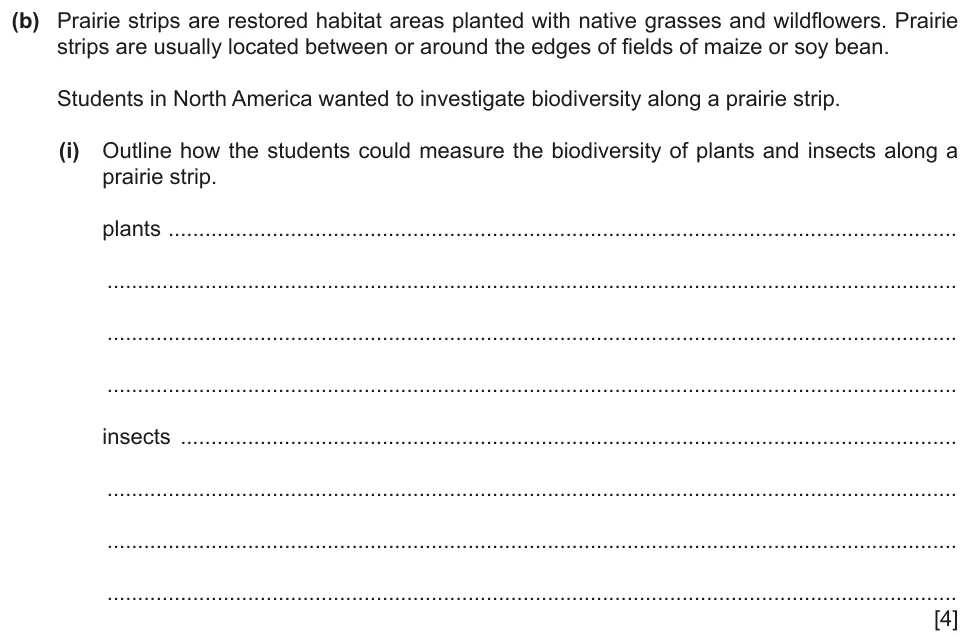
Outline how students could measure the biodiversity of plants and of insects along a prairie strip.
Show the mark scheme
Tap an image to open it full size.
From the examiners' report: Very few gained full marks, mainly through a lack of precision. 'Quadrat' was often misspelt, and descriptions of mark-release-recapture were vague. Few could say how the insects would be captured.
Mark-release-recapture and the Lincoln index (18.2.4)
Question 10
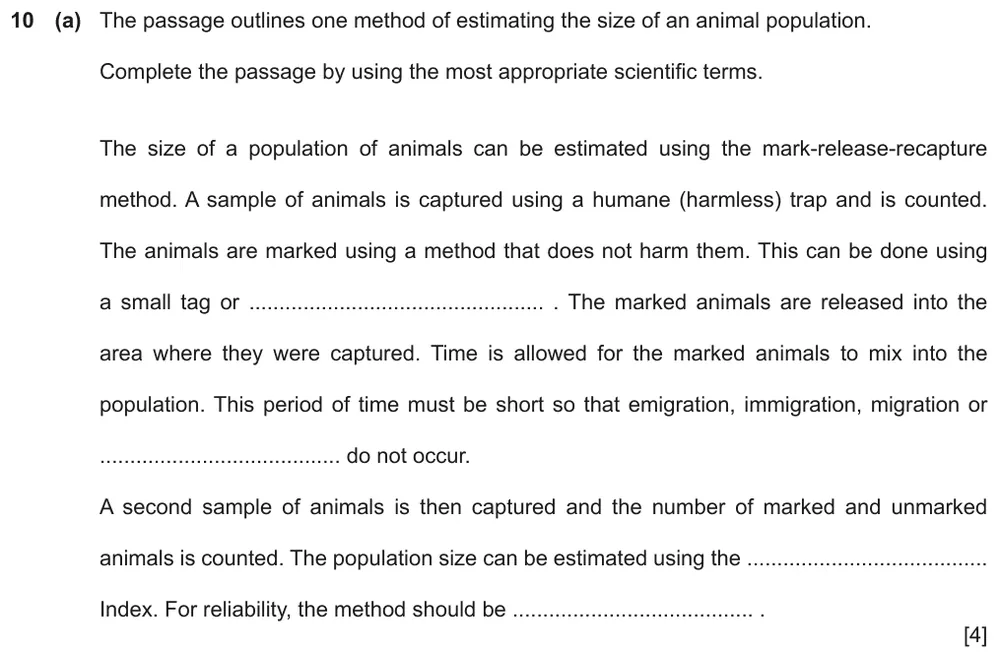
Paper 4 · October/November 2023 (42) · Q10(a) · 4 marks · Hard
Complete the passage about the mark-release-recapture method.
Show the mark scheme

Tap an image to open it full size.
From the examiners' report: For the first gap, 'a marker' needed more detail, such as non-toxic paint or dye, clipping the fur, a collar or a chip. Many named Simpson's index or Pearson's correlation coefficient when the Lincoln index was needed.
Question 11
Paper 4 · May/June 2022 (42) · Q10(a) · 3 marks
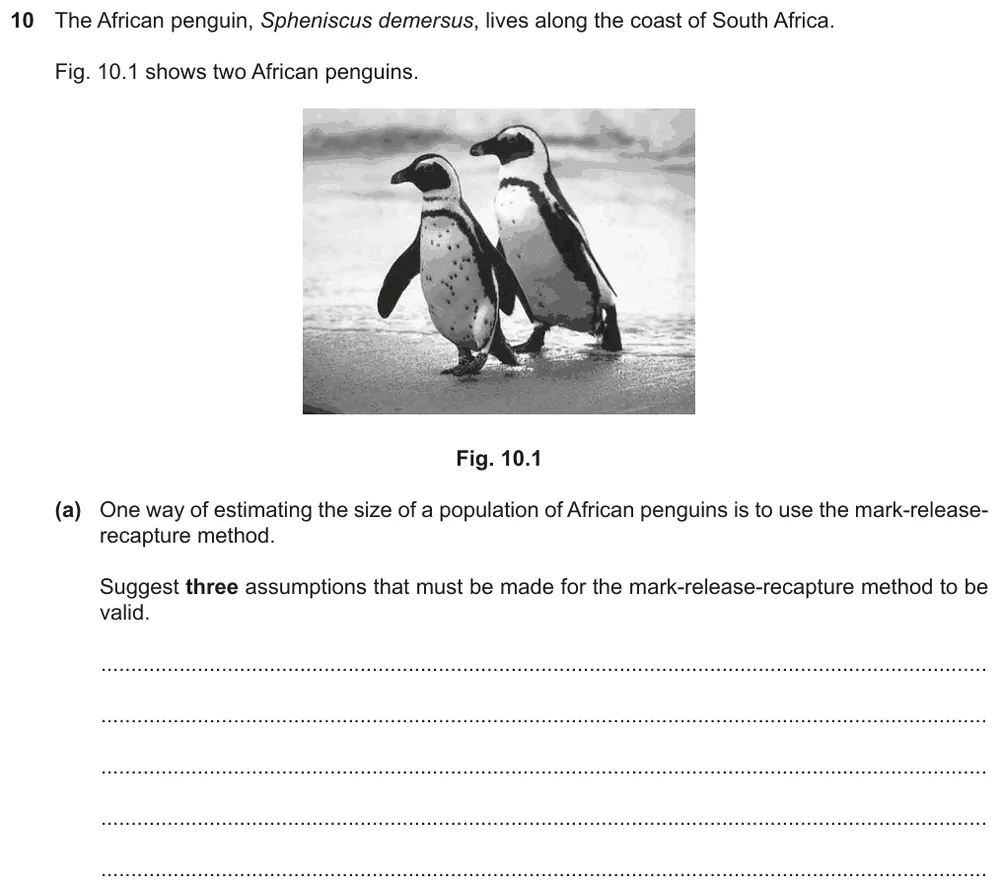
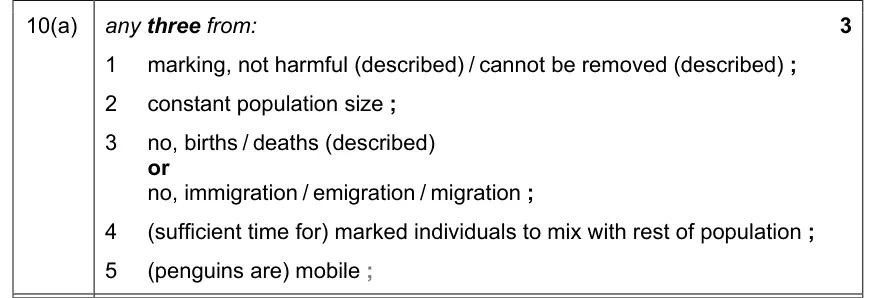
Suggest three assumptions that must be made for the mark-release-recapture method to be valid.
Show the mark scheme
Tap an image to open it full size.
From the examiners' report: The usual correct answers were no migration, no births or deaths, and a mark that does not harm the penguin. Fewer said that time must be left for the marked birds to mix back into the population, or that penguins must be mobile. Many answers confused these with the assumptions of the Hardy-Weinberg equations.
Question 12
Paper 4 · October/November 2024 (41) · Q10(d) · 2 marks
Use the Lincoln index to calculate the size of a population of moths.
Show the mark scheme
Tap an image to open it full size.
Question 13
Paper 4 · October/November 2020 (42) · Q8(a) · 5 marks · Easy
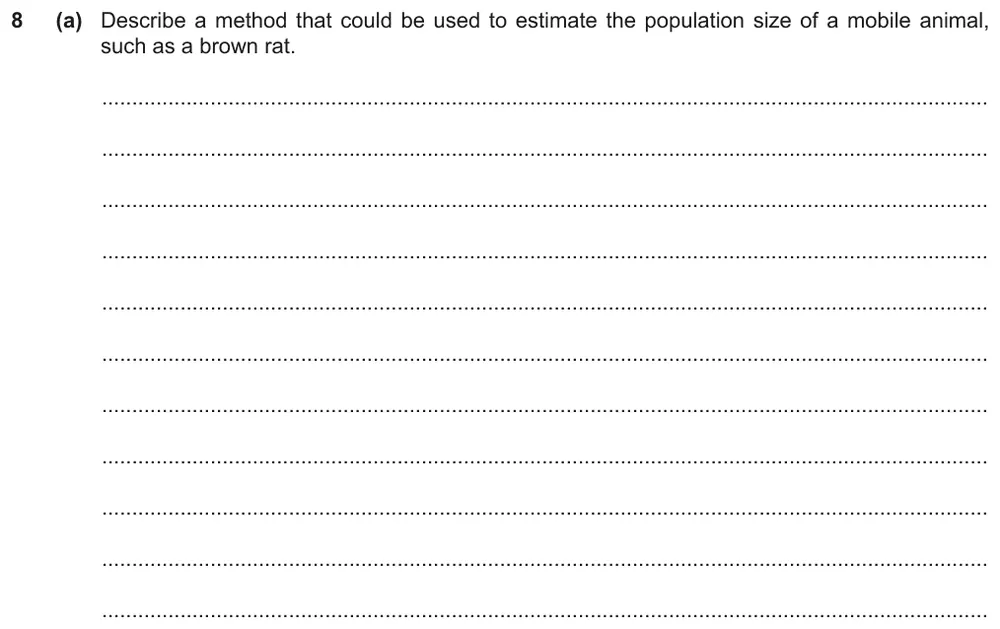
Describe a method that could be used to estimate the population size of a mobile animal, such as a brown rat.
Show the mark scheme
Tap an image to open it full size.
From the examiners' report: Most described marking the rats and catching two separate samples. Answers were imprecise about counting the samples and about leaving enough time for the marked rats to mix with the population. Stronger answers explained the calculation. A few wrongly suggested quadrats or line transects for these mobile animals.
Spearman's rank and Pearson's linear correlation (18.2.5)
Question 14
Paper 4 · October/November 2020 (42) · Q8(b)(i) · 2 marks
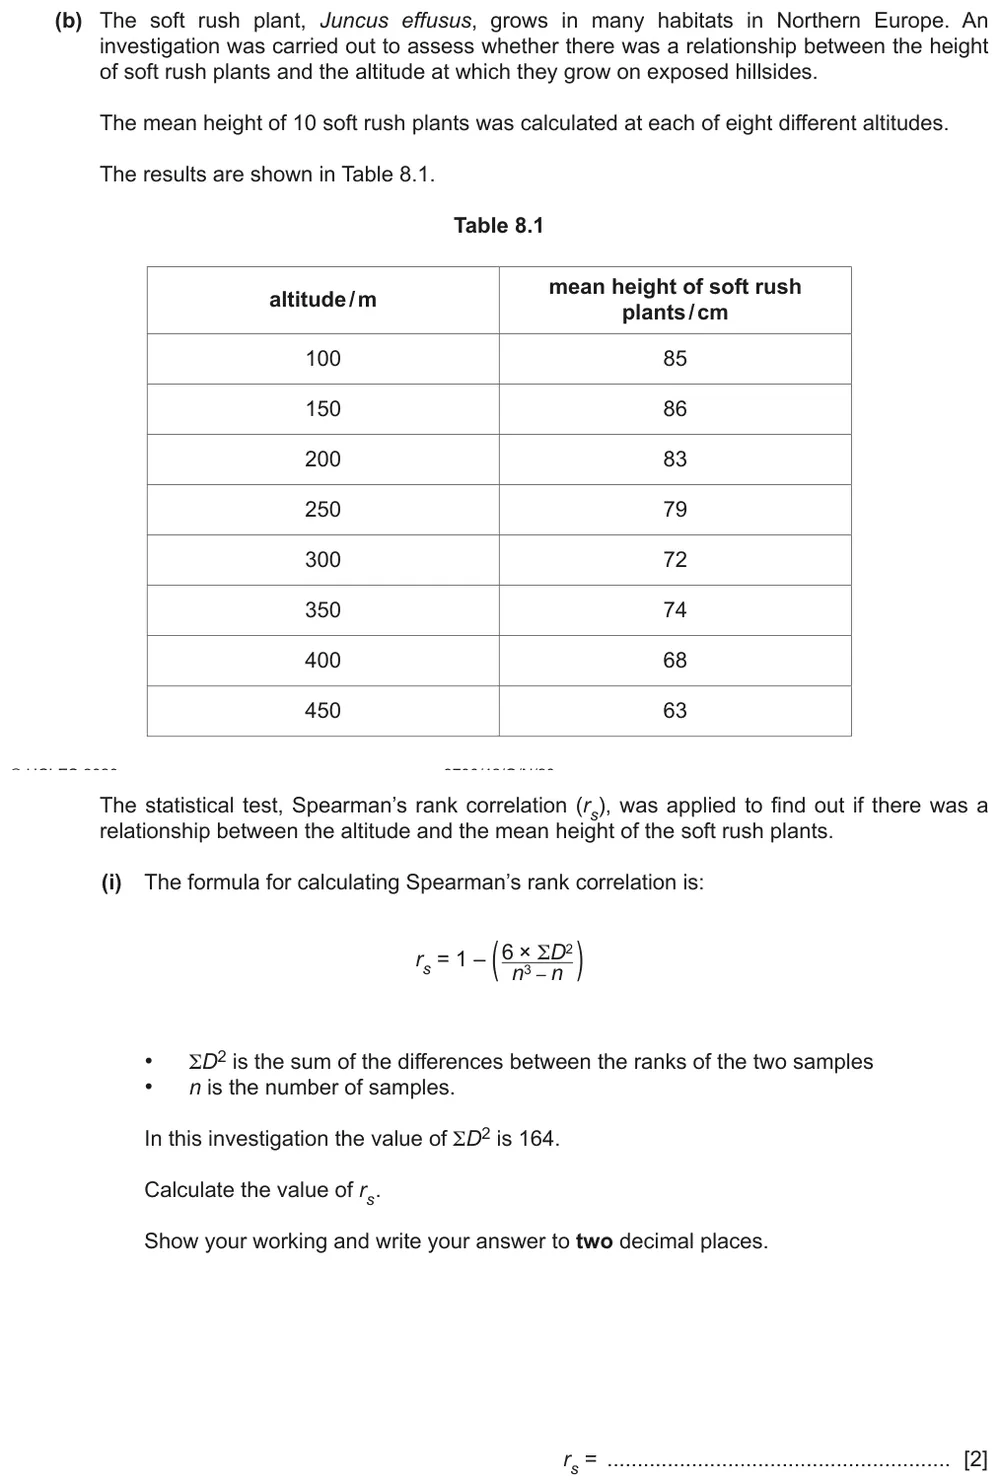
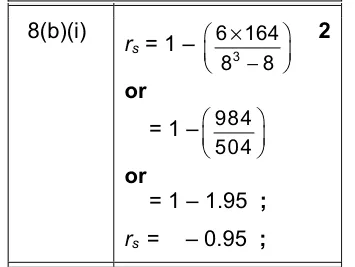
Calculate Spearman's rank correlation for the altitude and mean height of soft rush plants.
Show the mark scheme
Tap an image to open it full size.
From the examiners' report: The values to put into the formula were given, but many students miscounted n from the table and so reached an incorrect value.
Question 15
Paper 4 · October/November 2020 (42) · Q8(b)(ii) · 2 marks · Easy
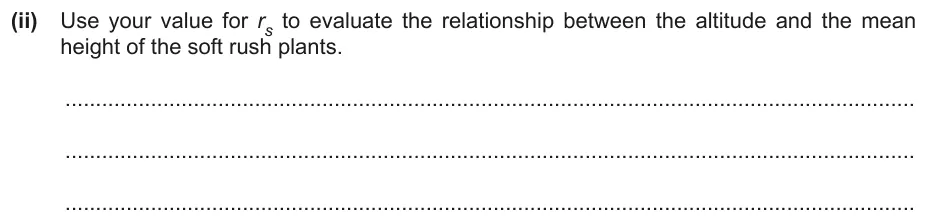
Use your value of rs to evaluate the relationship between altitude and the mean height of the plants.
Show the mark scheme

Tap an image to open it full size.
From the examiners' report: Most gained the mark for describing the negative correlation. Comments on the strength of the correlation, with a value so close to –1, were rare.
Question 16
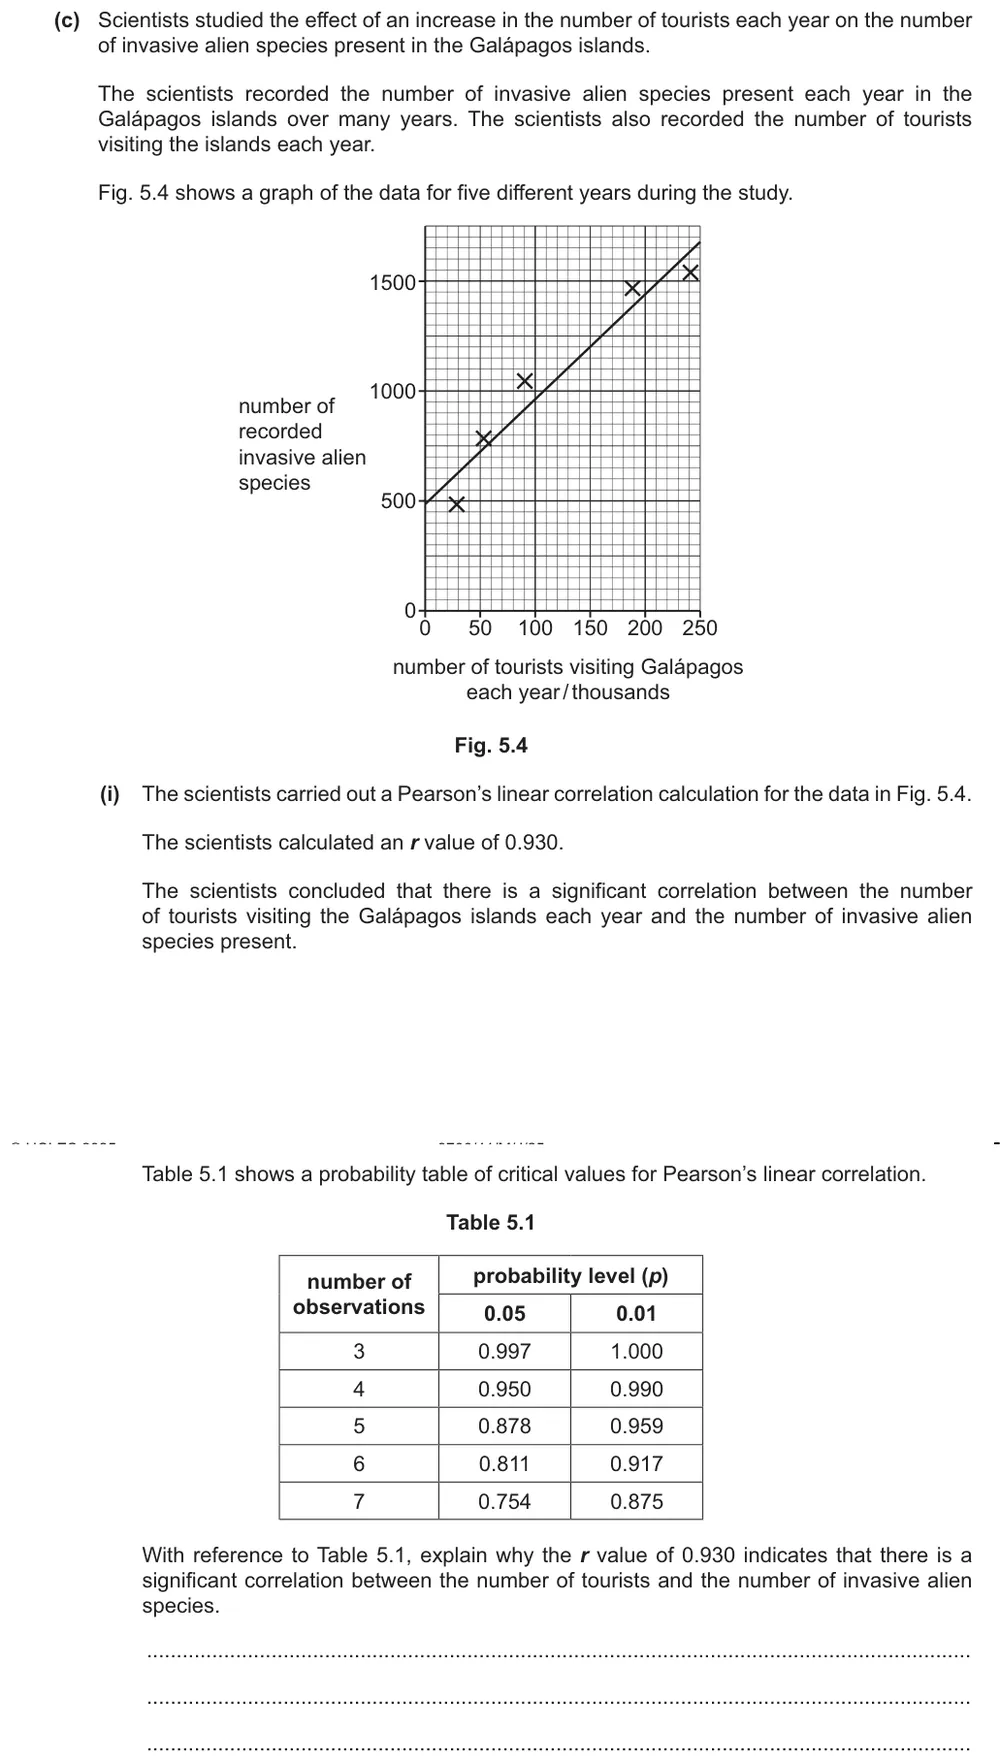
Paper 4 · May/June 2025 (41) · Q5(c)(i) · 2 marks
Use a table of critical values to explain why an r value of 0.930 shows a significant correlation.
Show the mark scheme

Tap an image to open it full size.
Simpson's index of diversity (18.2.6)
Question 17
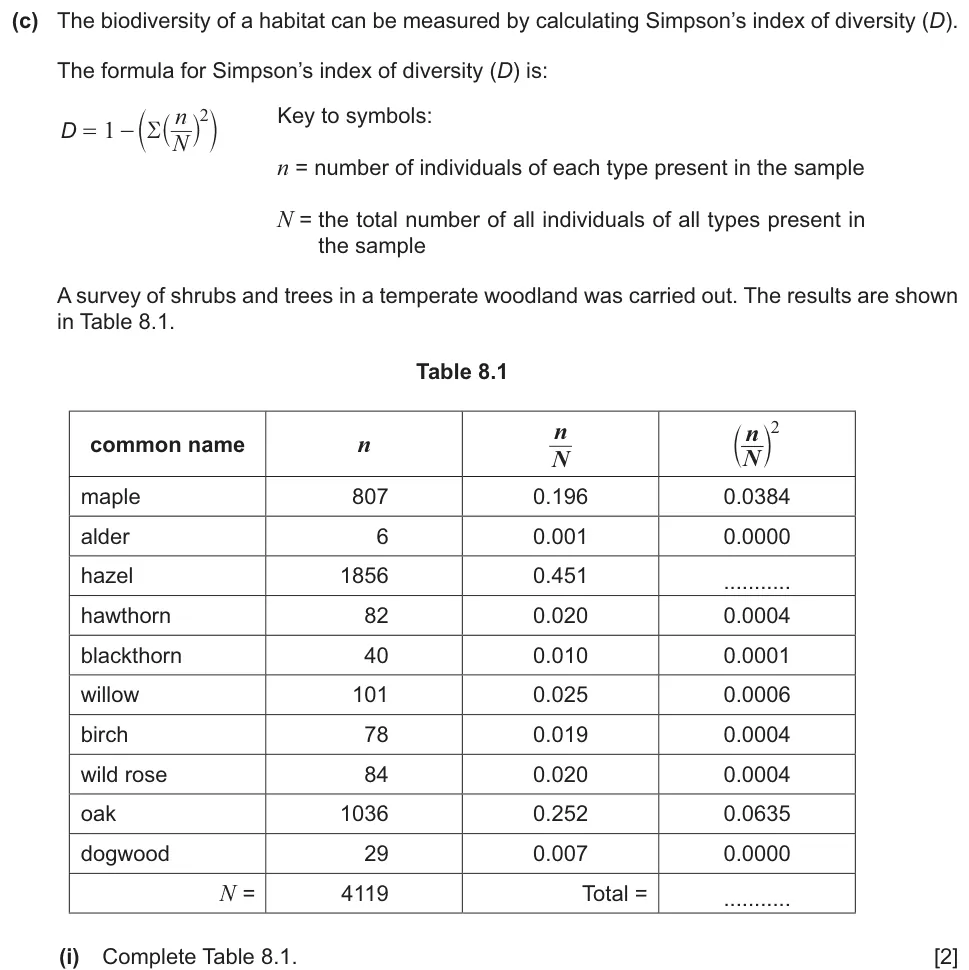
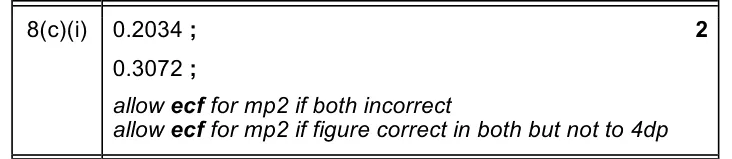
Paper 4 · October/November 2025 (42) · Q8(c)(i) · 2 marks
Complete the table of values needed to calculate Simpson's index of diversity for a woodland.
Show the mark scheme
Tap an image to open it full size.
Question 18
Paper 4 · October/November 2025 (42) · Q8(c)(ii) · 1 mark
Calculate the value of Simpson's index of diversity (D).

Show the mark scheme

Tap an image to open it full size.
Question 19
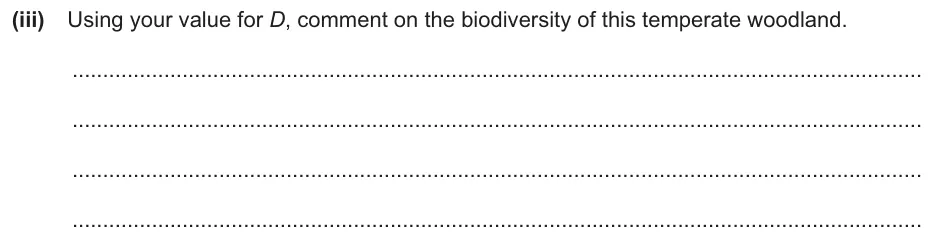
Paper 4 · October/November 2025 (42) · Q8(c)(iii) · 2 marks
Use your value of D to comment on the biodiversity of the woodland.
Show the mark scheme

Tap an image to open it full size.
Question 20
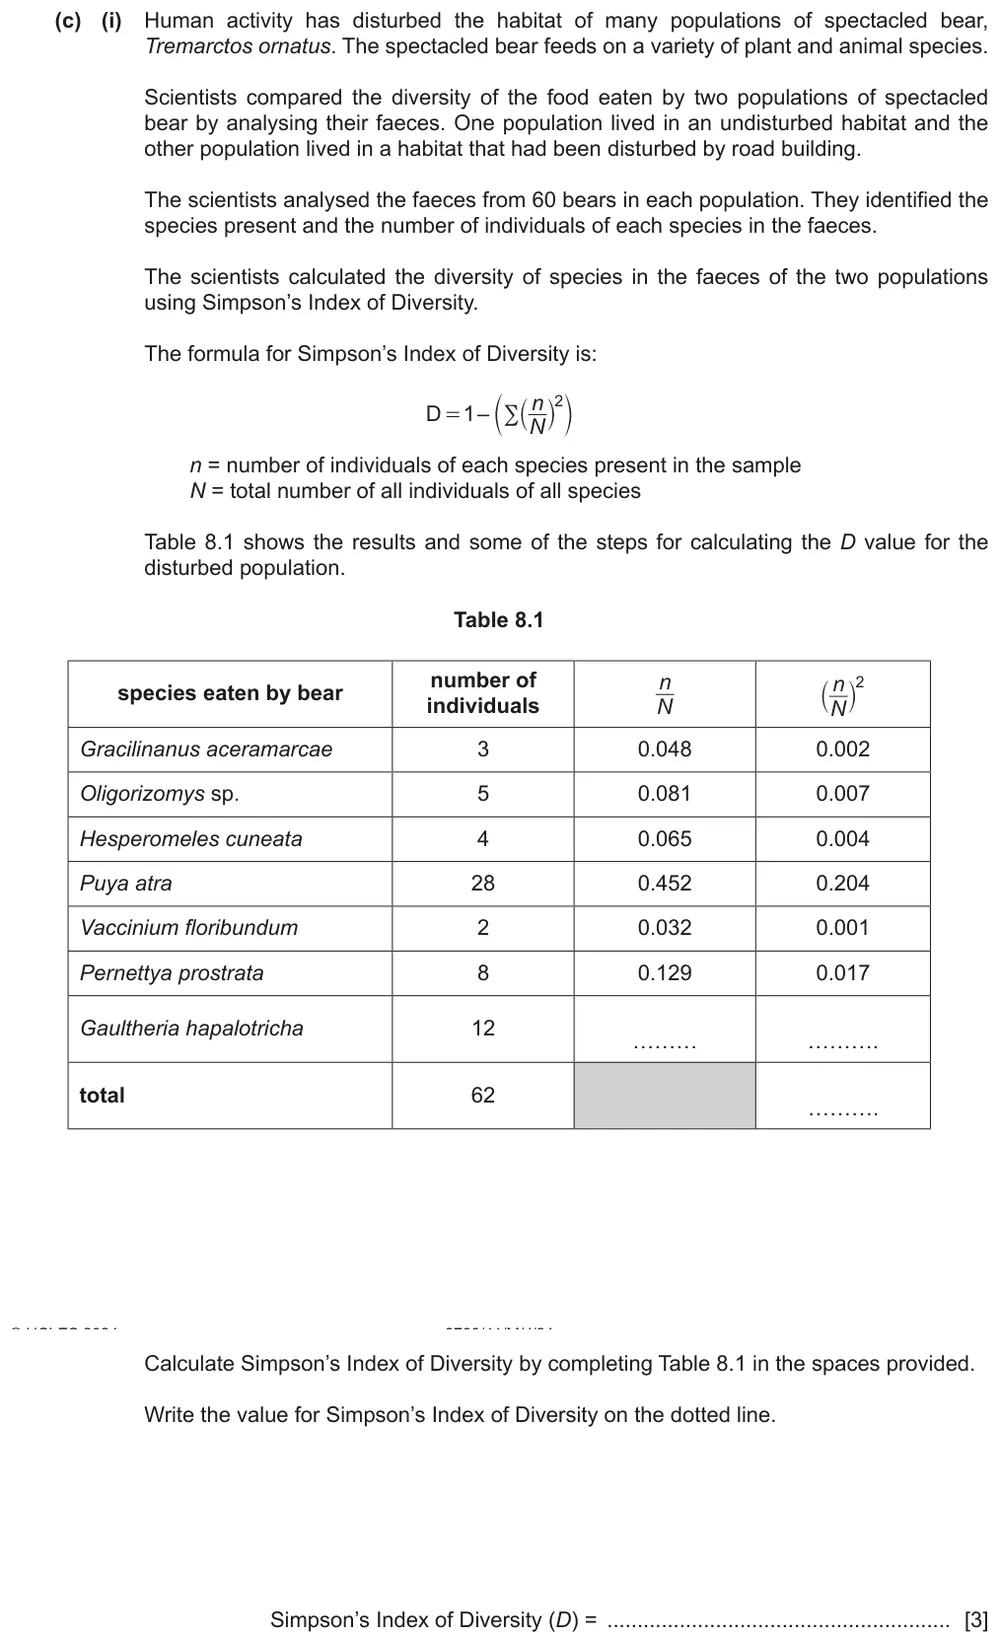
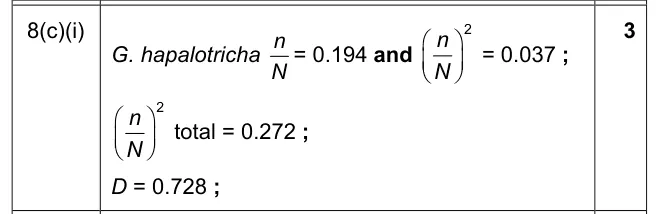
Paper 4 · May/June 2024 (41) · Q8(c)(i) · 3 marks · Easy
Complete the table and calculate Simpson's index of diversity for the food eaten by a population of bears.
Show the mark scheme
Tap an image to open it full size.
From the examiners' report: Most completed the table correctly, to the same number of decimal places as the other values, and reached 0.728. The occasional errors were forgetting the final step of subtracting the total from 1, and leaving the value for Gaultheria hapalotricha out of the total.
Question 21
Paper 4 · May/June 2024 (41) · Q8(c)(ii) · 1 mark
Explain what the difference in the D values of the two populations shows.

Show the mark scheme

Tap an image to open it full size.
From the examiners' report: Most explained that a higher value of D means more diversity. Some answers did not address the question and wrote about a significant difference instead.
Question 22
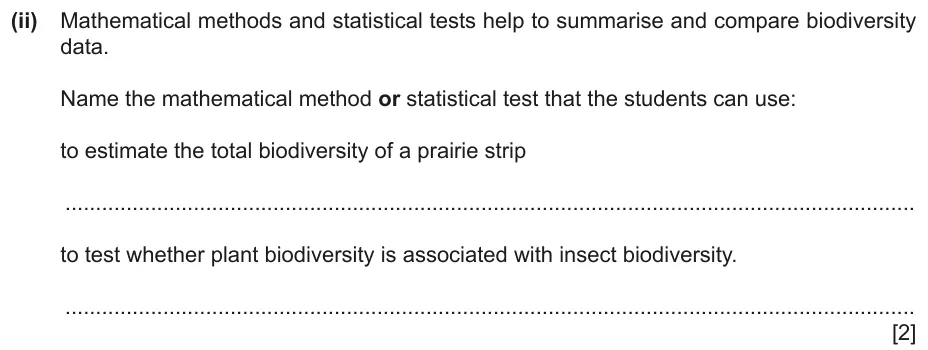
Paper 4 · October/November 2021 (42) · Q5(b)(ii) · 2 marks
Name the mathematical method or statistical test to use for each of two purposes.
Information from earlier in this question:

Show the mark scheme

Tap an image to open it full size.
From the examiners' report: Many different incorrect tests were suggested, including chi-squared, Hardy-Weinberg and t-tests. Occasionally the names of the tests were mixed up.
Where students lose marks (from Cambridge examiners' reports and mark schemes)
Each point below comes from the examiners' reports and mark schemes, and is followed by wording that gained marks.
An ecosystem includes every organism. Students mentioned interactions and a community but did not recognise that an ecosystem includes all of the organisms present, so the definition was incomplete.
✔ Gains credit: a 'self-contained unit', 'all living organisms of all species', 'interactions', and 'abiotic and biotic factors'.
Self-contained is the key idea. Students did not start from the idea that an ecosystem is a defined, self-contained area, so their explanations were vague.
✔ Gains credit: an 'ecosystem is a defined area / self-contained / a functional unit', and Italy 'consists of multiple' forests, water bodies, towns and agricultural fields.
Levels are not low, medium and high. Students asked for the level of biodiversity shown in each image wrote 'low', 'medium' or 'high'.
✔ Gains credit: 'species', 'genetic' and 'habitat / ecosystem'.
Variety of habitats, not more habitat. Students did not refer to the levels of biodiversity, or said only that more habitat becomes available.
✔ Gains credit: 'increase in variety of habitats / ecosystems', 'increase number of species', 'increase abundance of organisms within a species', 'increase in genetic variation'.
Random sampling, then percentage cover. Students described systematic sampling, and only identified and counted the species in each quadrat.
✔ Gains credit: 'random sampling' using a 'random number generator for coordinates', then 'measure percentage cover' 'using quadrats' and 'repeat sampling'.
Say how the animals are marked. Students wrote that 'a marker' is used, and named Simpson's index or Pearson's correlation instead of the Lincoln index.
✔ Gains credit: 'dye / paint / clipping fur / collar / electronic chip', and the 'Lincoln' index.
These are not the Hardy-Weinberg assumptions. Students gave the assumptions of the Hardy-Weinberg equations, and few mentioned mixing or that the animals must be mobile.
✔ Gains credit: 'marking not harmful', 'no births / deaths', 'no immigration / emigration', 'marked individuals to mix with rest of population', the animals are 'mobile'.
Subtract the total from 1. Students missed the final step of the Simpson's index calculation, or left one species out of the total.
✔ Gains credit: 'total = 0.272', so 'D = 0.728'.
Download the questions
Download the PDF pack (22 questions, mark schemes at the end)
Keep practising
- Classification (18.1): Cambridge (CIE) exam questions by topic
- Conservation (18.3): Cambridge (CIE) exam questions by topic
- Cambridge (CIE) A level Biology 9700 past papers, mark schemes and examiners' reports
- Cambridge (CIE) A level Biology grade thresholds
- Book a one-to-one CIE lesson or a free 15-minute discovery chat with Tom
- Register your interest in a CIE A level Biology group class
Questions, mark schemes and examiners' report extracts © Cambridge University Press & Assessment.