

Required practicals 3 and 11 use the same two skills: making a dilution series and using a calibration curve. In required practical 3 you put pieces of plant tissue, usually potato, into a dilution series of sucrose solution, plot the ratio of final to initial mass against concentration, and read off where there is no change to find the water potential of the tissue. In required practical 11 you dilute a glucose solution, add Benedict's reagent, measure each standard with a colorimeter and plot a calibration curve to find the glucose concentration of an unknown 'urine' sample. On the AQA papers they come up in unfamiliar settings: eggs, mangrove roots, creatinine, lugworm blood and beetroot pigment.
The examiners' reports show where students lose marks: writing 'dilution' instead of dilution series, getting the volumes wrong for a simple dilution, not calculating the ratios before plotting, writing 'amount' instead of volume, forgetting to dry the tissue before reweighing, and describing how to make a calibration curve when the question asks how to use one.
Answer each question on paper before you open the mark scheme. If you'd like help with the required practicals, my AQA masterclasses run online on Tuesdays at 5.15pm for Year 12 and on Wednesdays or Thursdays at 6.30pm for Year 13.
What you need from GCSE and Year 12
Each question on this page assumes you're secure on these GCSE and Year 12 ideas. If any of them feels shaky, revise it before you start.
- GCSE: the osmosis required practical: potato pieces in sugar or salt solutions gain mass in dilute solutions and lose it in concentrated ones, and percentage change in mass allows a fair comparison.
- GCSE: Benedict's test for reducing sugars gives a colour change from blue through green and yellow to brick red as the sugar concentration rises.
- GCSE: independent, dependent and control variables, and plotting a line graph with the independent variable on the x-axis.
- Year 12 (AQA 3.2.3): osmosis is the movement of water from a higher to a lower water potential across a partially permeable membrane.
- Year 12 (AQA 3.1.2 and RP 1): reducing sugars and the Benedict's test, and using a colorimeter to measure absorbance. See the Carbohydrates and Required practical 1 pages.
Key terms
These words come up in the questions and mark schemes. Examiners expect you to use them exactly.
- Dilution series: a set of solutions of known, decreasing concentration made by diluting a stock solution with distilled water; a serial dilution dilutes each solution by the same factor to make the next.
- Stock solution: the concentrated solution of known concentration that the dilutions are made from.
- Calibration curve: a graph of readings (such as absorbance or ratio of final to initial mass) against known concentrations, used to read off the concentration of an unknown sample.
- Interpolate: read a value from between the plotted points: draw a line across from the reading to the curve, then down to the x-axis.
- Colorimeter: an instrument that shines light through a solution and measures how much is absorbed (absorbance) or passes through (transmission). Not a calorimeter.
- Absorbance: how much light a coloured solution absorbs; more concentrated (more coloured) solutions have higher absorbance and lower transmission.
- Colour standards: a dilution series of known concentrations kept to compare an unknown against by eye when there is no colorimeter.
- Water potential of plant tissue: equal to the water potential of the solution in which the tissue neither gains nor loses mass (ratio of final to initial mass = 1).
- Independent variable: the variable you change, here the concentration of the solution in the dilution series.
- Dependent variable: the variable you measure, such as the change in mass (or ratio of final to initial mass) or the absorbance.
- Control variable: a variable kept the same so the comparison is valid, such as tissue size, volume of solution, temperature, time, and the volume of reagent added.
What these questions cover (AQA required practicals 3 and 11)
The questions come from the third and eleventh required practicals in the AQA AS and A-level Biology specification (7401/7402), and test these statements and practical skills:
- Required practical 3: Production of a dilution series of a solute to produce a calibration curve with which to identify the water potential of plant tissue (the questions tagged to required practical 3 in the bank; two use a density or colour calibration rather than plant tissue mass)
- Required practical 11: Production of a dilution series of a glucose solution and use of colorimetric techniques to produce a calibration curve with which to identify the concentration of glucose in an unknown ‘urine’ sample (none of the AQA questions uses glucose itself: they apply the same colorimeter method to creatinine, protein, lugworm blood and beetroot pigment)
- AT c use laboratory glassware apparatus for a variety of experimental techniques to include serial dilutions
- MS 0.3 Use ratios, fractions and percentages
- MS 3.2 Plot two variables from experimental or other data
- MS 3.4 Determine the intercept of a graph
- AT b use appropriate instrumentation to record quantitative measurements, such as a colorimeter or potometer
- PS 3.1 Plot and interpret graphs
- PS 2.3 Evaluate results and draw conclusions with reference to measurement uncertainties and errors
- PS 2.1 Comment on experimental design and evaluate scientific methods
How to use this page
Write your answer on paper before you open the mark scheme. Allow about 1.3 minutes per mark: the 13 questions are worth 34 marks, so about 44 minutes in total. Then mark your answer strictly against the mark scheme and read the examiners' tip underneath it. If you'd rather print the questions, download the PDF pack.
Making a dilution series
Question 1
AS Paper 1 · June 2017 · Q08.2 · 1 mark · Hard
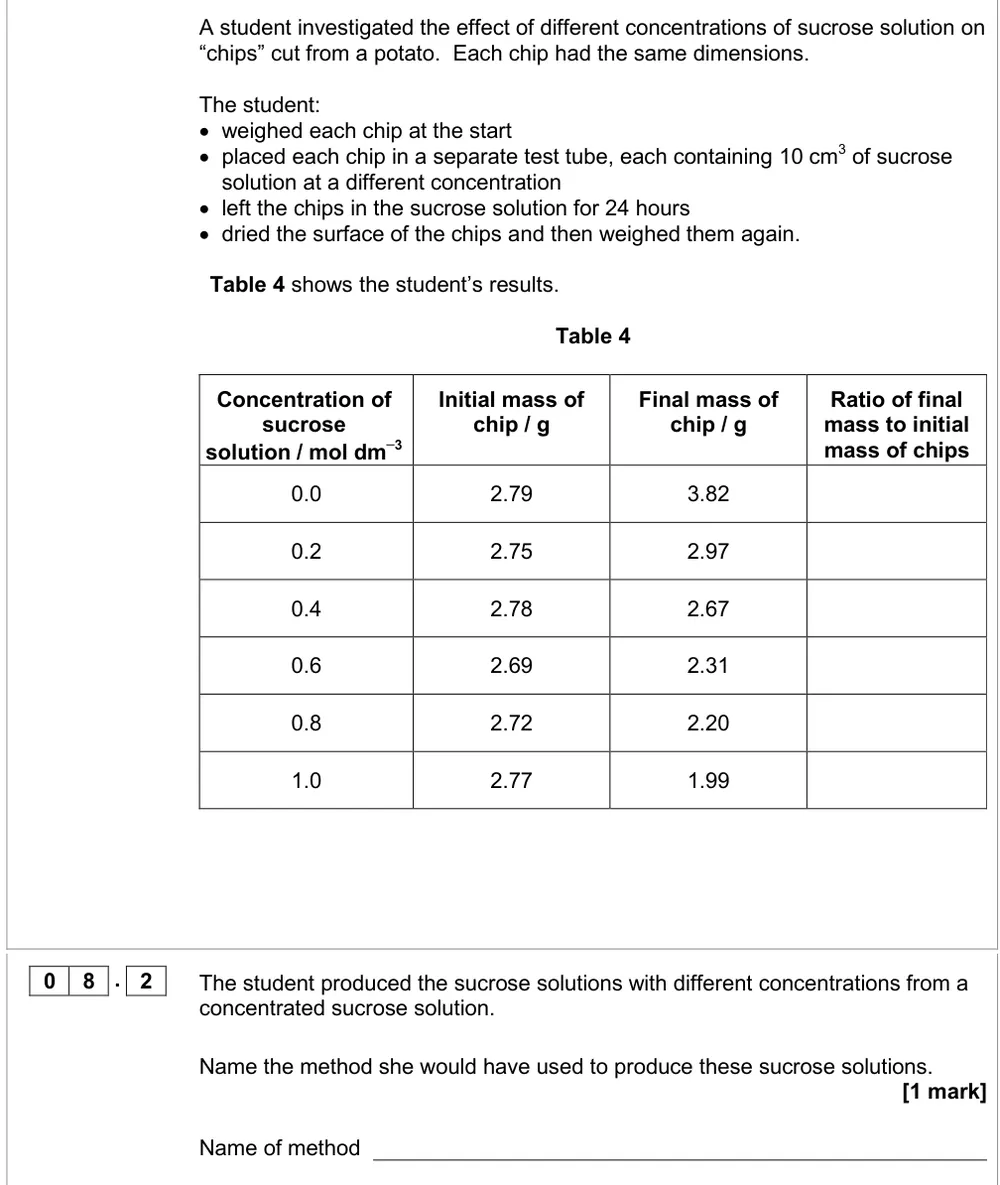
Name the method used to make sucrose solutions of different concentrations from a concentrated solution.
Show the mark scheme

Tap an image to open it full size.
From the examiners' report: Only 28% got this. 'Dilution' on its own isn't enough: write dilution series.
Question 2
AS Paper 2 · June 2023 · Q08.1 · 2 marks · Medium
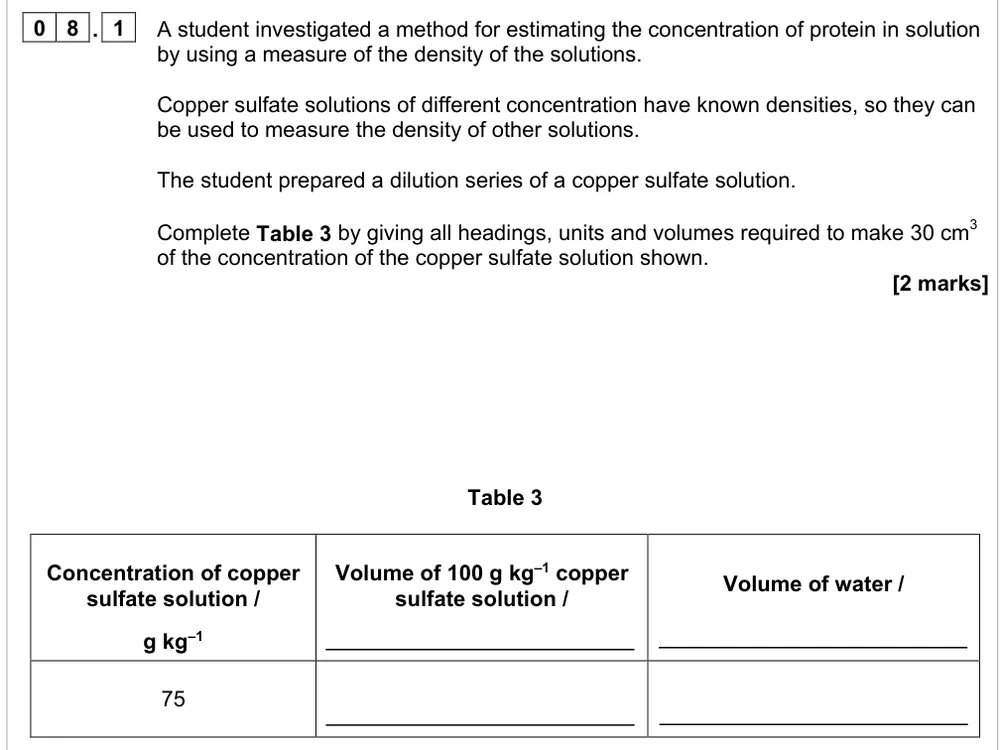
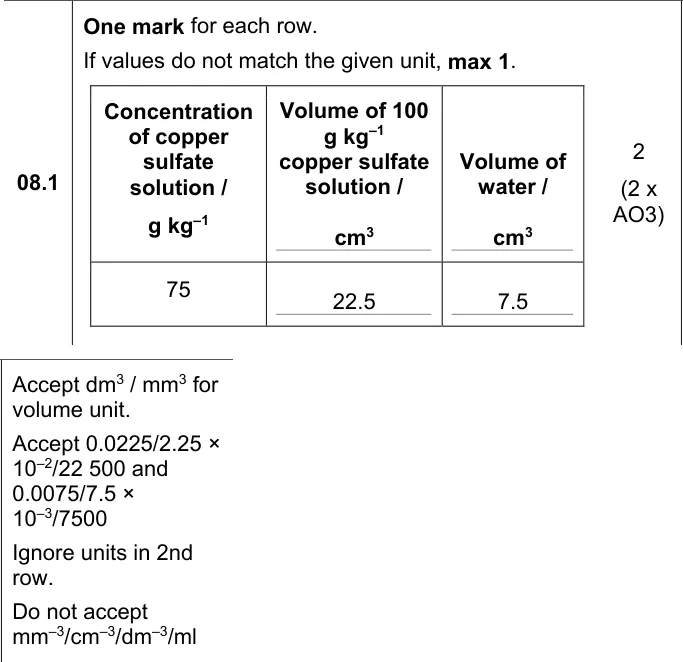
Complete the headings, units and volumes to make 30 cm³ of 75 g kg⁻¹ copper sulfate solution.
Show the mark scheme
Tap an image to open it full size.
From the examiners' report: Only a quarter got both marks for this simple dilution. 75 ÷ 100 × 30 = 22.5 cm³ of stock, and the water makes it up to 30 cm³.
Required practical 3: water potential of plant tissue
Question 3
AS Paper 1 · June 2017 · Q08.3 · 3 marks · Medium
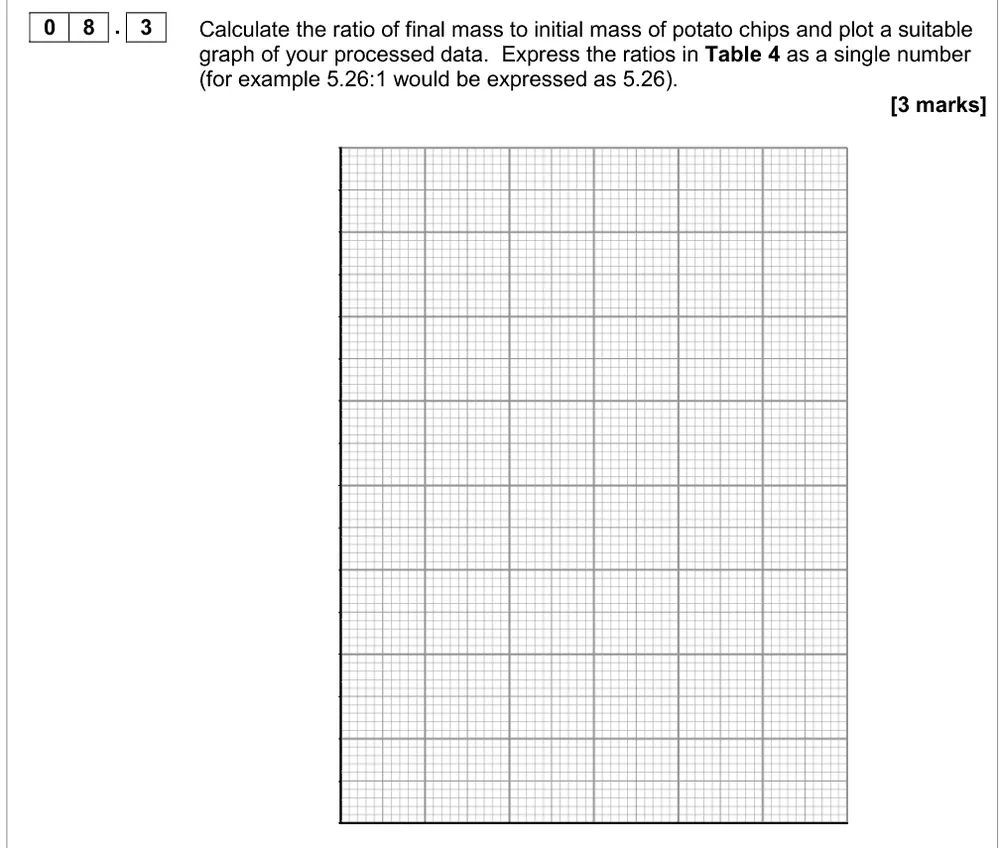
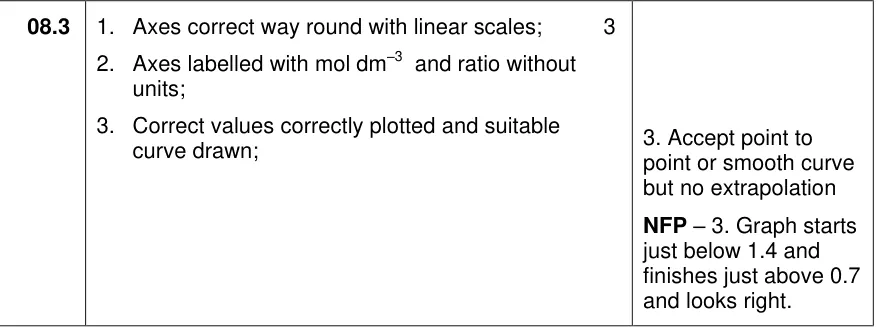
Calculate the ratio of final to initial mass for each potato chip and plot a suitable graph.
Show the mark scheme
Tap an image to open it full size.
From the examiners' report: Only 22% got all three, mainly because they couldn't work out the ratios. Divide final by initial mass for each row first (3.82 ÷ 2.79 = 1.37), then put concentration on the x-axis.
Question 4
AS Paper 1 · November 2021 · Q08.4 · 4 marks
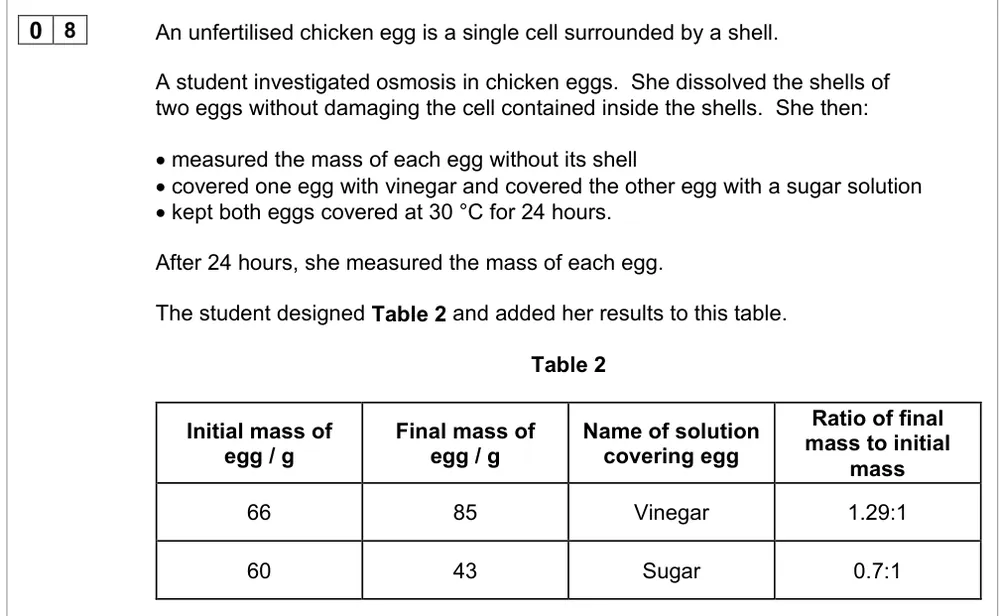
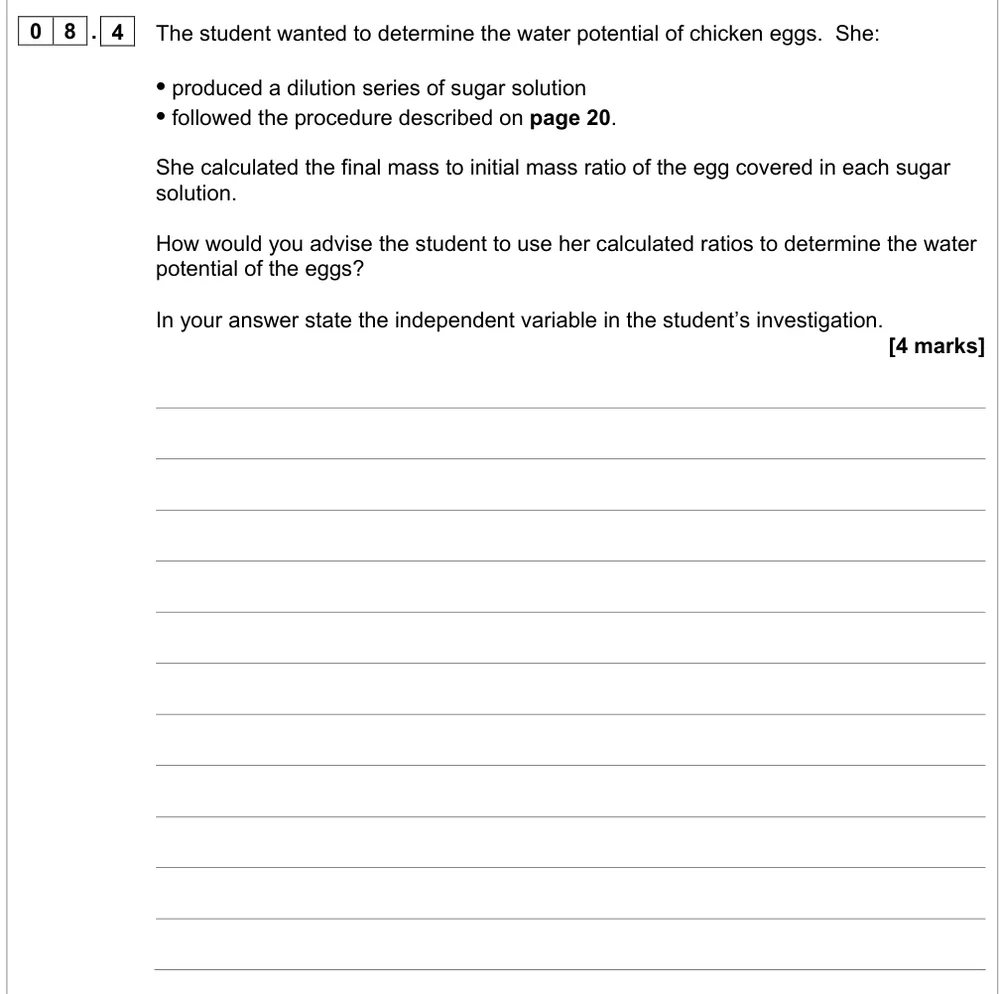
Advise the student how to use her mass ratios to find the water potential of chicken eggs.
Information from earlier in this question:
Show the mark scheme
Tap an image to open it full size.
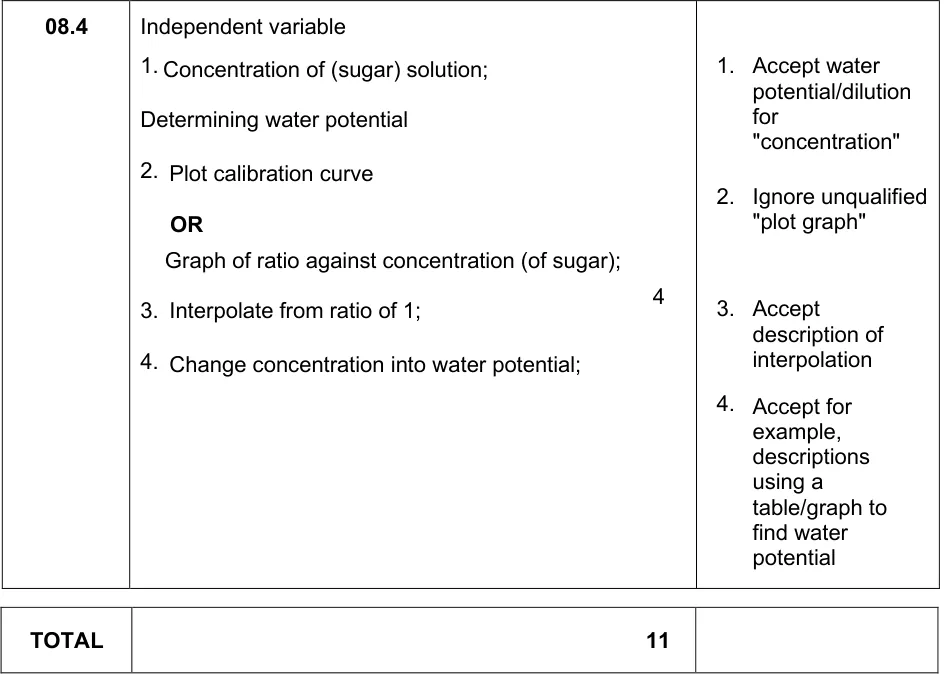
From the examiners' report: There's no examiners' report for this paper, so this tip comes from the mark scheme. Name the independent variable, then plot ratio against concentration, read off where the ratio is 1, and convert that concentration into a water potential.
Question 5
A level Paper 1 · June 2022 · Q06.3 · 4 marks · Medium
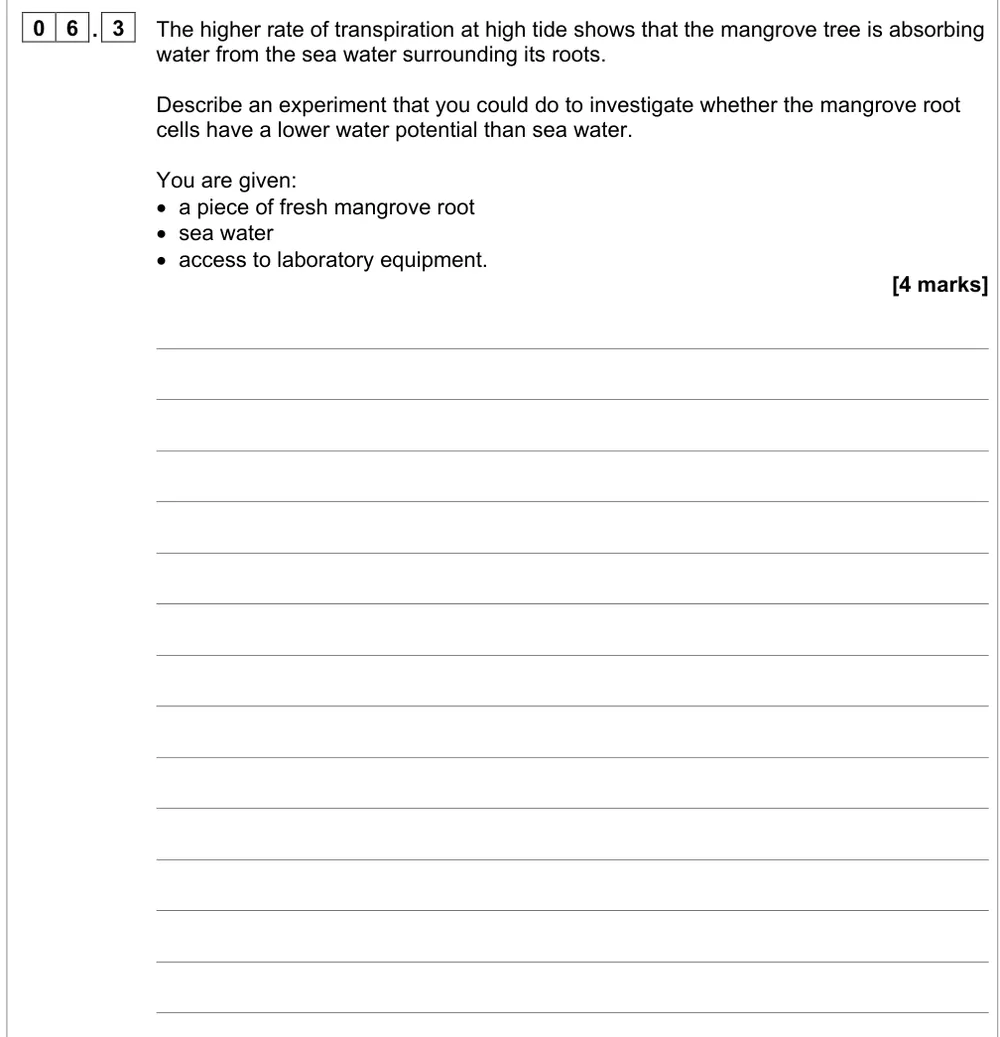
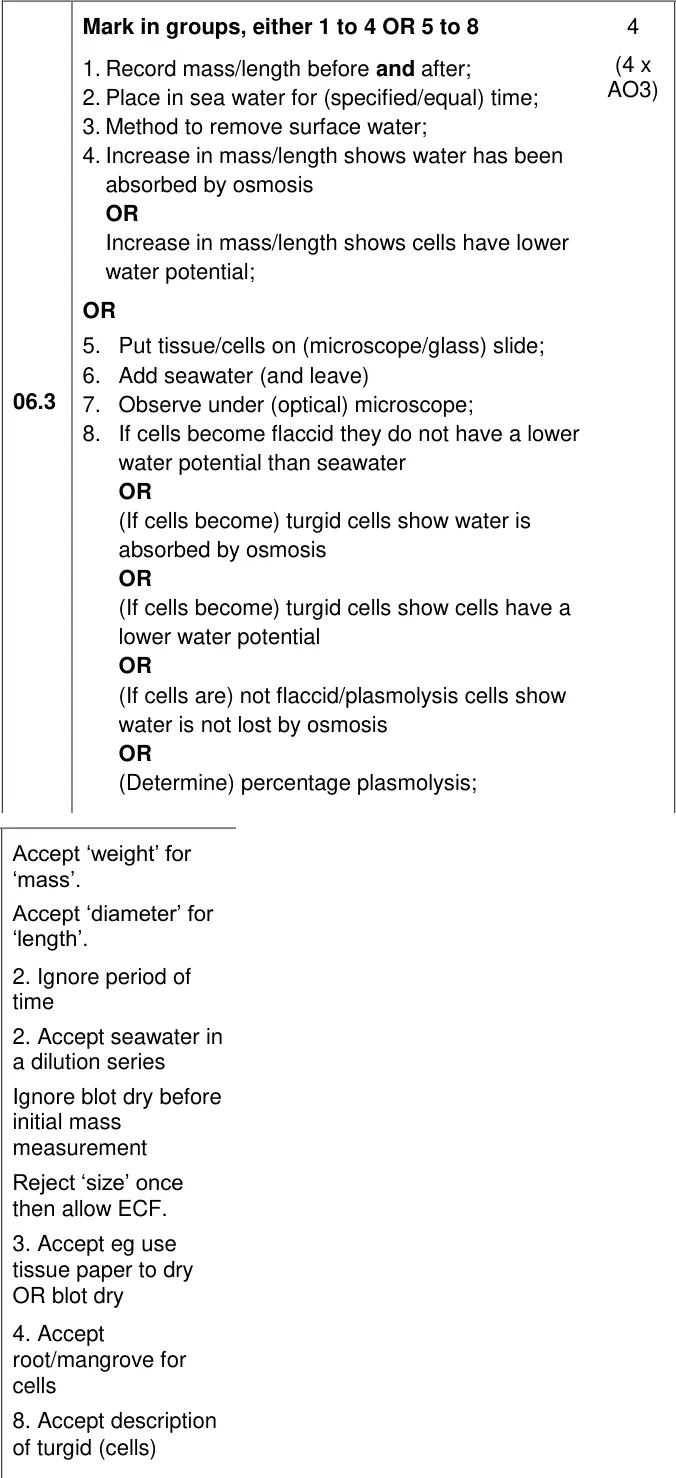
Describe an experiment to find out whether mangrove root cells have a lower water potential than sea water.
Show the mark scheme
Tap an image to open it full size.
From the examiners' report: A third got full marks. Say how you'll dry the root before reweighing, and remember water (not sea water) moves by osmosis. A dilution series wasn't needed and a potometer scored nothing.
Reading values from a calibration
Question 6
AS Paper 2 · June 2023 · Q08.2 · 2 marks
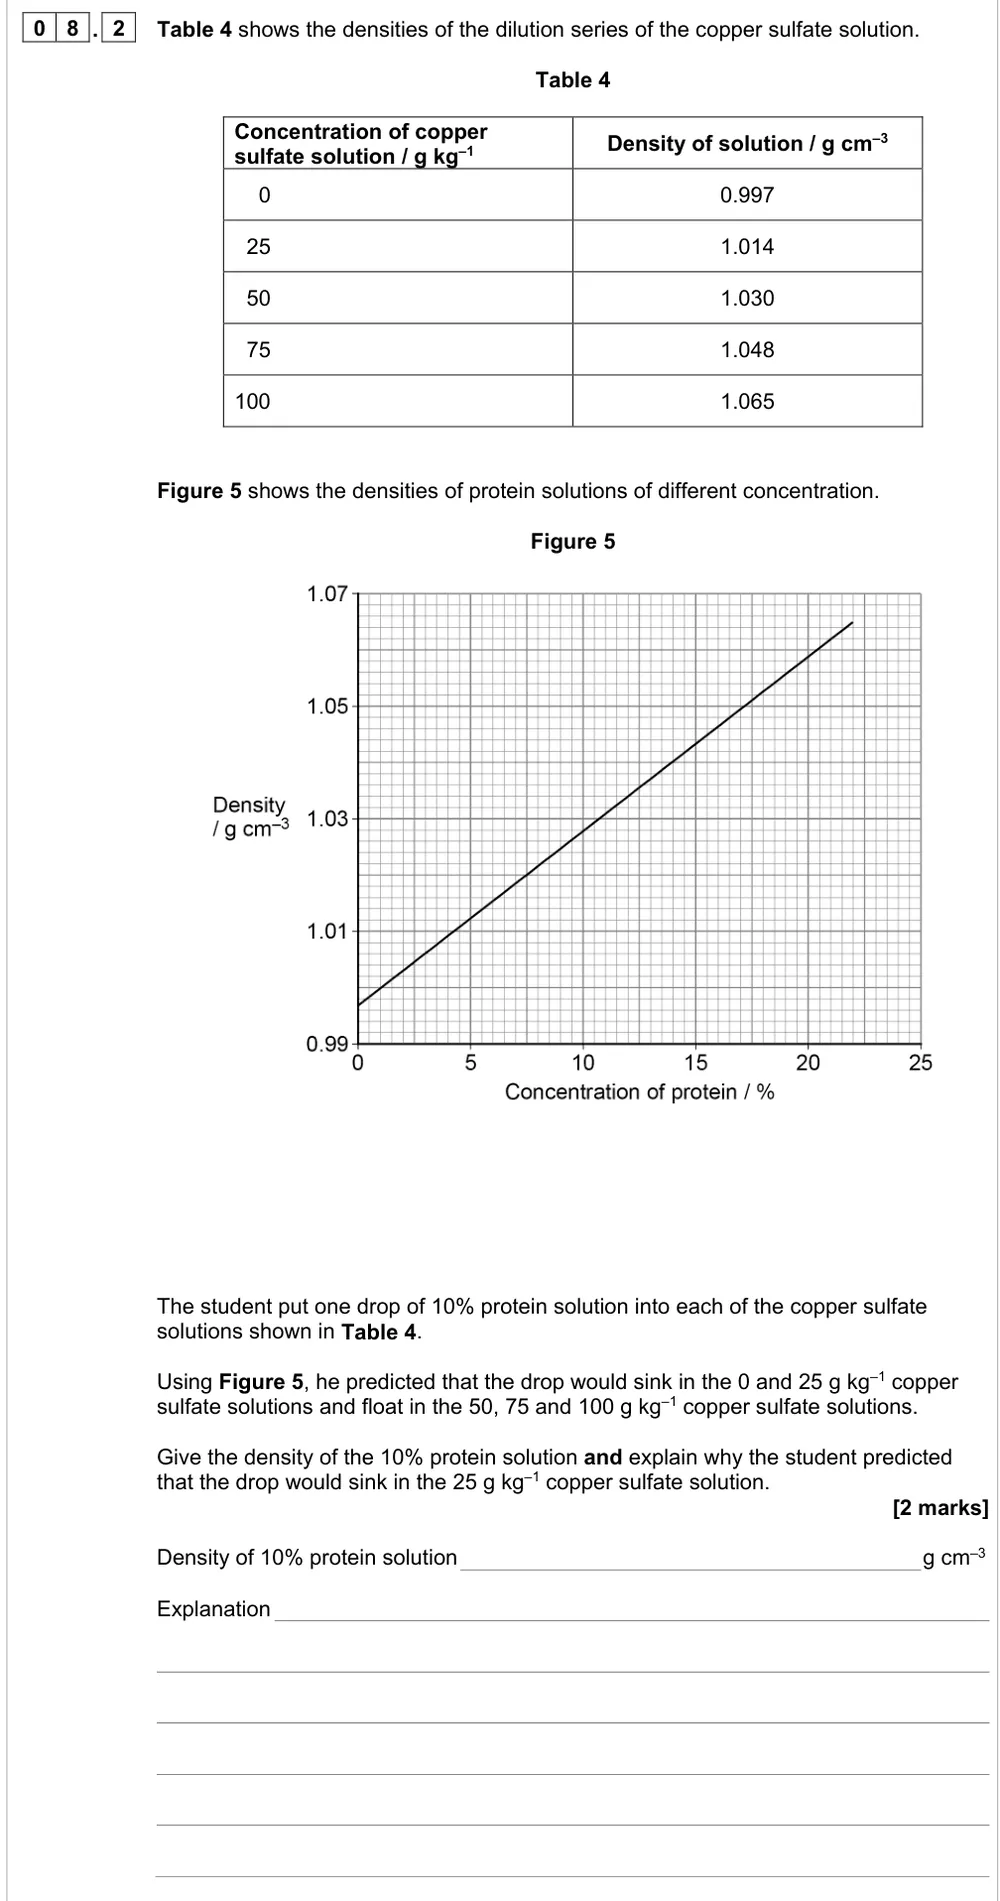
Read the density of a 10% protein solution from a graph and explain why a drop sinks in 25 g kg⁻¹ copper sulfate.
Show the mark scheme

Tap an image to open it full size.
From the examiners' report: Many used the table and graph well. Read across carefully from 10% on Figure 5, then compare the density with 1.014 g cm⁻³.
Question 7
AS Paper 2 · June 2023 · Q08.3 · 1 mark
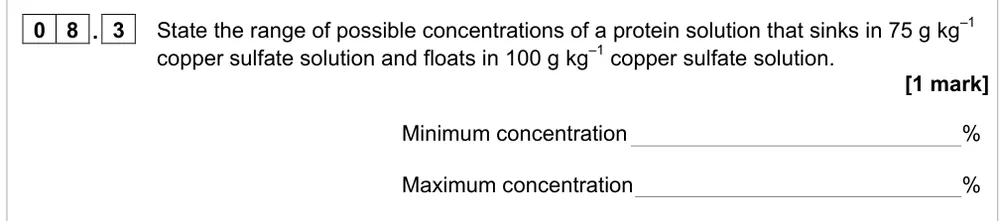
Give the range of protein concentrations that sink in 75 g kg⁻¹ and float in 100 g kg⁻¹ copper sulfate.
Show the mark scheme

Tap an image to open it full size.
From the examiners' report: Marks were lost by misreading the graph scales, and many left it blank. Read 1.048 and 1.065 g cm⁻³ across to the line and down to the concentration axis.
Required practical 11: colorimetric calibration curves
Question 8
A level Paper 2 · November 2020 · Q04.2 · 4 marks · Medium
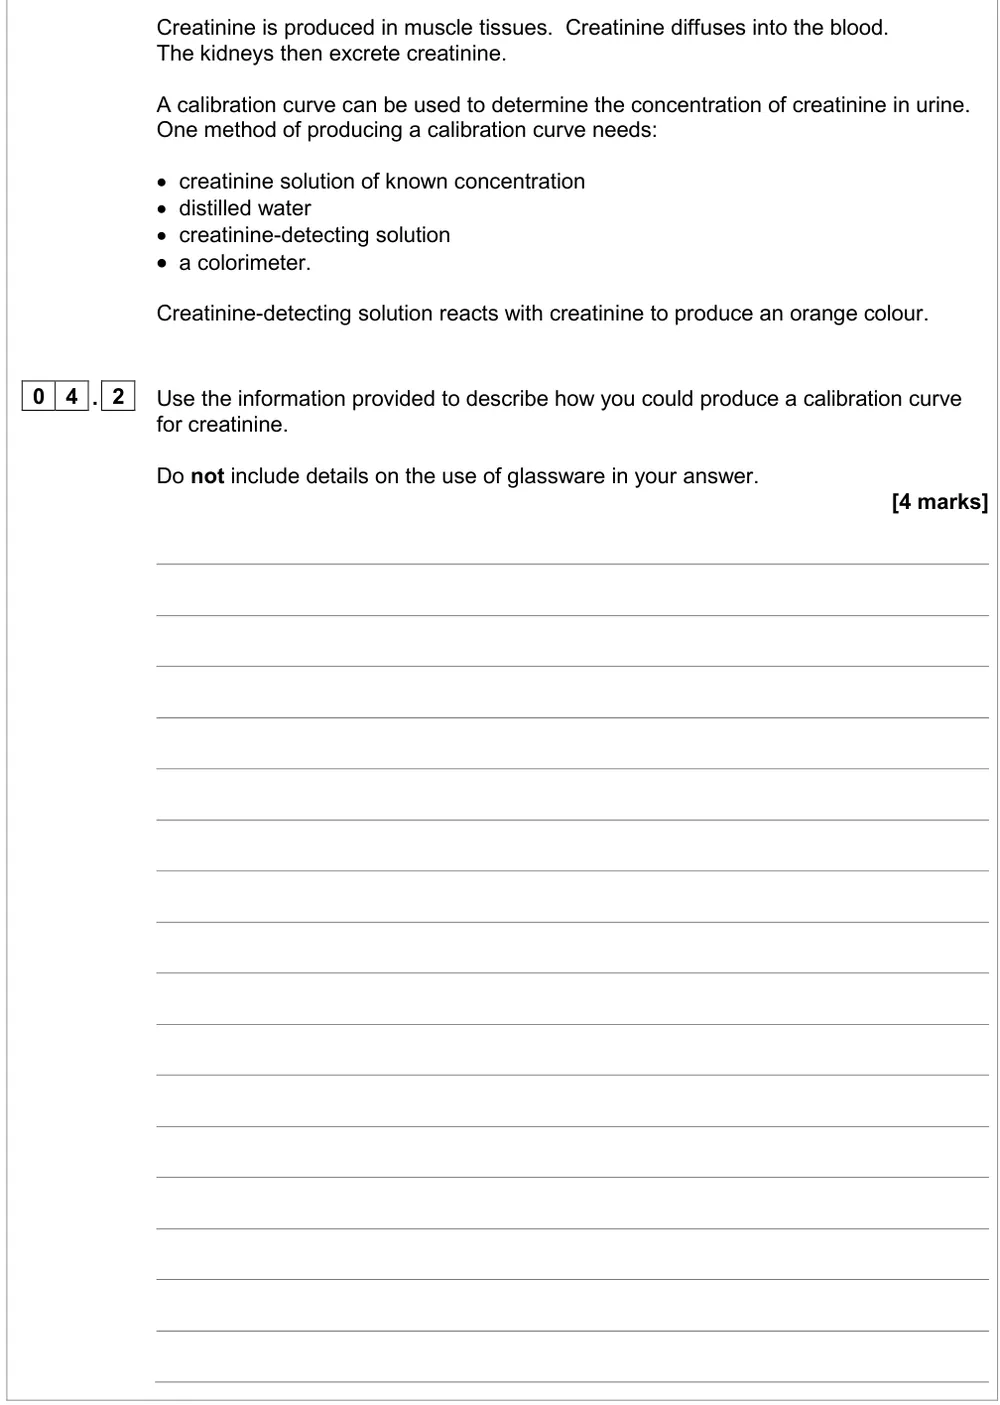
Describe how to produce a calibration curve for creatinine using a colorimeter.
Show the mark scheme
Tap an image to open it full size.
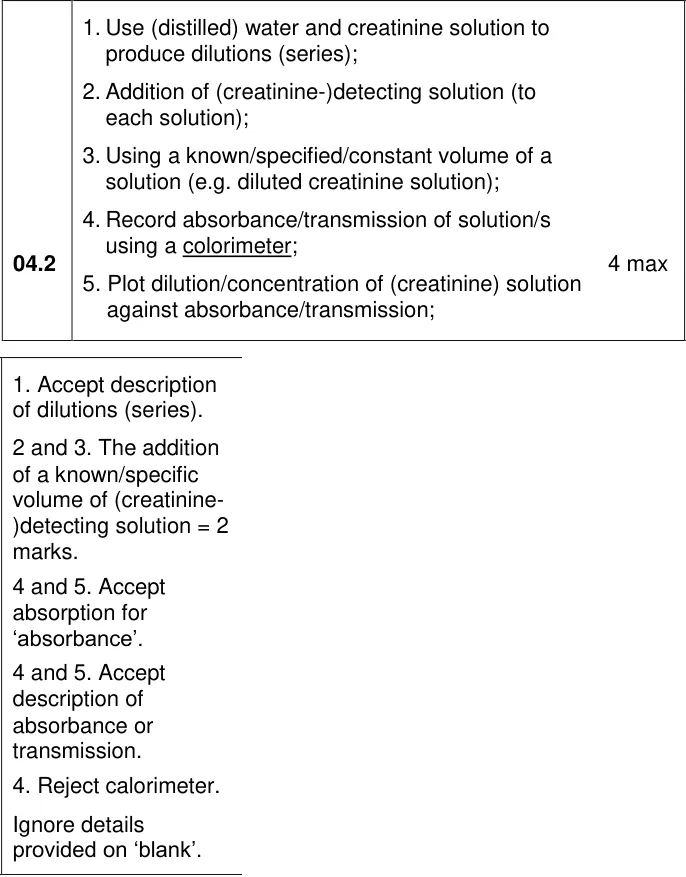
From the examiners' report: 31% got full marks. Write volume, not 'amount', include the distilled water and the detecting solution, and say you record absorbance with a colorimeter (not a calorimeter).
Question 9
A level Paper 2 · November 2020 · Q04.3 · 2 marks
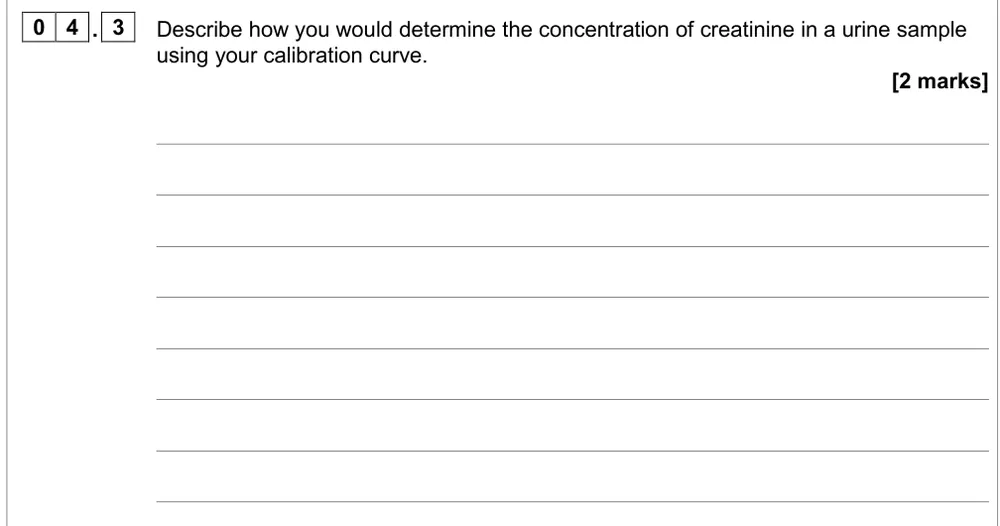
Describe how to use the calibration curve to find the creatinine concentration in urine.
Show the mark scheme
Tap an image to open it full size.
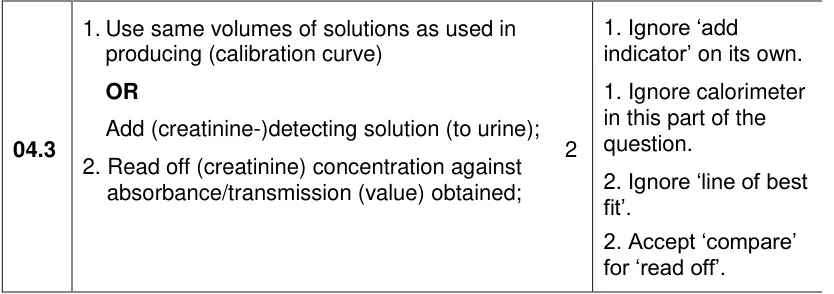
From the examiners' report: About one in four got both. Treat the urine exactly like the standards, then read across from its absorbance. Don't draw a tangent or work out a gradient.
Question 10
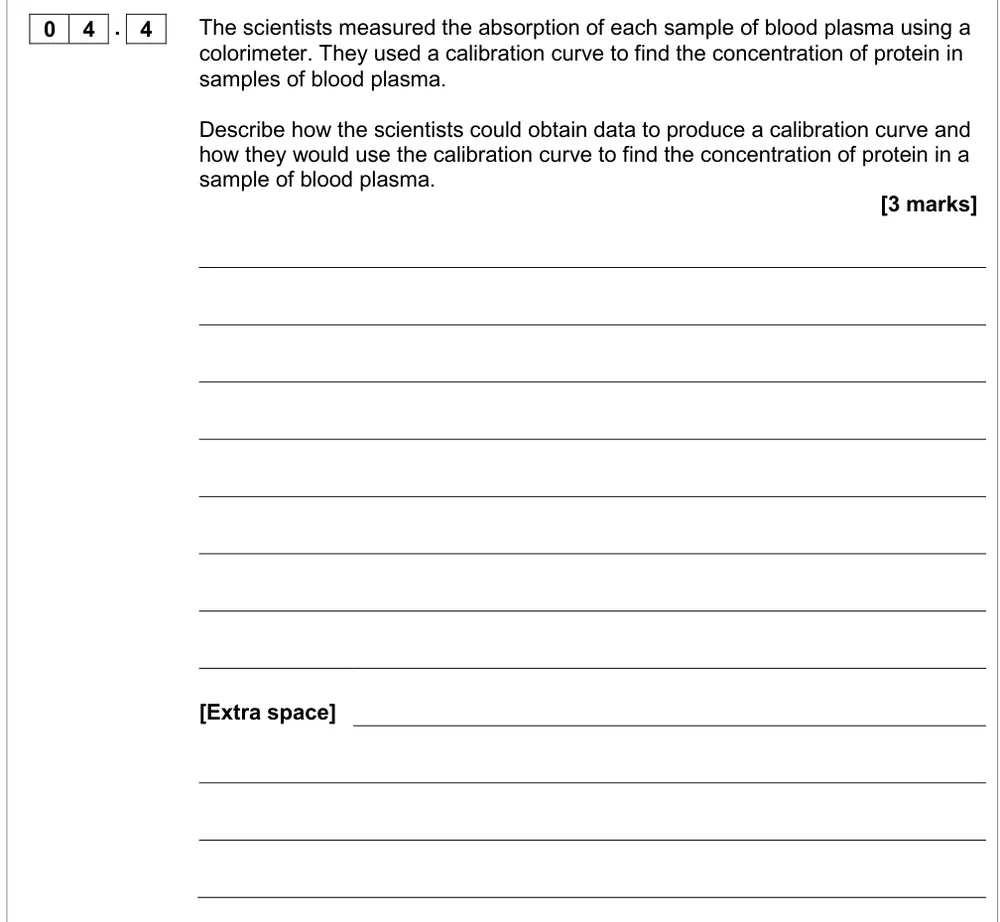
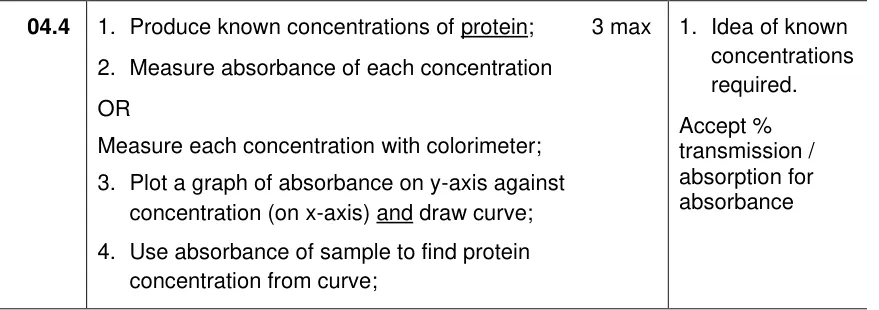
AS Paper 2 · June 2017 · Q04.4 · 3 marks
Describe how to get data for a protein calibration curve and how to use it for blood plasma.
Show the mark scheme
Tap an image to open it full size.
From the examiners' report: There's no examiners' comment on this part, so this tip comes from the mark scheme. Start with known concentrations, measure each with the colorimeter, plot the curve, then read the sample's concentration from its absorbance.
Question 11
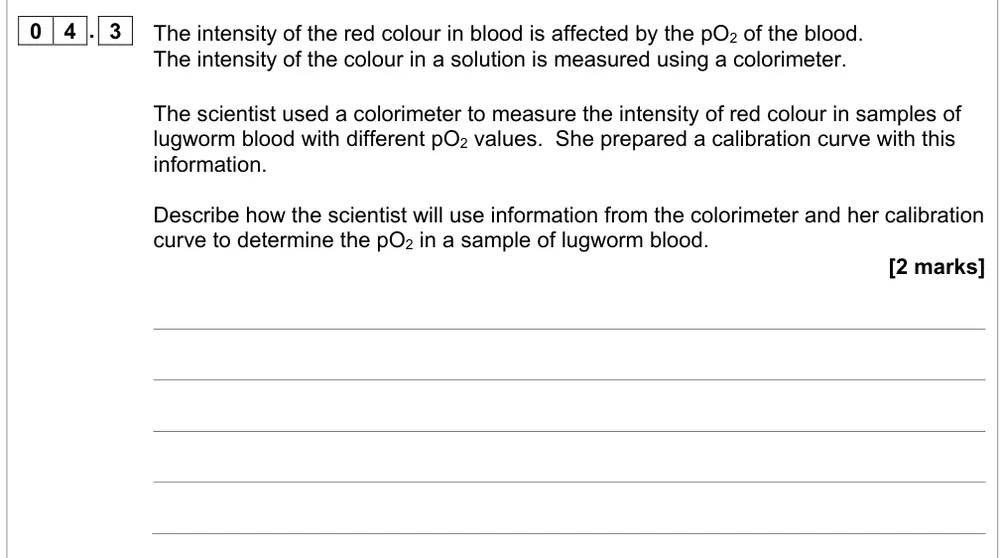
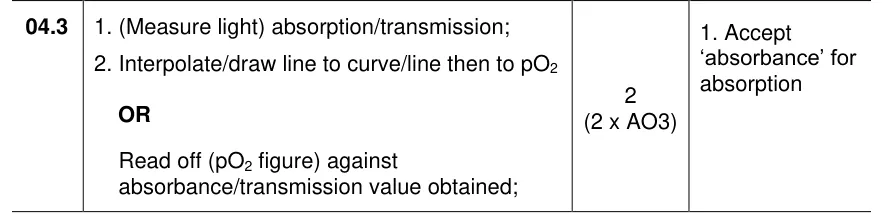
AS Paper 1 · June 2022 · Q04.3 · 2 marks · Hard
Describe how to use colorimeter readings and a calibration curve to find the pO2 of lugworm blood.
Show the mark scheme
Tap an image to open it full size.
From the examiners' report: Only 19% scored. The question is about using the curve, so don't describe making it: measure the sample's absorbance, go across to the curve and down to the pO2.
Question 12
AS Paper 1 · June 2025 · Q08.4 · 3 marks · Hard
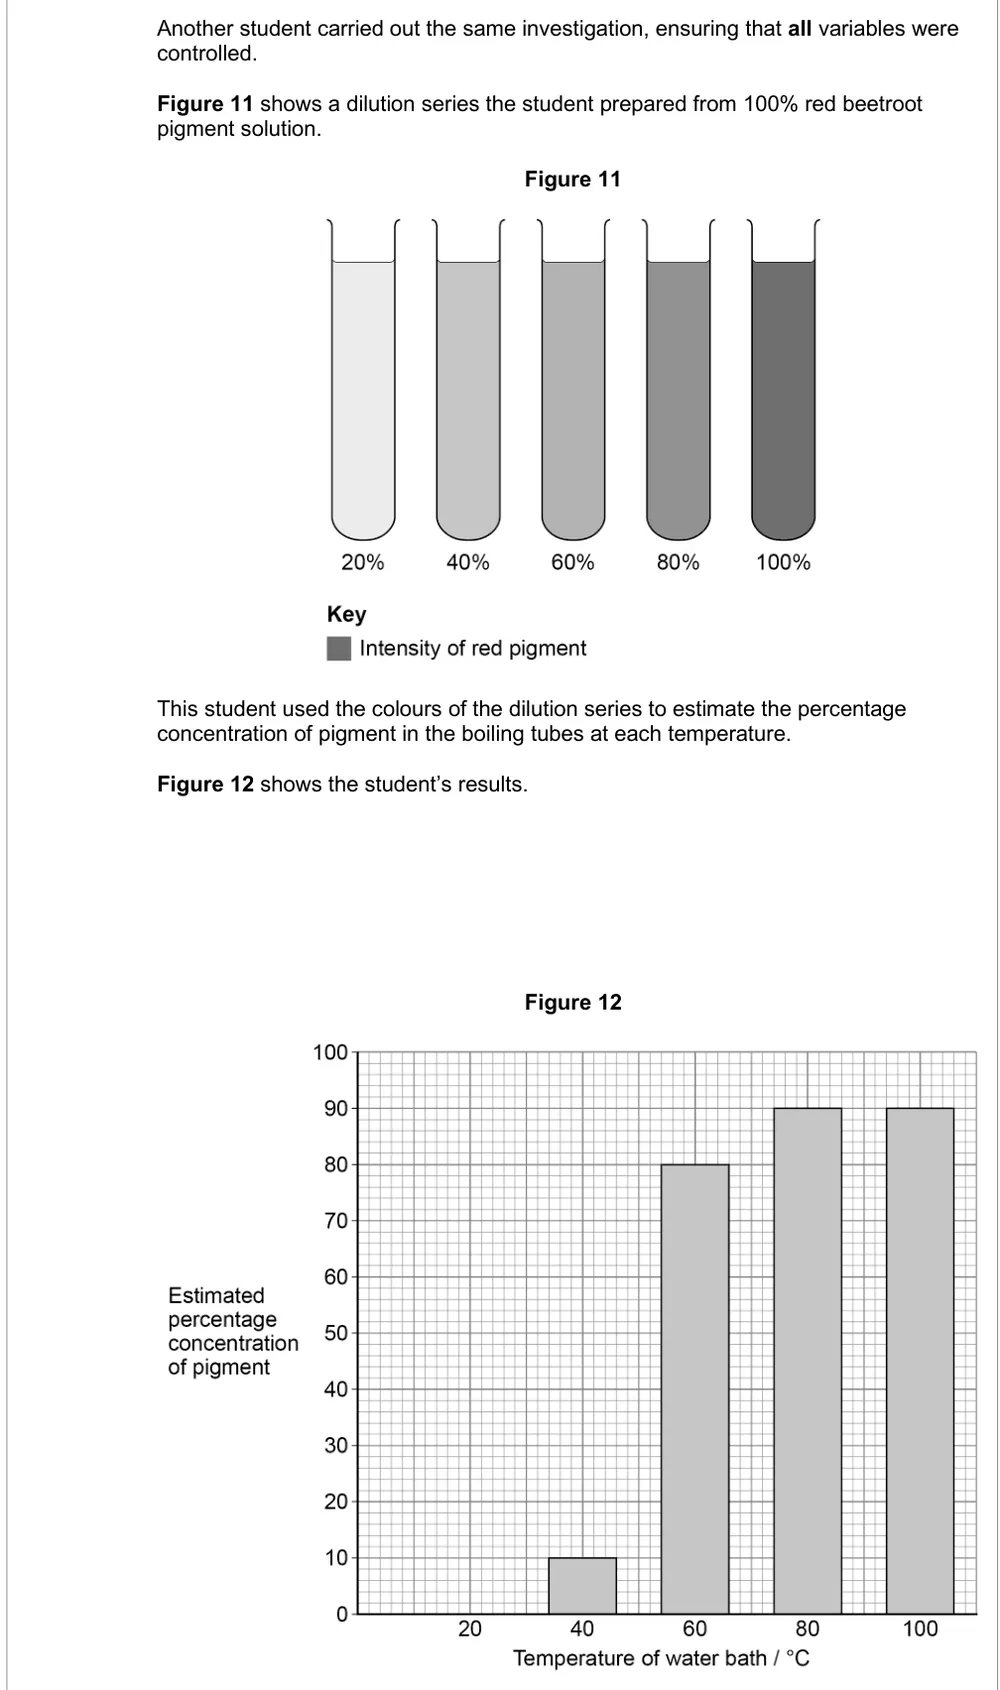
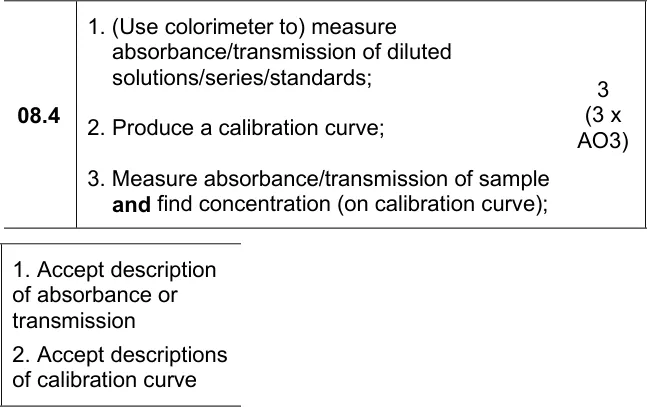
Describe how to use the beetroot pigment dilution series and a colorimeter to measure pigment concentration accurately.
Information from earlier in this question:
Show the mark scheme
Tap an image to open it full size.
From the examiners' report: Only about 10% got all three. Don't explain how to make the dilutions or what temperature does to membranes: measure the standards, plot the curve, then read off each sample.
Question 13
A level Paper 1 · November 2020 · Q04.4 · 3 marks · Hard
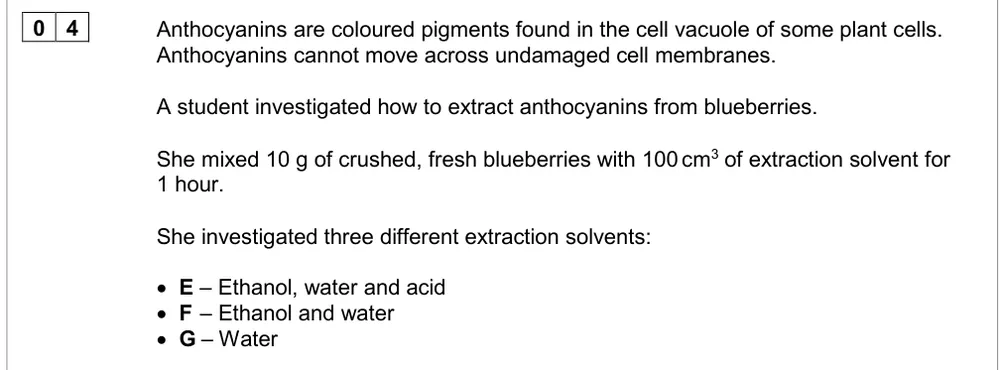
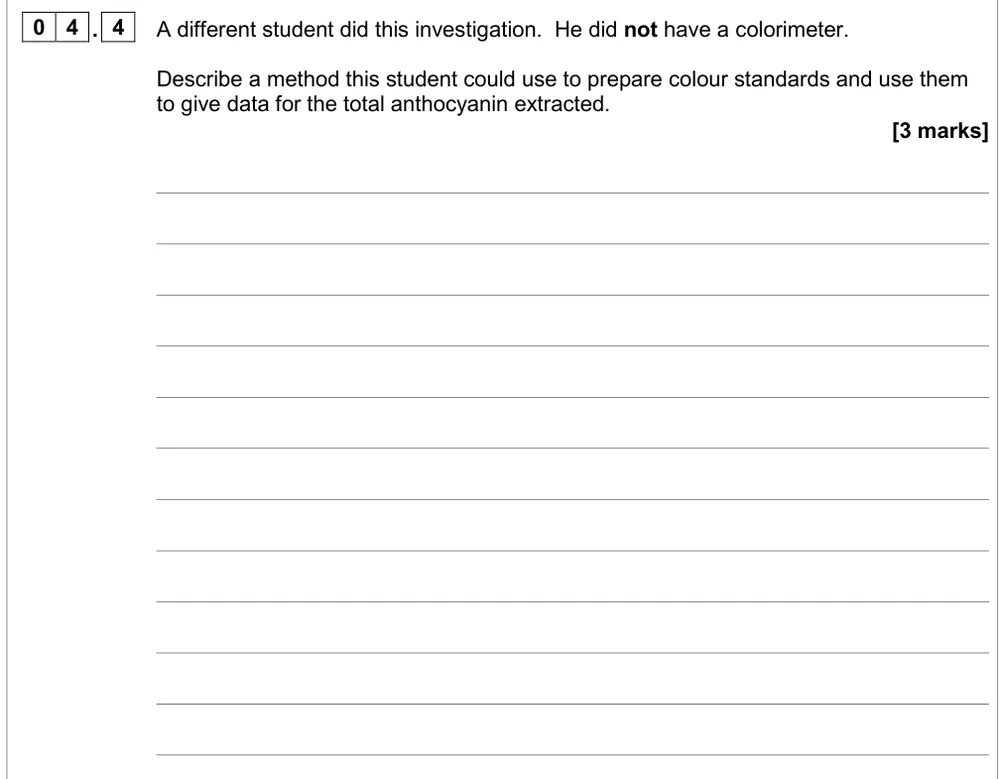
Describe how to prepare colour standards to measure anthocyanin when no colorimeter is available.
Information from earlier in this question:
Show the mark scheme
Tap an image to open it full size.
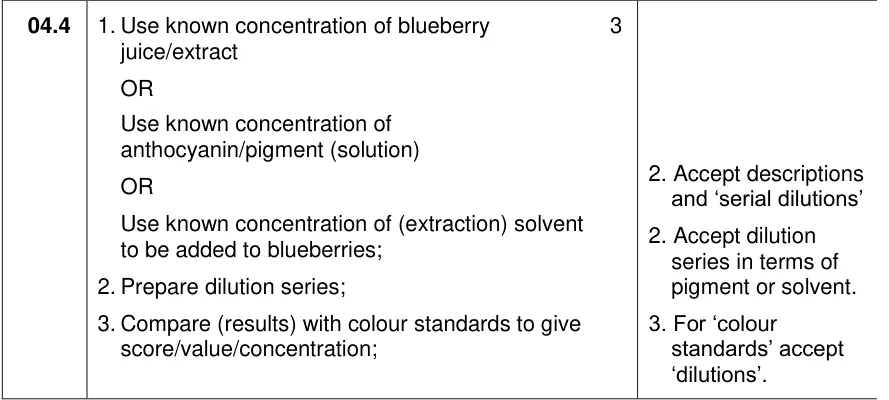
From the examiners' report: This was found hard, and 11% didn't try it. Without a colorimeter you make standards of known concentration by dilution and match the samples by eye; values 'from a book' or a calibration curve weren't credited.
Where students lose marks (from AQA examiners' reports and mark schemes)
Each point below is followed by wording that gained marks.
Dilution series, not just 'dilution': Only 28% named the method used to make the sucrose solutions. Most wrote just 'dilution', and some suggested Benedict's test, colorimetry or heating gently.
✔ Gains credit: "Dilution series" (serial dilution also accepted).
Stock plus water makes the total: Only a quarter got both marks for a simple dilution: the headings needed units, and the two volumes had to make 30 cm³ of the 75 g kg⁻¹ solution.
✔ Gains credit: Headings with cm³; 22.5 cm³ of 100 g kg⁻¹ copper sulfate solution and 7.5 cm³ of water.
Work out the ratios before you plot: 81% scored at least one mark but only 22% got all three. Many couldn't calculate the ratios even though the question told them how, and drew axes with no points plotted.
✔ Gains credit: "Axes correct way round with linear scales; axes labelled with mol dm⁻³ and ratio without units; correct values correctly plotted and suitable curve drawn."
No change in mass marks the water potential: There's no examiners' report for this paper. The mark scheme ignores an unqualified 'plot a graph': you have to say what goes on the axes, where to read it and how to turn the concentration into a water potential.
✔ Gains credit: "Plot calibration curve (ratio against concentration of sugar); interpolate from ratio of 1; change concentration into water potential."
Blot the tissue dry before reweighing: A third got full marks for the mangrove root experiment, but many lost marks by leaving out a way to dry the tissue. Some said sea water moves by osmosis, and a potometer scored nothing.
✔ Gains credit: "Record mass before and after; place in sea water for equal time; method to remove surface water (eg blot dry); increase in mass shows cells have lower water potential."
Volume, not 'amount': 31% got full marks for the creatinine calibration curve. Answers that wrote 'amount' instead of volume missed a mark, some left out distilled water or the detecting solution, and 'calorimeter' was rejected.
✔ Gains credit: "Use distilled water and creatinine solution to produce a dilution series; add a known volume of creatinine-detecting solution; record absorbance using a colorimeter; plot concentration against absorbance."
Using a curve isn't making one: Only 19% scored on the lugworm blood question, because most described how to make a calibration curve. On the beetroot question only about 10% got all three. A tangent or gradient on a calibration curve is wrong: you read across from the reading.
✔ Gains credit: "Measure absorbance/transmission (of the sample); read off the value against the absorbance obtained (draw a line to the curve, then down to the axis)."
No colorimeter? Make colour standards: 11% didn't attempt this. Some said to get colorimeter values 'from a book' or to draw a calibration curve, which needs a measuring instrument the student didn't have.
✔ Gains credit: "Use known concentrations of anthocyanin; prepare a dilution series; compare results with the colour standards to give a value."
Download the questions
Download the PDF pack (13 questions, mark schemes at the end)
Keep practising
- Graph skills: AQA A Level Biology exam questions by topic
- Arithmetic and numerical skills: AQA A Level Biology exam questions by topic
- Required practical 1, enzyme rates: AQA A Level Biology exam questions
- Required practical 2, mitosis: AQA A Level Biology exam questions
- Calculations and mathematical content in A level Biology, from AQA papers
- AQA A Level Biology masterclasses
Questions, mark schemes and examiners' report extracts © AQA.