

In short: A spirometer trace shows the volume of air in the spirometer, not in the lungs, so the line falls when the person breathes in and rises when they breathe out. Tidal volume is the height of one normal breath, and vital capacity is the gap between the lowest trough (maximum breath in) and the highest peak (maximum breath out). Breathing rate comes from counting breaths per minute. Ventilation rate = tidal volume × breathing rate, and the steady downward slope of the trace gives the rate of oxygen uptake.
Studying A-level Biology? I'm Tom, an A-level Biology teacher with 30 years' experience. I offer one-to-one lessons and weekly group classes for AQA, OCR A and CIE, with every lesson recorded.
Spirometer questions are mostly about reading the graph accurately and handling units. The biology is short, but the marks are easy to lose. This guide is built around one annotated trace with simple numbers, and works through every calculation step by step. It then gives seven real OCR exam questions with the mark-scheme wording and what the examiners said. It matches OCR A 3.1.1(e).
Spirometry is mainly an OCR topic. AQA students can still meet spirometer data in unfamiliar contexts: AQA 7402/3 in June 2025 asked for a lung-volume calculation from spirometer readings.
What a spirometer measures and how it works
A spirometer measures the volumes of air a person breathes in and out. From the trace you can find tidal volume, vital capacity, the reserve volumes, breathing rate and the rate of oxygen uptake.
A chamber (sometimes called the lid or bell) floats on water. It is filled with medical-grade oxygen or with air.
The person breathes in and out through a mouthpiece connected to the chamber by tubes. A nose clip makes sure all the air goes through the mouthpiece.
Breathing in takes gas out of the chamber, so the chamber sinks. Breathing out returns gas, so the chamber rises.
The chamber's movement is recorded as a trace, by a pen on a rotating drum (a kymograph) or by a data logger.
A canister of soda lime in the circuit absorbs the carbon dioxide in exhaled air. This is why the trace slopes downwards over time.
This is the most common source of confusion. The trace shows the volume of air in the spirometer, which is the inverse of the volume of air in the lungs. When the trace rises, lung volume is falling and the person is breathing out. When the trace falls, the person is breathing in.
Some textbook diagrams plot lung volume instead, which turns the picture upside down. Always check the y-axis label before you decide which way is in and which is out.
Reading the trace: tidal volume, vital capacity and residual volume
The trace below is an illustrative example with simple numbers. The person breathes normally for 40 s, then breathes in as deeply as possible and breathes out as fully as possible.
The trace shows the volume of air in the spirometer, not in the lungs. Read every volume as a difference between two levels.
Tidal volume is the volume of air moved in or out of the lungs in one normal breath. Here it is 0.5 dm³ (500 cm³), a typical value at rest.
Inspiratory reserve volume is the maximum extra volume that can be breathed in after a normal inhalation. Here it is 2.3 dm³.
Expiratory reserve volume is the maximum extra volume that can be forced out after a normal exhalation. Here it is 1.2 dm³.
Vital capacity is the maximum volume of air that can be breathed out after a maximum inhalation. It equals inspiratory reserve volume + tidal volume + expiratory reserve volume. Here it is 4.0 dm³.
Residual volume is the air that always stays in the lungs, even after the hardest possible breath out. A spirometer cannot measure it, because this air never enters the spirometer.
Total lung capacity is vital capacity + residual volume. Here that would be about 5.5 dm³.
Read every volume as a difference between two levels, not as a single reading off the axis. For vital capacity, subtract the lowest trough (the maximum breath in) from the highest peak (the maximum breath out). Use a ruler and draw faint horizontal lines across to the axis before you read a value.
Remember the units. 1 dm³ = 1000 cm³ = 1 litre. Exam questions often give data in one unit and ask for the answer in the other.
Calculating breathing rate, ventilation rate and oxygen uptake
All the numbers below come from the trace above. Show every step in the exam: method marks are available even if the final answer is wrong.
Count the troughs in the normal breathing (each one is a breath in): 8 breaths in 40 s.
Breaths per second = 8 ÷ 40 = 0.2
Breaths per minute = 0.2 × 60 = 12 breaths min⁻¹
Breath 1 falls from 5.00 dm³ to 4.50 dm³.
Tidal volume = 5.00 − 4.50 = 0.5 dm³ (500 cm³)
Ventilation rate = tidal volume × breathing rate
= 0.5 dm³ × 12 min⁻¹ = 6.0 dm³ min⁻¹ (6000 cm³ min⁻¹)
Peak at 0 s = 5.00 dm³; peak at 40 s = 4.80 dm³.
Fall in volume = 5.00 − 4.80 = 0.20 dm³ in 40 s
Rate = 0.20 ÷ 40 = 0.005 dm³ s⁻¹
Per minute = 0.005 × 60 = 0.30 dm³ min⁻¹ (300 cm³ min⁻¹)
Lowest trough (maximum breath in) = 2.0 dm³; highest peak (maximum breath out) = 6.0 dm³.
Vital capacity = 6.0 − 2.0 = 4.0 dm³
Check: IRV + TV + ERV = 2.3 + 0.5 + 1.2 = 4.0 dm³
The three formulas are linked. If you know any two of tidal volume, breathing rate and ventilation rate, you can find the third:
ventilation rate = tidal volume × breathing rate
breathing rate = ventilation rate ÷ tidal volume
tidal volume = ventilation rate ÷ breathing rate
Make sure both volumes are in the same unit before you divide. For example, 6.0 dm³ min⁻¹ ÷ 500 cm³ only works once you convert to 6000 cm³ min⁻¹ ÷ 500 cm³ = 12 breaths min⁻¹.
For oxygen uptake, use the troughs (or the peaks) of the normal breaths, and pick two points far apart in time. This reduces the effect of small reading errors. If a question asks for oxygen uptake per kilogram of body mass, divide by the mass at the end.
During exercise, both tidal volume and breathing rate increase, so ventilation rate rises. The trace also slopes down more steeply, because oxygen is used faster.
Why the trace slopes downwards
With each breath, the person takes oxygen from the chamber into the lungs. Some of that oxygen diffuses into the blood and is used in respiration. The air breathed back out contains less oxygen and more carbon dioxide.
The soda lime absorbs the carbon dioxide from the exhaled air. So the volume of oxygen removed is not replaced by an equal volume of carbon dioxide. The total volume of gas in the chamber falls with each breath, and the trace slopes downwards.
The fall in volume over time equals the volume of oxygen used. That is why the gradient of the slope gives the rate of oxygen uptake. Without soda lime, carbon dioxide would build up in the chamber. The slope would no longer measure oxygen uptake, and the person would start to breathe faster.
Safety precautions
The subject should be healthy. Do not use someone with asthma or another breathing or heart condition.
Fill the chamber with medical-grade oxygen, not ordinary air, for any recording that lasts more than a short time. This keeps the oxygen supply high.
Check the soda lime is fresh, so that carbon dioxide does not build up. Soda lime is corrosive, so handle it with care.
Disinfect or sterilise the mouthpiece before each person uses it.
Check the chamber is not overfilled and that the tubes are not blocked.
Do not run the recording for too long, and stop at once if the subject feels dizzy or uncomfortable.
Seven real exam questions with the mark-scheme wording
These are from OCR A Level Biology A (H420) and OCR AS Biology A (H020) papers. Try each one before reading the answer.
Question 1 (H420/01, June 2024, 1 mark)
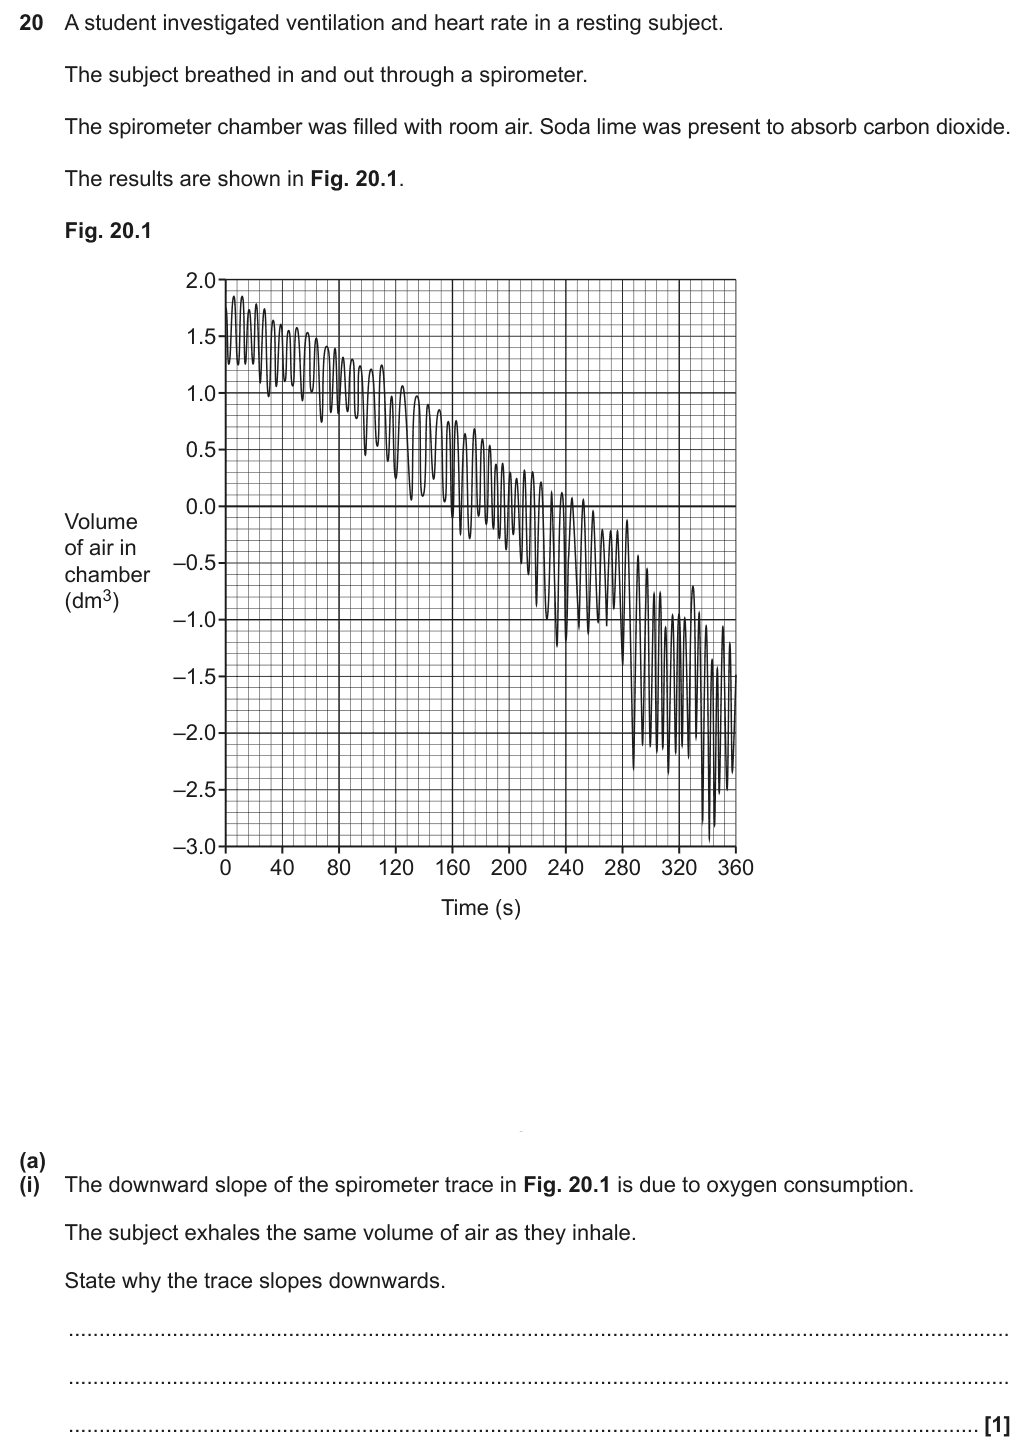
Mark scheme: (inhaled) oxygen is being used or removed. Also allowed: (exhaled) carbon dioxide is absorbed or removed, or there is less oxygen in exhaled air.
Examiners said: this was generally well answered. Candidates said that soda lime absorbs the carbon dioxide produced and that oxygen was being used.
Question 2 (H020/02, June 2016, 2 marks)
Volume C on Fig. 1.2 is the vital capacity.
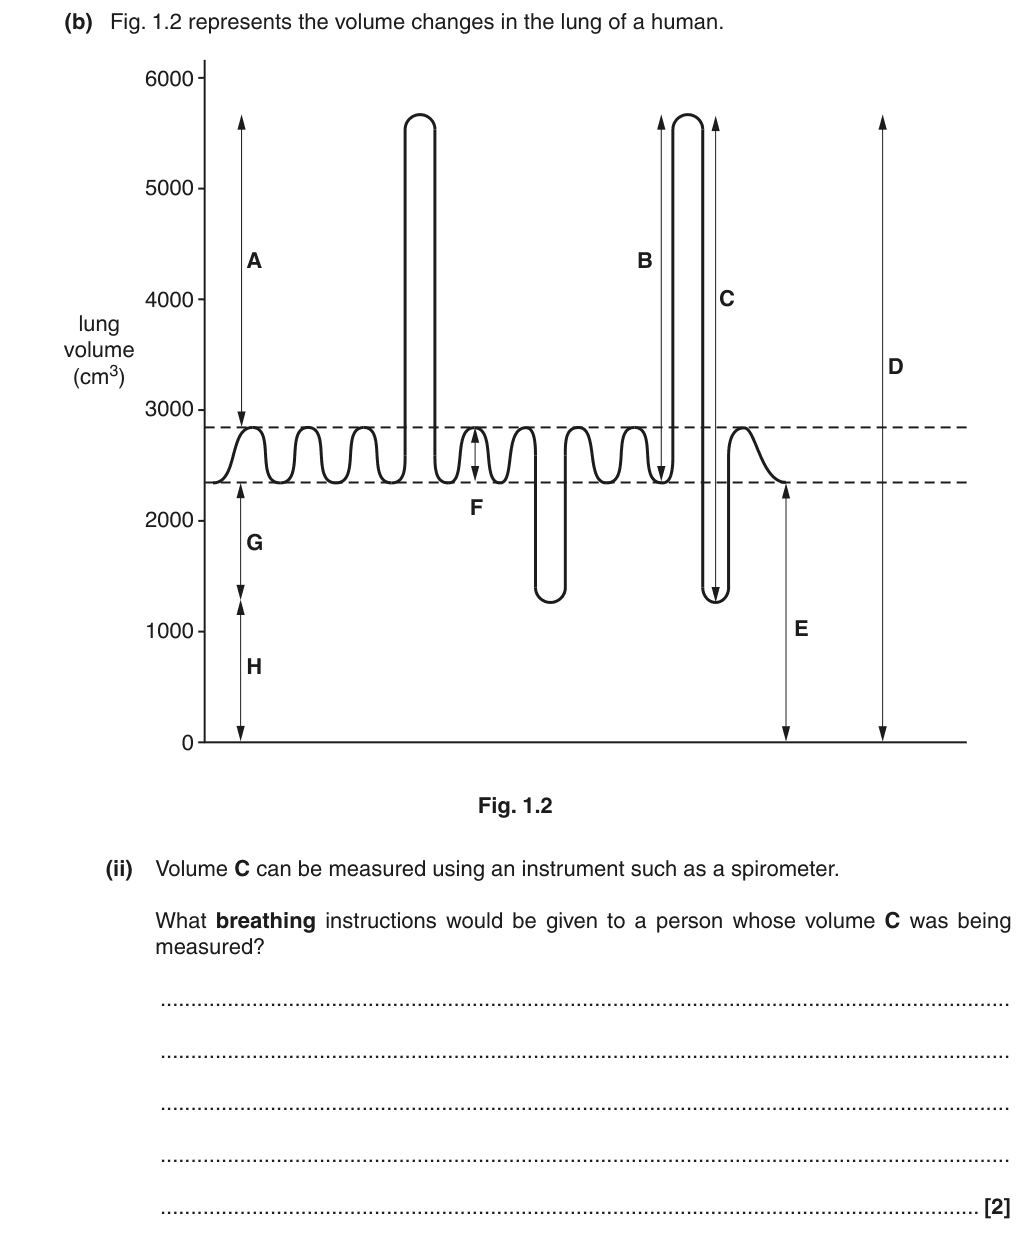
Mark scheme: breathe in as deeply as possible; (and) then force as much air out as possible. If the deepest breath out comes before the deepest breath in, the maximum is 1 mark. Answers saying "all of the air is pushed out of the lungs" are not credited. References to a nose clip are ignored.
Question 3 (H420/03, November 2021, 1 mark)
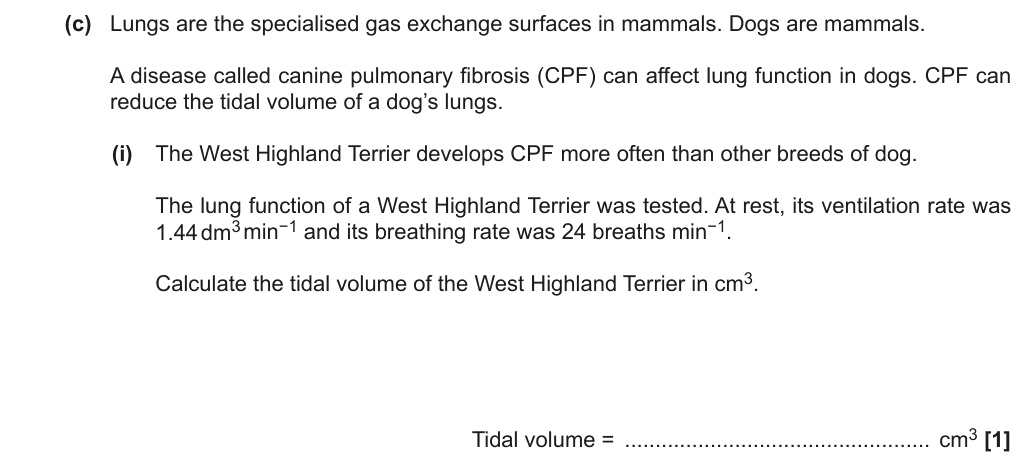
Mark scheme: 60 (cm³). 1.44 dm³ = 1440 cm³, and 1440 ÷ 24 = 60.
Examiners said: most unsuccessful answers did not understand the relationship between tidal volume, breathing rate and ventilation rate. There was also some confusion when converting dm³ to cm³.
Question 4 (H020/02, June 2025, 1 mark)
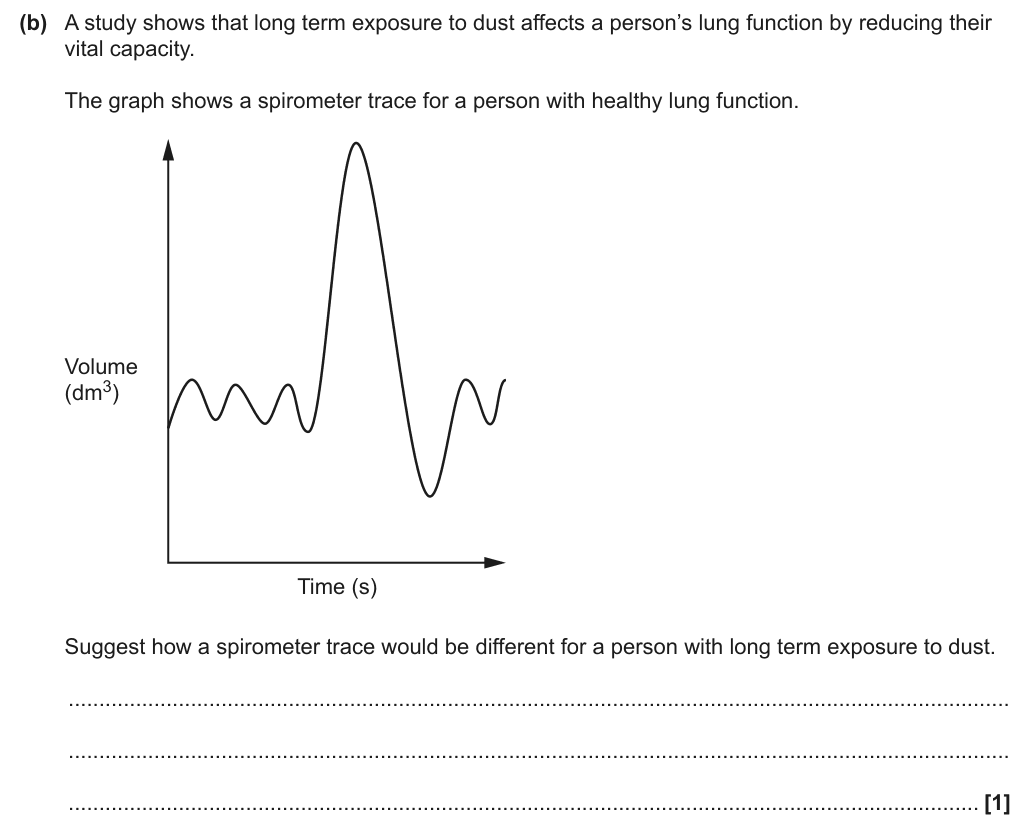
Mark scheme: the large peak will be lower AND the trough will be smaller. References to vital capacity being lower are ignored, because the question asks how the trace will differ.
Examiners said: the most common answer described the effect on tidal volume and vital capacity, which did not answer the question. Candidates needed to describe how the line itself would change, and make clear which peak and trough they meant.
Question 5 (H020/02, June 2025, 3 marks)
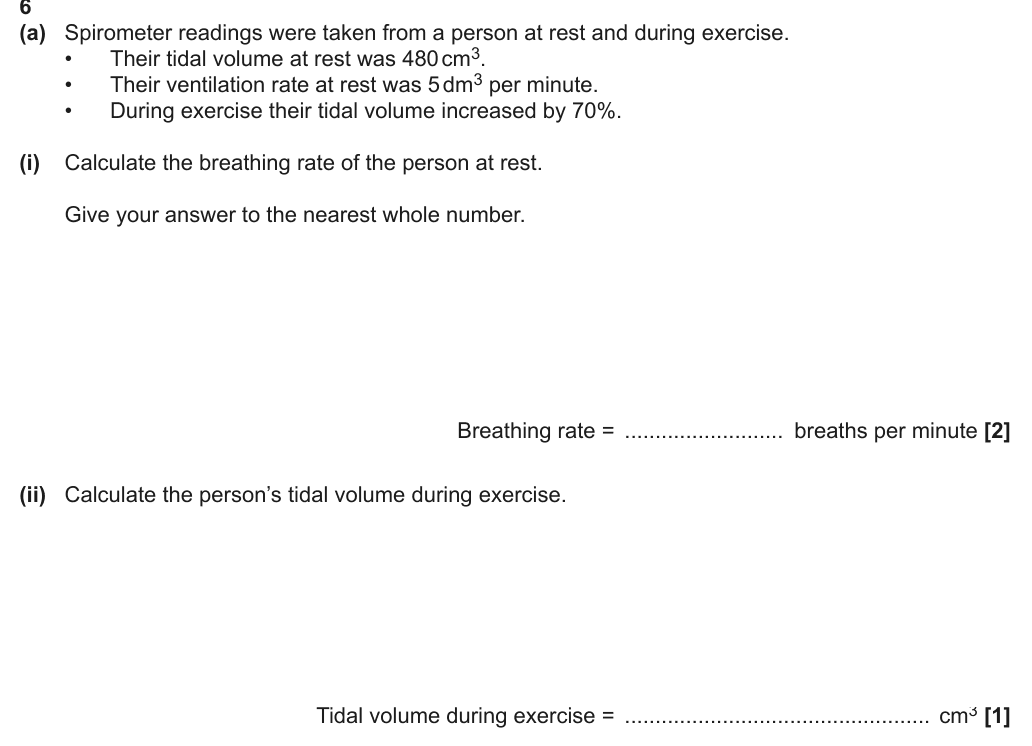
Mark scheme: (i) 10 breaths per minute. Ventilation rate = 5 dm³ = 5000 cm³ per minute; 5000 ÷ 480 = 10.4167; one mark for 5000 ÷ 480 and one for rounding to 10. (ii) 816 cm³. Increase = 480 × 70 ÷ 100 = 336 cm³, so the new tidal volume = 480 + 336 = 816 cm³.
Examiners said: part (i) discriminated well. The most common wrong answer was 96, from 480 ÷ 5. Some candidates set up the calculation correctly but did not round to the nearest whole number. Part (ii) was answered correctly by most candidates.
Question 6 (H420/01, June 2024, 2 marks)
This part uses Fig. 20.1, the spirometer trace shown in Question 1 above.
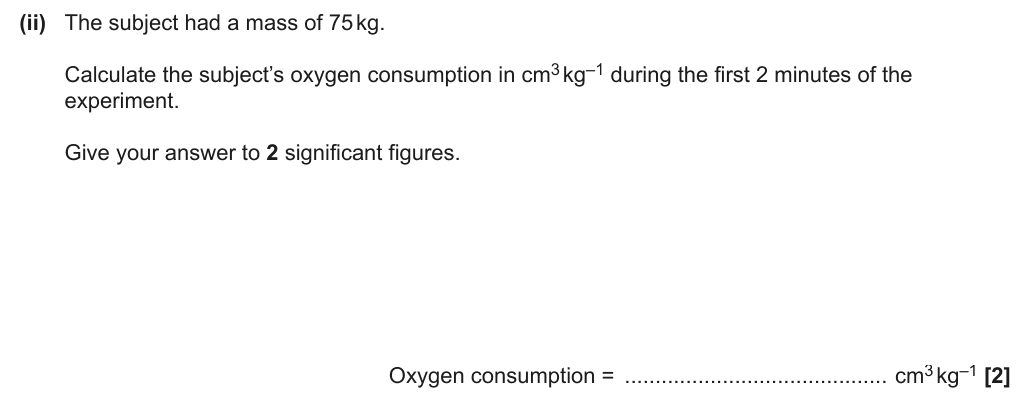
Mark scheme: oxygen consumption in 120 s = 1.0 dm³ = 1000 cm³; 1000 ÷ 75 = 13 (cm³ kg⁻¹). Answers of 12 to 15 were accepted, because readings from 0.9 to 1.1 dm³ were allowed. An answer not to 2 significant figures gets a maximum of 1 mark. One mark is allowed for not converting to cm³, e.g. 0.013 dm³ kg⁻¹.
Examiners said: there were three stages: read the oxygen consumption from the graph, convert to cm³, then divide by 75 kg. Many read the graph wrongly. Some graphs had no annotation, suggesting a rough estimate made without a ruler. Most gave 2 significant figures as asked.
Question 7 (H420/01, June 2024, 2 marks)
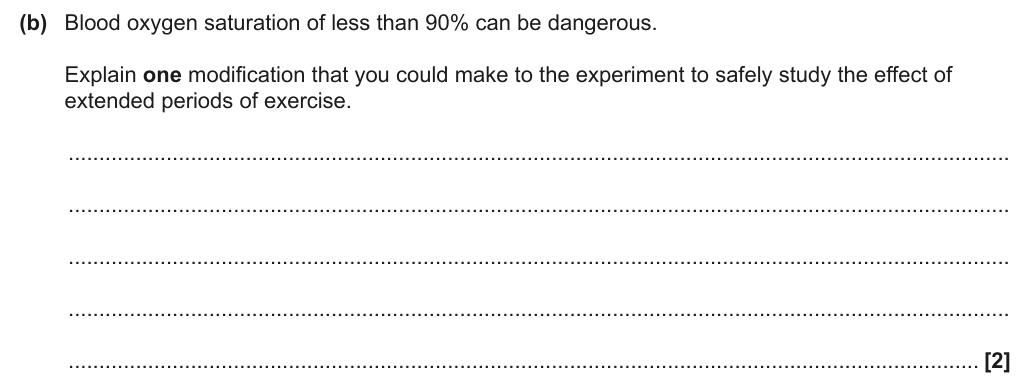
Mark scheme: enrich the air in the spirometer with oxygen; so that a high blood oxygen saturation is maintained (allow: so it does not drop too low, or stays above 90%). "A bigger spirometer" and "take resting intervals" are ignored.
Examiners said: good answers saw that a richer oxygen supply was needed to keep oxygen saturation high. Some candidates seemed unfamiliar with the safe set-up and use of the spirometer, possibly from a lack of practical work with it.
For more practice, work through my spirometer and lung volume question pack.
Common mistakes (from the examiners’ reports and mark schemes)
Dividing the wrong way round, e.g. 480 ÷ 5 = 96. Gains credit: "breathing rate = ventilation rate ÷ tidal volume = 5000 ÷ 480 = 10 breaths per minute".
Mixing dm³ and cm³ in the same calculation. Gains credit: "1.44 dm³ = 1440 cm³; 1440 ÷ 24 = 60 cm³". Convert before you divide.
Ignoring the rounding or significant figures asked for. Gains credit: "10 breaths per minute" (nearest whole number) or "13 cm³ kg⁻¹" (2 significant figures). An answer in the wrong form loses a mark.
Reading the trace as lung volume, or taking vital capacity from one level. Gains credit: on a spirometer trace the highest peak is the maximum breath OUT and the lowest trough is the maximum breath IN, so "vital capacity = maximum expiration − maximum inhalation, e.g. 4.7 − 0.2 = 4.5 dm³" (OCR mark scheme, H420/01 November 2020). OCR examiners (H020/01, June 2024) said many chose the maximum inhalation value instead.
Writing "vital capacity would be lower" when asked how the trace would change. Gains credit: "the large peak would be lower and the trough would be smaller". Describe the line itself and say which peak and trough you mean.
Estimating values from the trace without a ruler. Gains credit: draw lines on the graph and read the volume fall over the stated time, e.g. "1.0 dm³ in 120 s". OCR examiners noted many unannotated graphs.
Telling the subject to push "all the air out of the lungs". Gains credit: "breathe in as deeply as possible, then force as much air out as possible". The residual volume always stays in the lungs.
Suggesting a bigger spirometer or rest breaks to make long recordings safe. Gains credit: "enrich the air in the spirometer with oxygen, so blood oxygen saturation stays above 90%".
Evaluating a claim about oxygen uptake without using the trace. Gains credit: calculate the rate of oxygen uptake from the slope, compare it with the figure given, and comment on validity, e.g. "only one woman was tested" (H420/01, June 2018).
Want help with topics like this every week?
My weekly group classes for AQA and OCR A work through exam questions topic by topic, and every class is recorded. Or book a first one-to-one lesson. For more OCR practice sorted by topic, see my OCR A-level Biology exam questions by topic.