

OCR A PAG 5 · 16 questions · mark schemes and examiners’ tips included
PAG 5 covers the two pieces of kit that turn a practical into numbers: the colorimeter and the potometer. You will have used a colorimeter to measure how much red pigment leaks out of beetroot, or to find a glucose concentration, and a potometer to measure how fast a leafy shoot takes up water. You also need to make up a range of concentrations by serial dilution.
Exam questions on PAG 5 reward students who have actually done the practical, and the examiners say so in their reports. Marks go on small details: setting the colorimeter to zero with a blank, choosing the right colour filter, using the radius rather than the diameter, and stating the assumption a potometer relies on. Learn the method as a set of steps, and the reason for each one.
Work through the sixteen questions below in order. They start with the colorimeter, then the beetroot investigation, serial dilutions, and finish with the potometer. If you'd like to go through questions like these with me each week, my OCR A masterclasses run on Wednesdays at 5.15pm for Year 12 and on Tuesdays at 6.30pm or Thursdays at 5.15pm for Year 13.
What these questions cover (OCR PAG 5: colorimeter or potometer)
PAG 5 is one of the twelve practical activity groups in the OCR A Level Biology A specification (H420). The questions test these parts of the specification:
- 1.2.2(b) use of appropriate instrumentation to record quantitative measurements, such as a colorimeter or potometer
- 1.2.2(c) use of laboratory glassware apparatus for a variety of experimental techniques to include serial dilutions
- 2.1.2(r) quantitative methods to determine the concentration of a chemical substance in a solution (to include colorimetry)
- 2.1.5(c)(ii) practical investigations into factors affecting membrane structure and permeability
- 3.1.3(c)(ii) practical investigations to estimate transpiration rates (to include the use of a potometer)
How to use this page
Write your answer on paper before you open the mark scheme. Allow about 1.2 minutes per mark: the 16 questions are worth 38 marks, so about 46 minutes in total. Then mark your answer strictly against the mark scheme and read the examiners' tip underneath it. If you'd rather print the questions, download the PDF pack.
Using a colorimeter
Question 1
AS Paper 1 · June 2019 · Q22(b)(i) · 1 mark · Hard
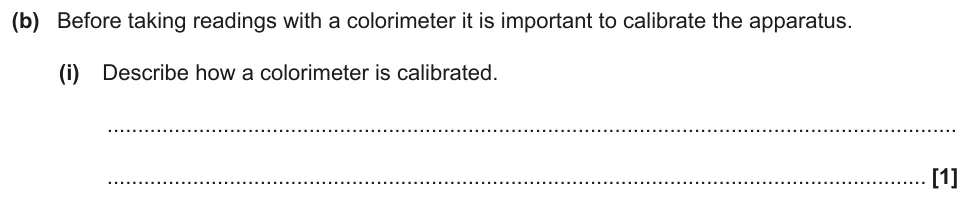
Describe how a colorimeter is calibrated.
Show the mark scheme

Tap an image to open it full size.
From the examiners' report: Only a few students mentioned a blank or distilled water; many suggested any clear liquid or a sample without pigment. Many who did use water didn't say the colorimeter is set to zero absorbance.
Question 2
AS Paper 1 · June 2019 · Q22(b)(ii) · 1 mark · Medium
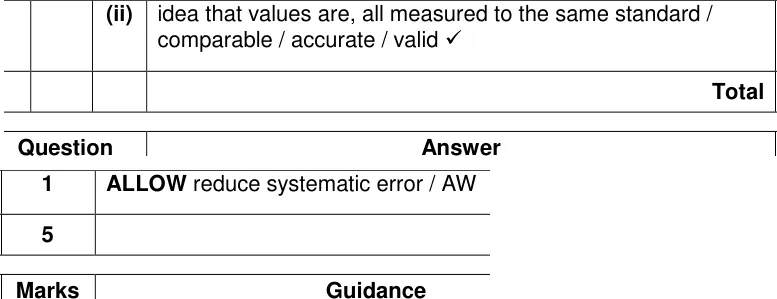
Explain why a colorimeter needs to be calibrated.

Show the mark scheme
Tap an image to open it full size.
From the examiners' report: Many students correctly said calibration makes the values accurate or valid. Some lost the mark by adding that it makes results more precise or reliable.
Question 3
AS Paper 1 · June 2025 · Q24(b)(ii) · 1 mark · Hard
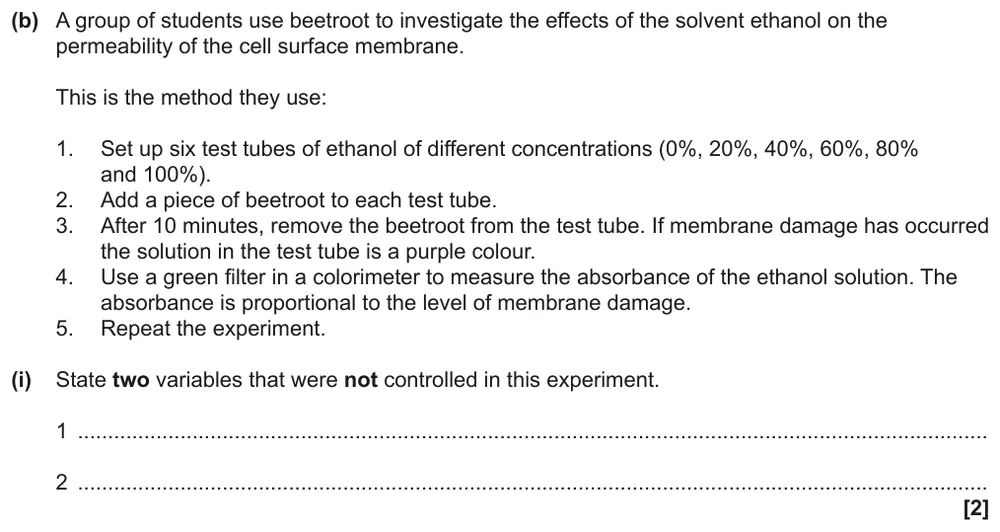
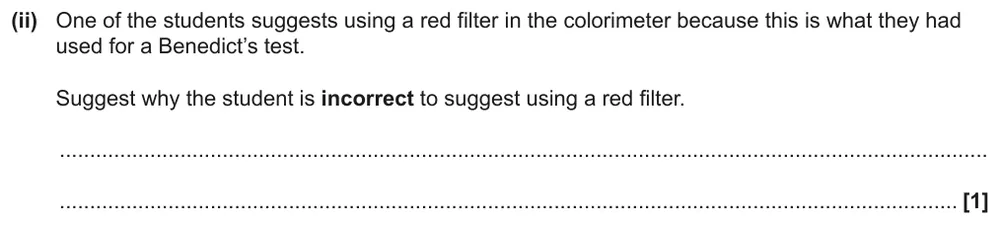
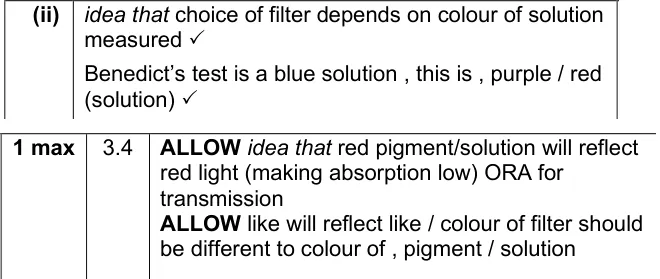
Explain why a red filter, used for a Benedict's test, is wrong for measuring red beetroot pigment.
Information from earlier in this question:
Show the mark scheme
Tap an image to open it full size.
From the examiners' report: Many answers were vague, saying red is similar to the pigment without explaining why it matters. The mark went for explaining that red light passes through a red solution, so absorbance readings would be low.
Question 4
A level Paper 2 · June 2022 · Q21(d)(i) · 4 marks · Medium
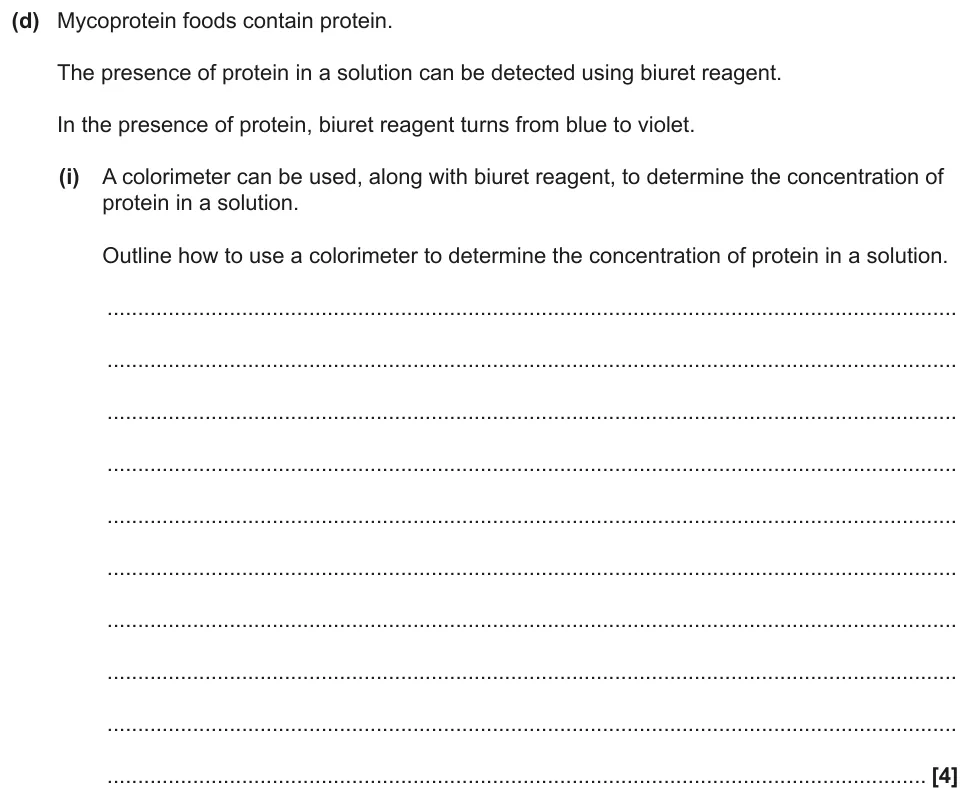
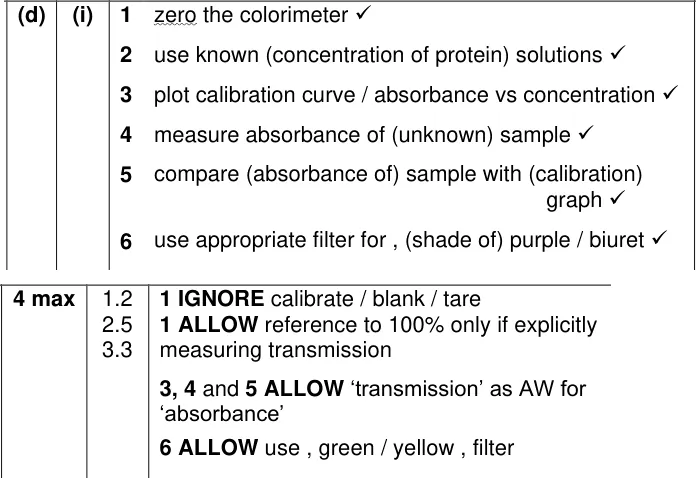
Outline how to use a colorimeter and biuret reagent to find a protein concentration.
Show the mark scheme
Tap an image to open it full size.
From the examiners' report: Many students got full marks. Where a filter was named it was usually red, which suits Benedict's but not violet biuret. 'Outline' doesn't need every step of making the dilutions.
Beetroot membrane investigations
Question 5
A level Paper 1 · June 2018 · Q20(a)(i) · 3 marks · Medium
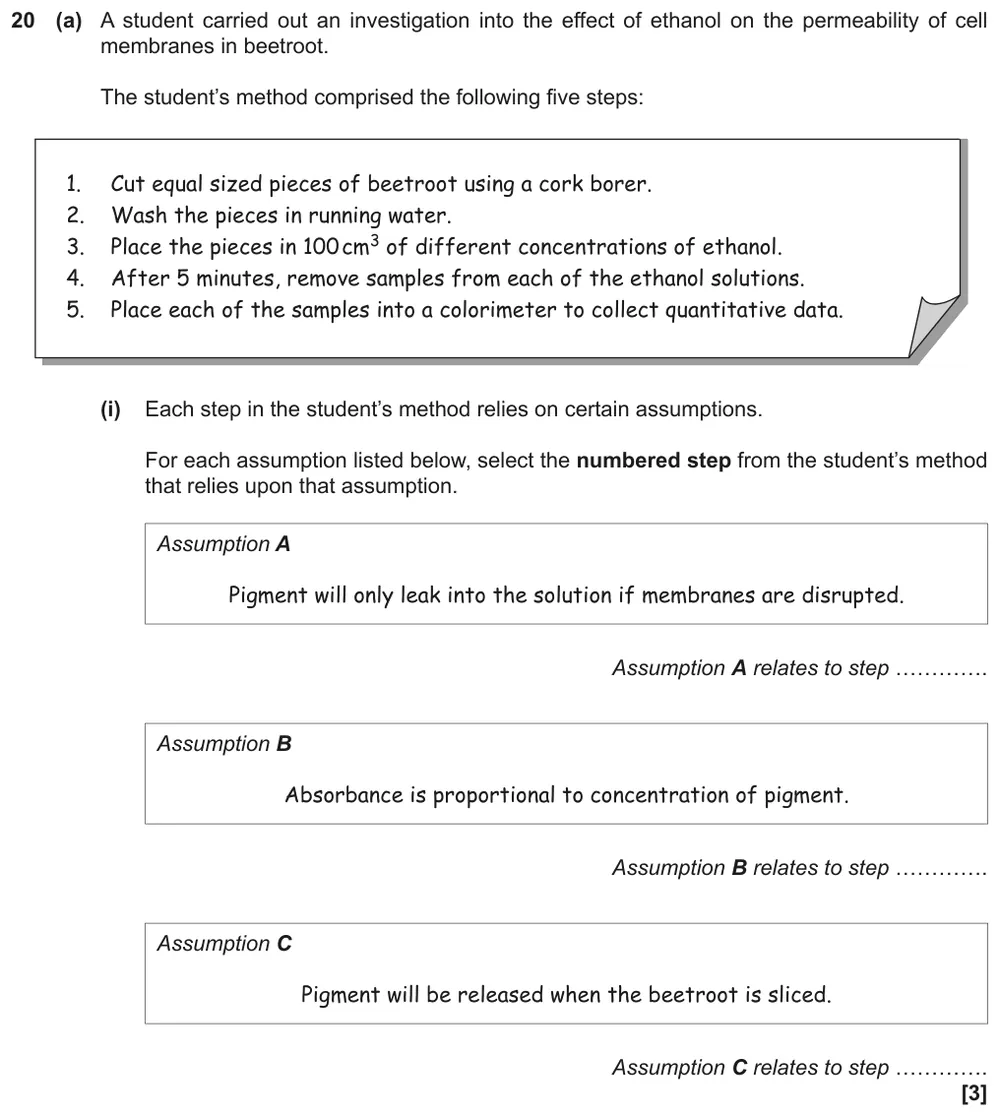
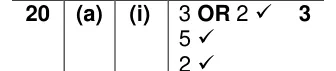
Match the assumptions behind a beetroot and ethanol method to the steps that rely on them.
Show the mark scheme
Tap an image to open it full size.
From the examiners' report: Many students matched assumptions A and B correctly. For assumption C, many chose step 1, cutting the beetroot, instead of step 2, washing it.
Question 6
A level Paper 1 · June 2018 · Q20(b)(i) · 3 marks · Easy
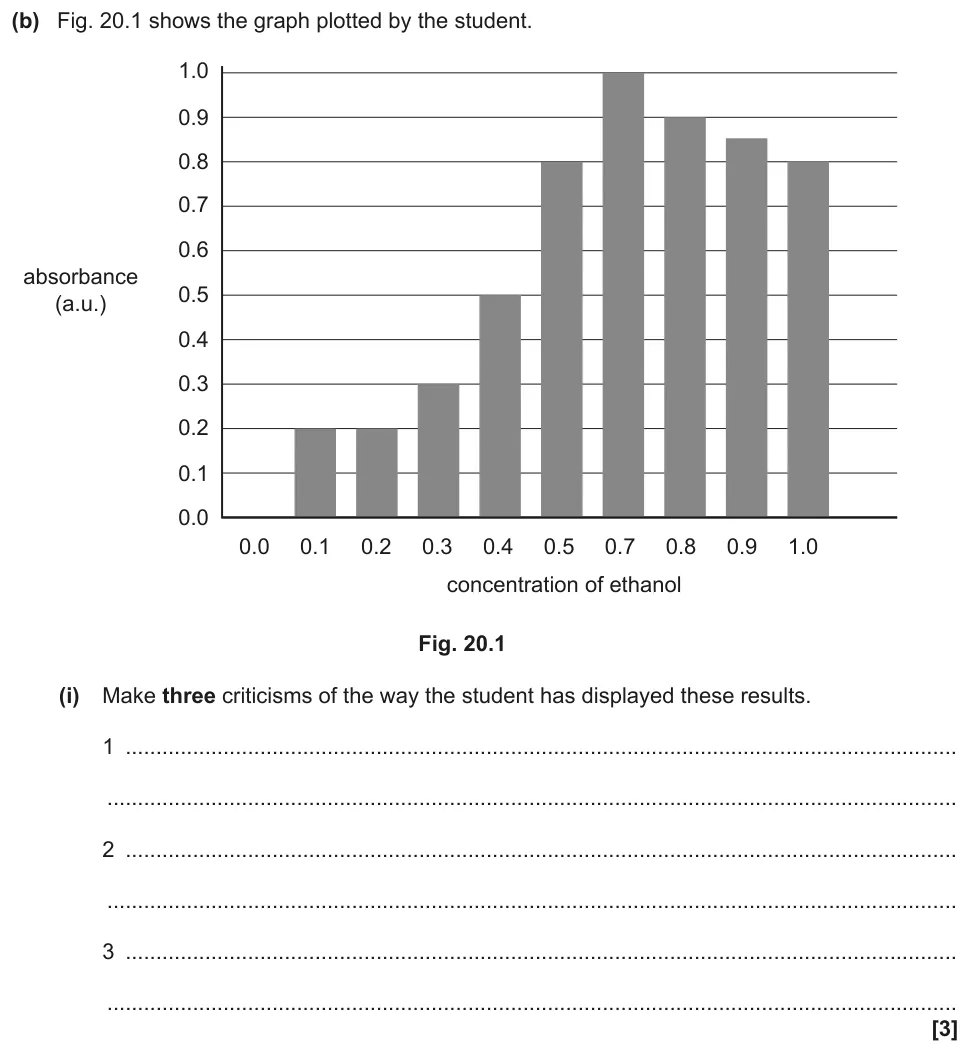
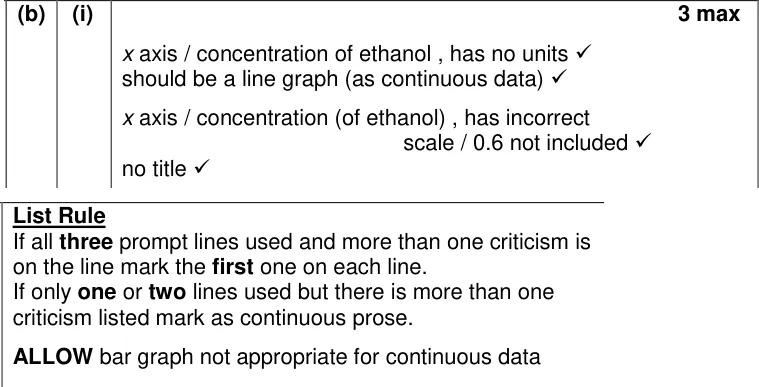
Give three criticisms of how a student has graphed beetroot absorbance results.
Show the mark scheme
Tap an image to open it full size.
From the examiners' report: This part was generally well answered, with marks open to students of all abilities.
Question 7
A level Paper 1 · June 2024 · Q22(b)(i) · 2 marks · Medium
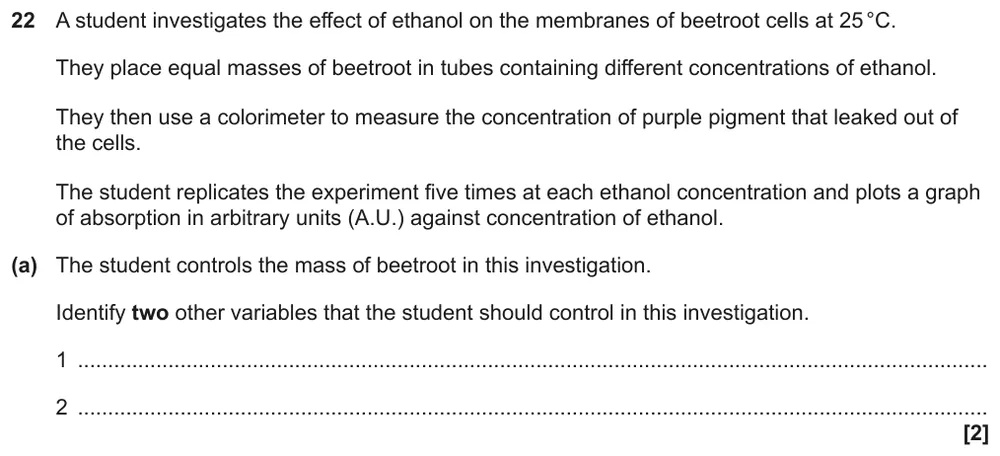
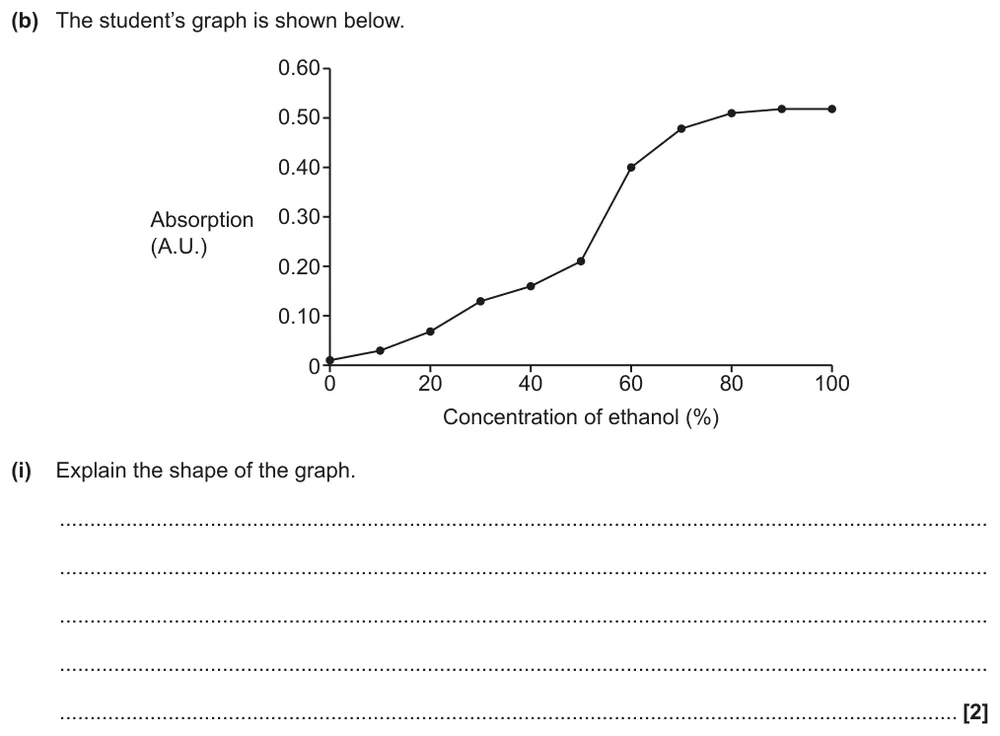
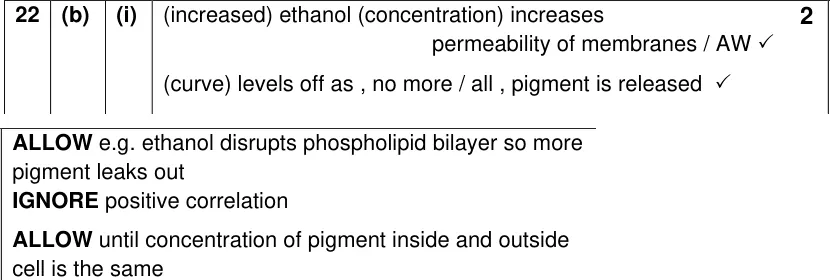
Explain the shape of a graph of pigment absorption against ethanol concentration.
Information from earlier in this question:
Show the mark scheme
Tap an image to open it full size.
From the examiners' report: Many students missed the command word and described the graph instead of explaining it. Good answers explained both the rise and the plateau.
Question 8
A level Paper 1 · June 2024 · Q22(b)(ii) · 2 marks · Medium
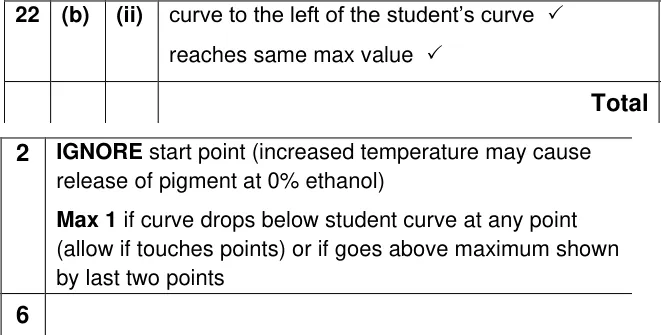
Sketch the graph you would expect if the experiment were repeated at 30 °C.

Show the mark scheme
Tap an image to open it full size.
From the examiners' report: Most students drew the curve to the left for one mark, but many carried it above the original maximum and lost the second mark. The total pigment in the beetroot doesn't change.
Question 9
A level Paper 2 · November 2021 · Q18(b)(iii) · 2 marks · Medium
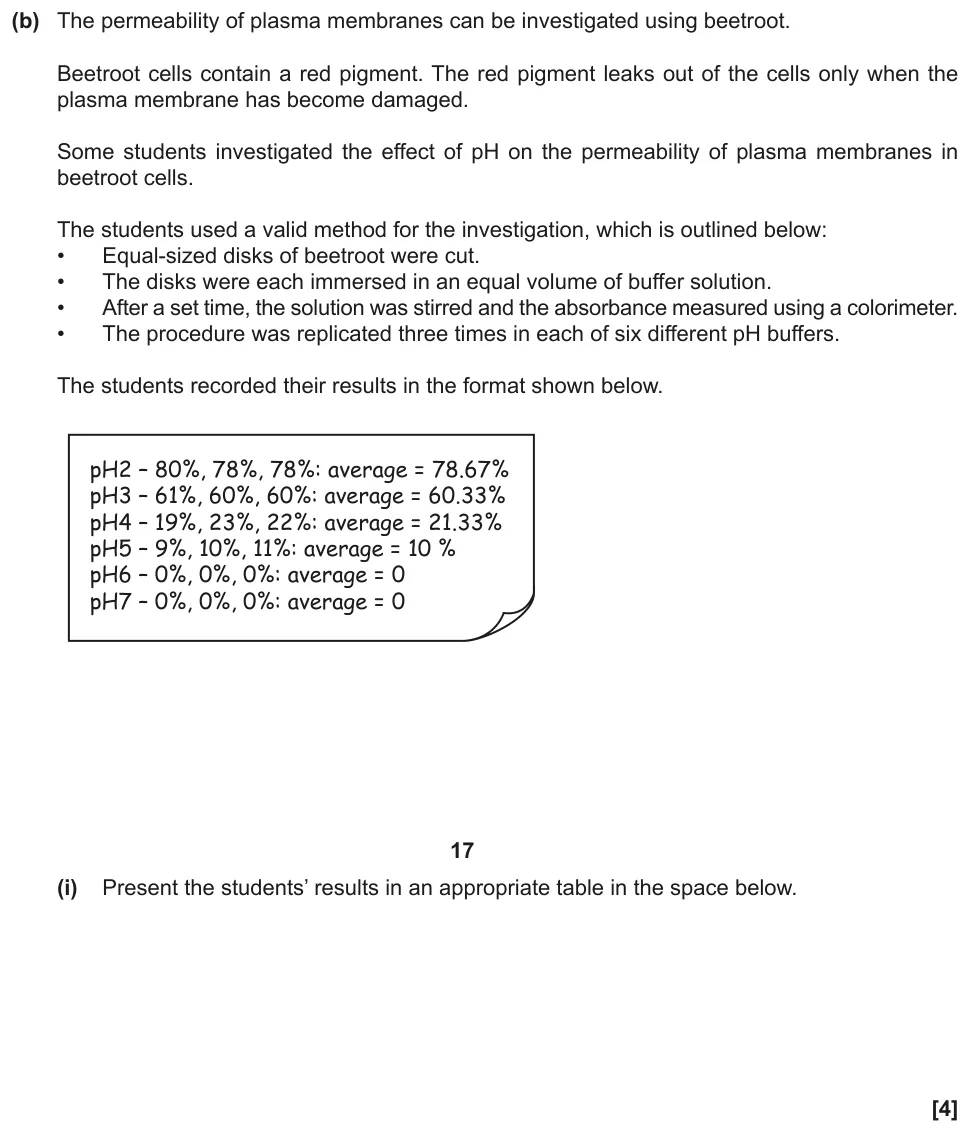
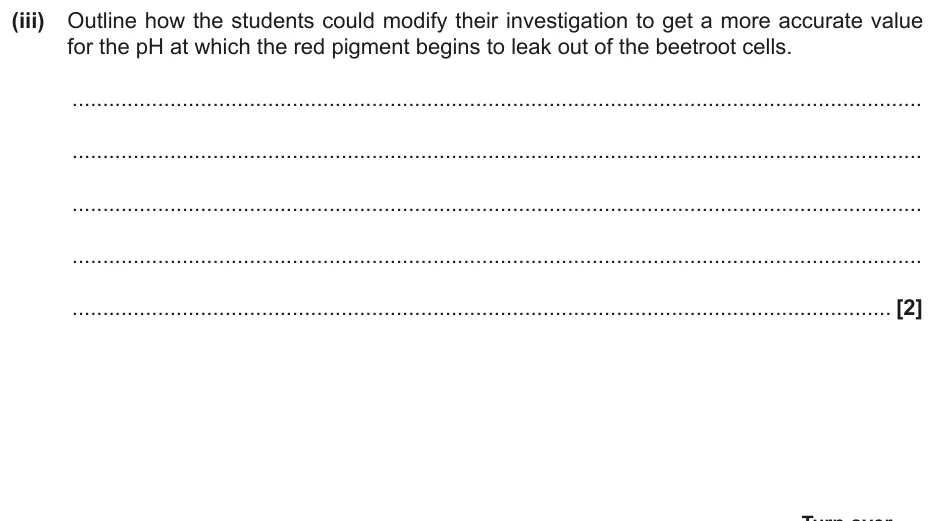
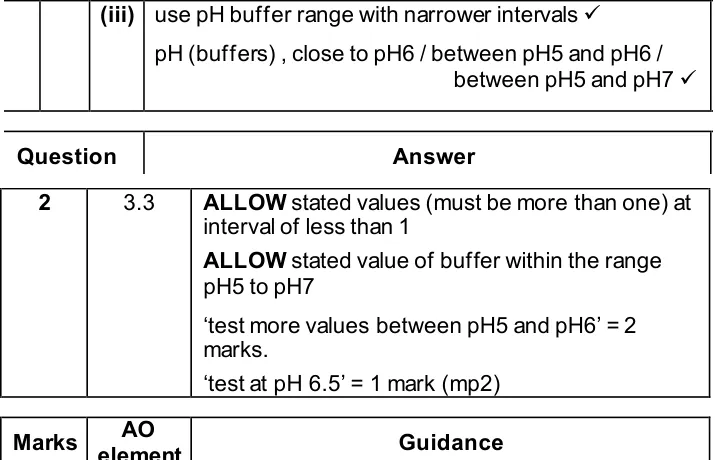
Suggest how to get a more accurate pH at which beetroot pigment starts to leak out.
Information from earlier in this question:
Show the mark scheme
Tap an image to open it full size.
Serial dilutions
Question 10
A level Paper 1 · June 2023 · Q17(c)(ii) · 2 marks · Easy
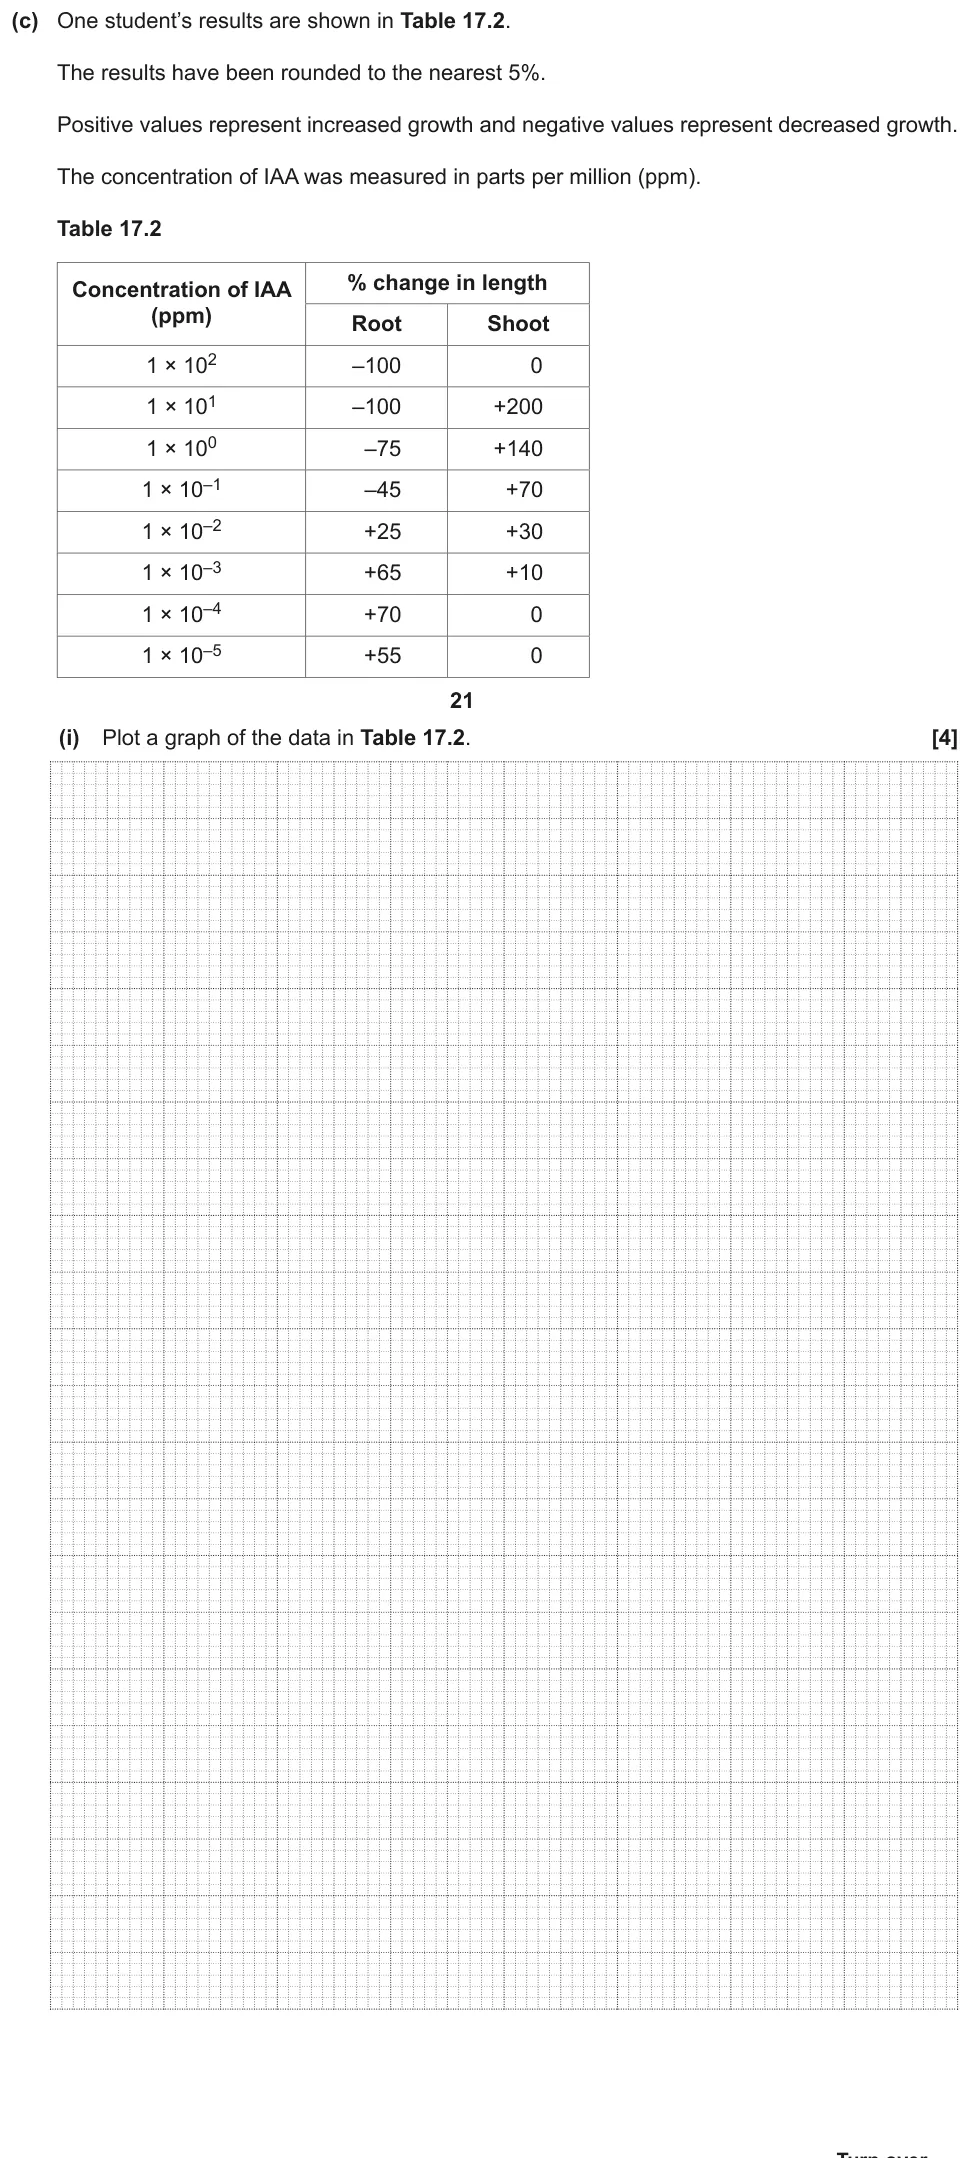
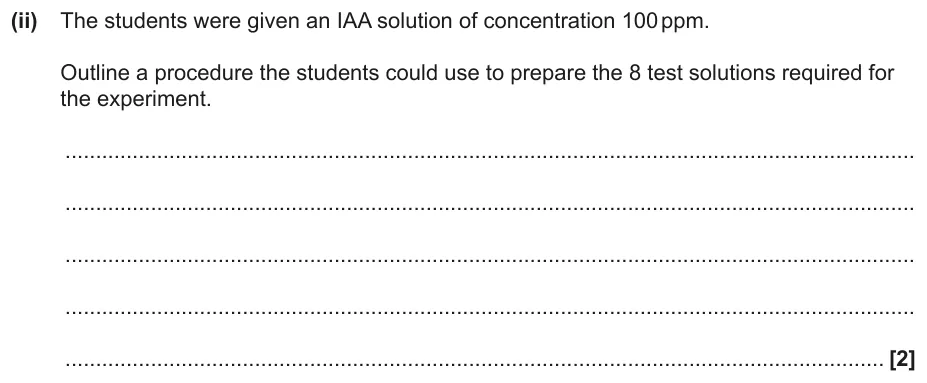
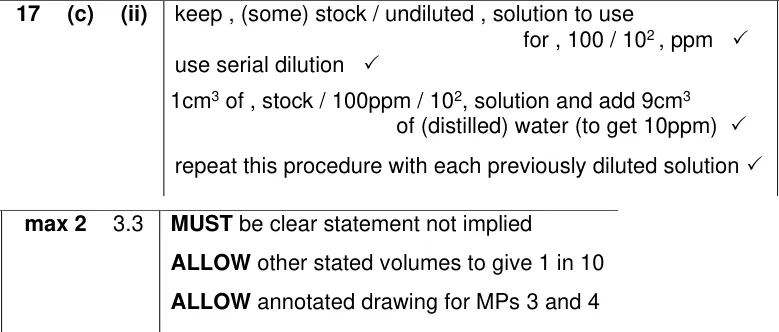
Outline how to make eight IAA solutions, each ten times weaker, from a 100 ppm stock.
Information from earlier in this question:
Show the mark scheme
Tap an image to open it full size.
From the examiners' report: Most students used the term serial dilution. A common error was mixing equal volumes of water and solution instead of 9 parts water to 1 part solution.
Question 11
A level Paper 1 · June 2023 · Q17(c)(iii) · 2 marks · Medium
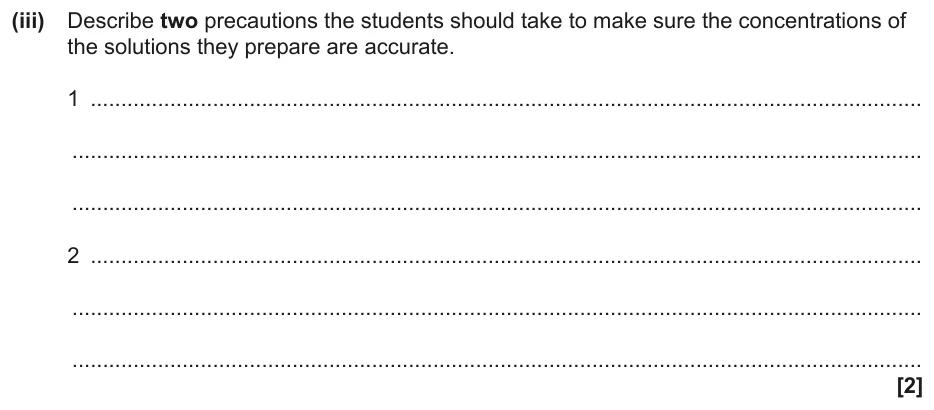
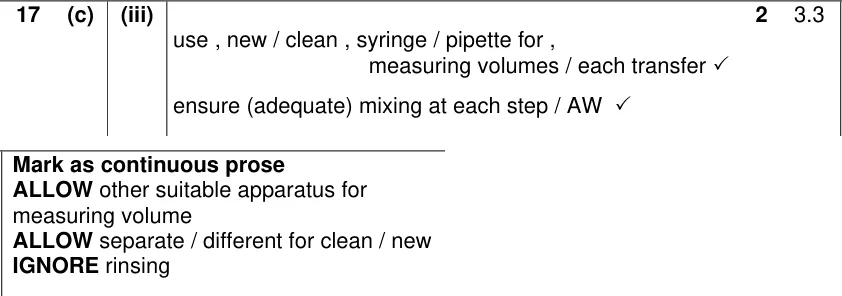
Describe two precautions that make the dilutions accurate.
Show the mark scheme
Tap an image to open it full size.
From the examiners' report: Only the strongest students got both marks. Use precise practical words: a clean pipette for each transfer, mixing each dilution.
Potometers
Question 12
AS Paper 2 · June 2019 · Q4(a)(i) · 1 mark · Medium
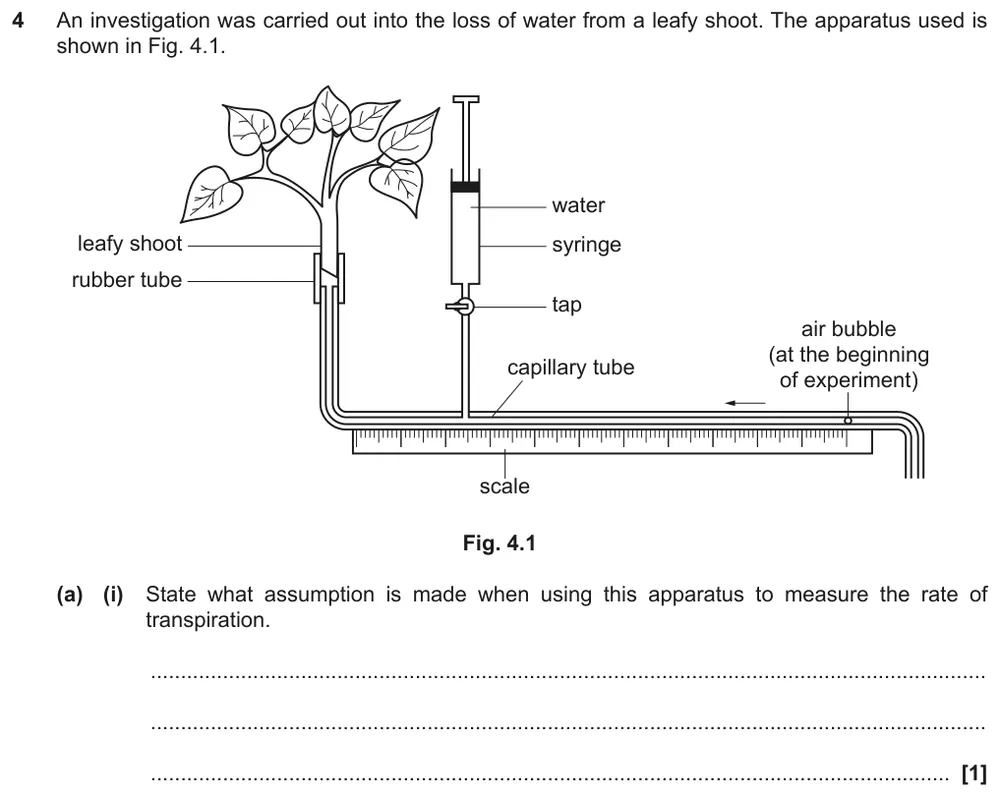
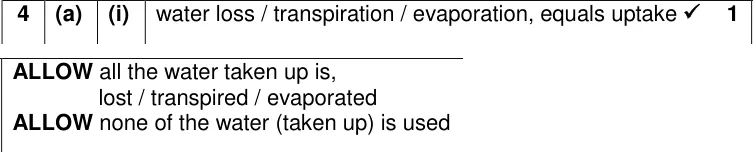
State the assumption made when a potometer is used to measure transpiration.
Show the mark scheme
Tap an image to open it full size.
From the examiners' report: Students often described using the apparatus, such as closing the tap, instead of the assumption: the potometer only measures transpiration if all the water taken up is lost.
Question 13
AS Paper 2 · June 2019 · Q4(a)(ii) · 6 marks · Medium
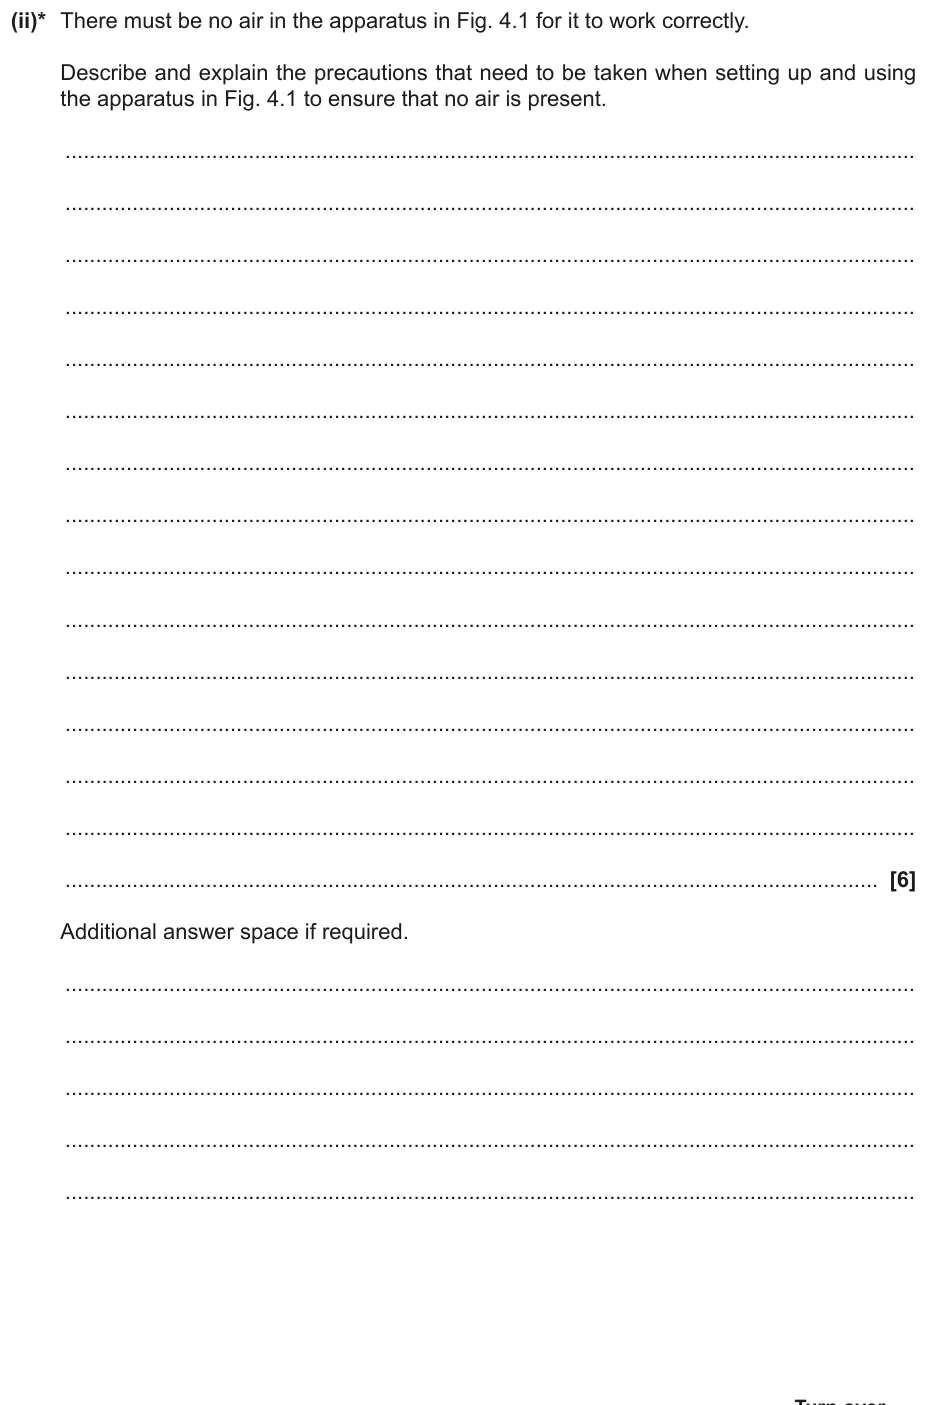
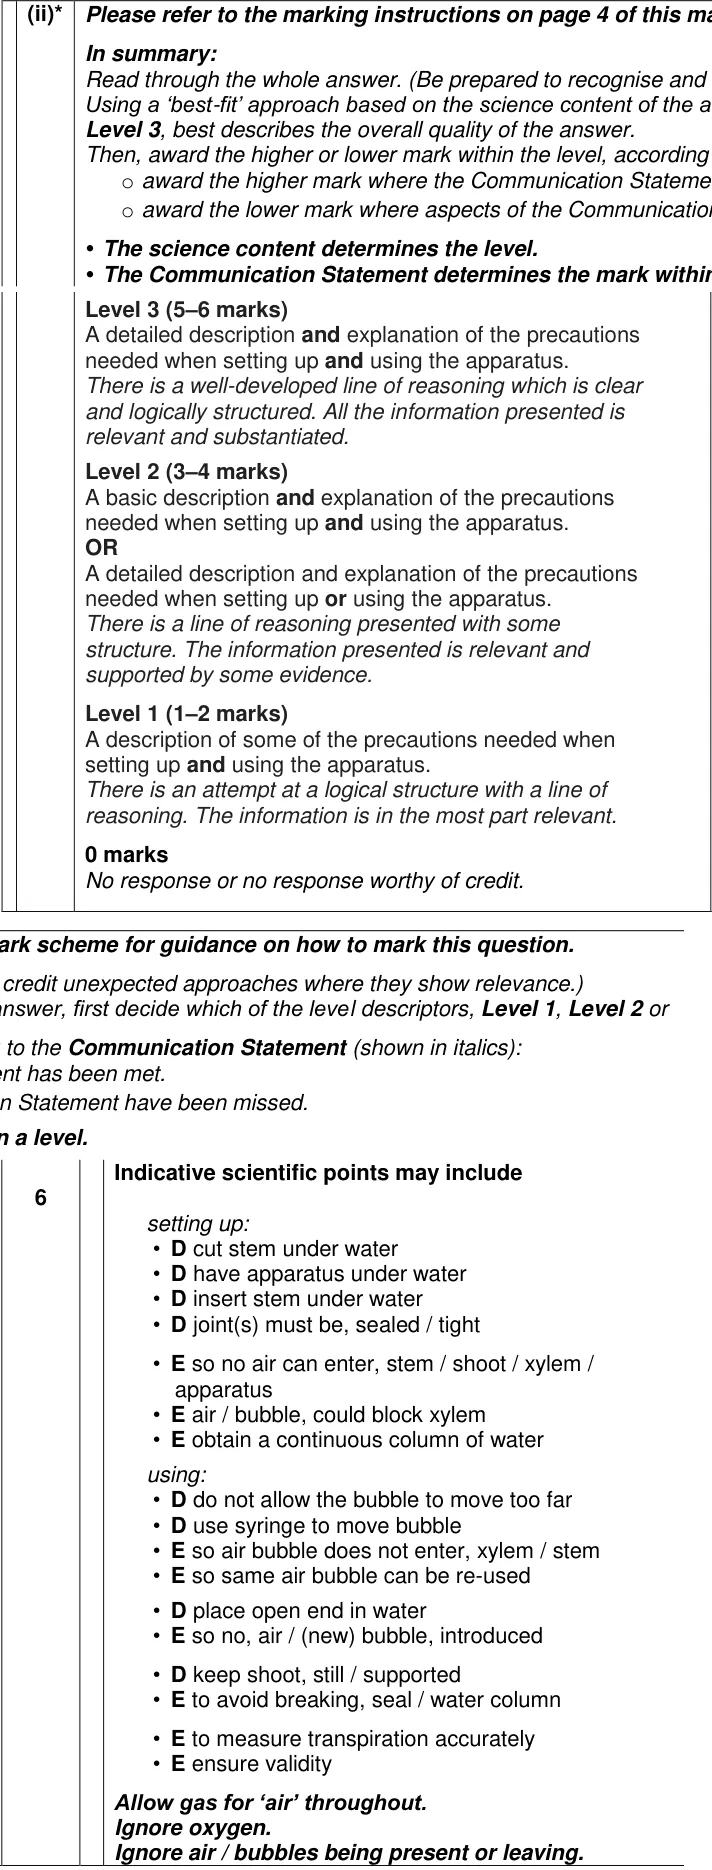
Describe and explain the precautions that keep air out of a potometer, when setting it up and while using it.
Show the mark scheme
Tap an image to open it full size.
From the examiners' report: Most students gave some precautions for setting up, but didn't go on to precautions while using the apparatus, which held many answers at Level 1. Explain how each precaution stops air getting in.
Question 14
AS Paper 2 · June 2023 · Q2(b)(i) · 3 marks · Easy
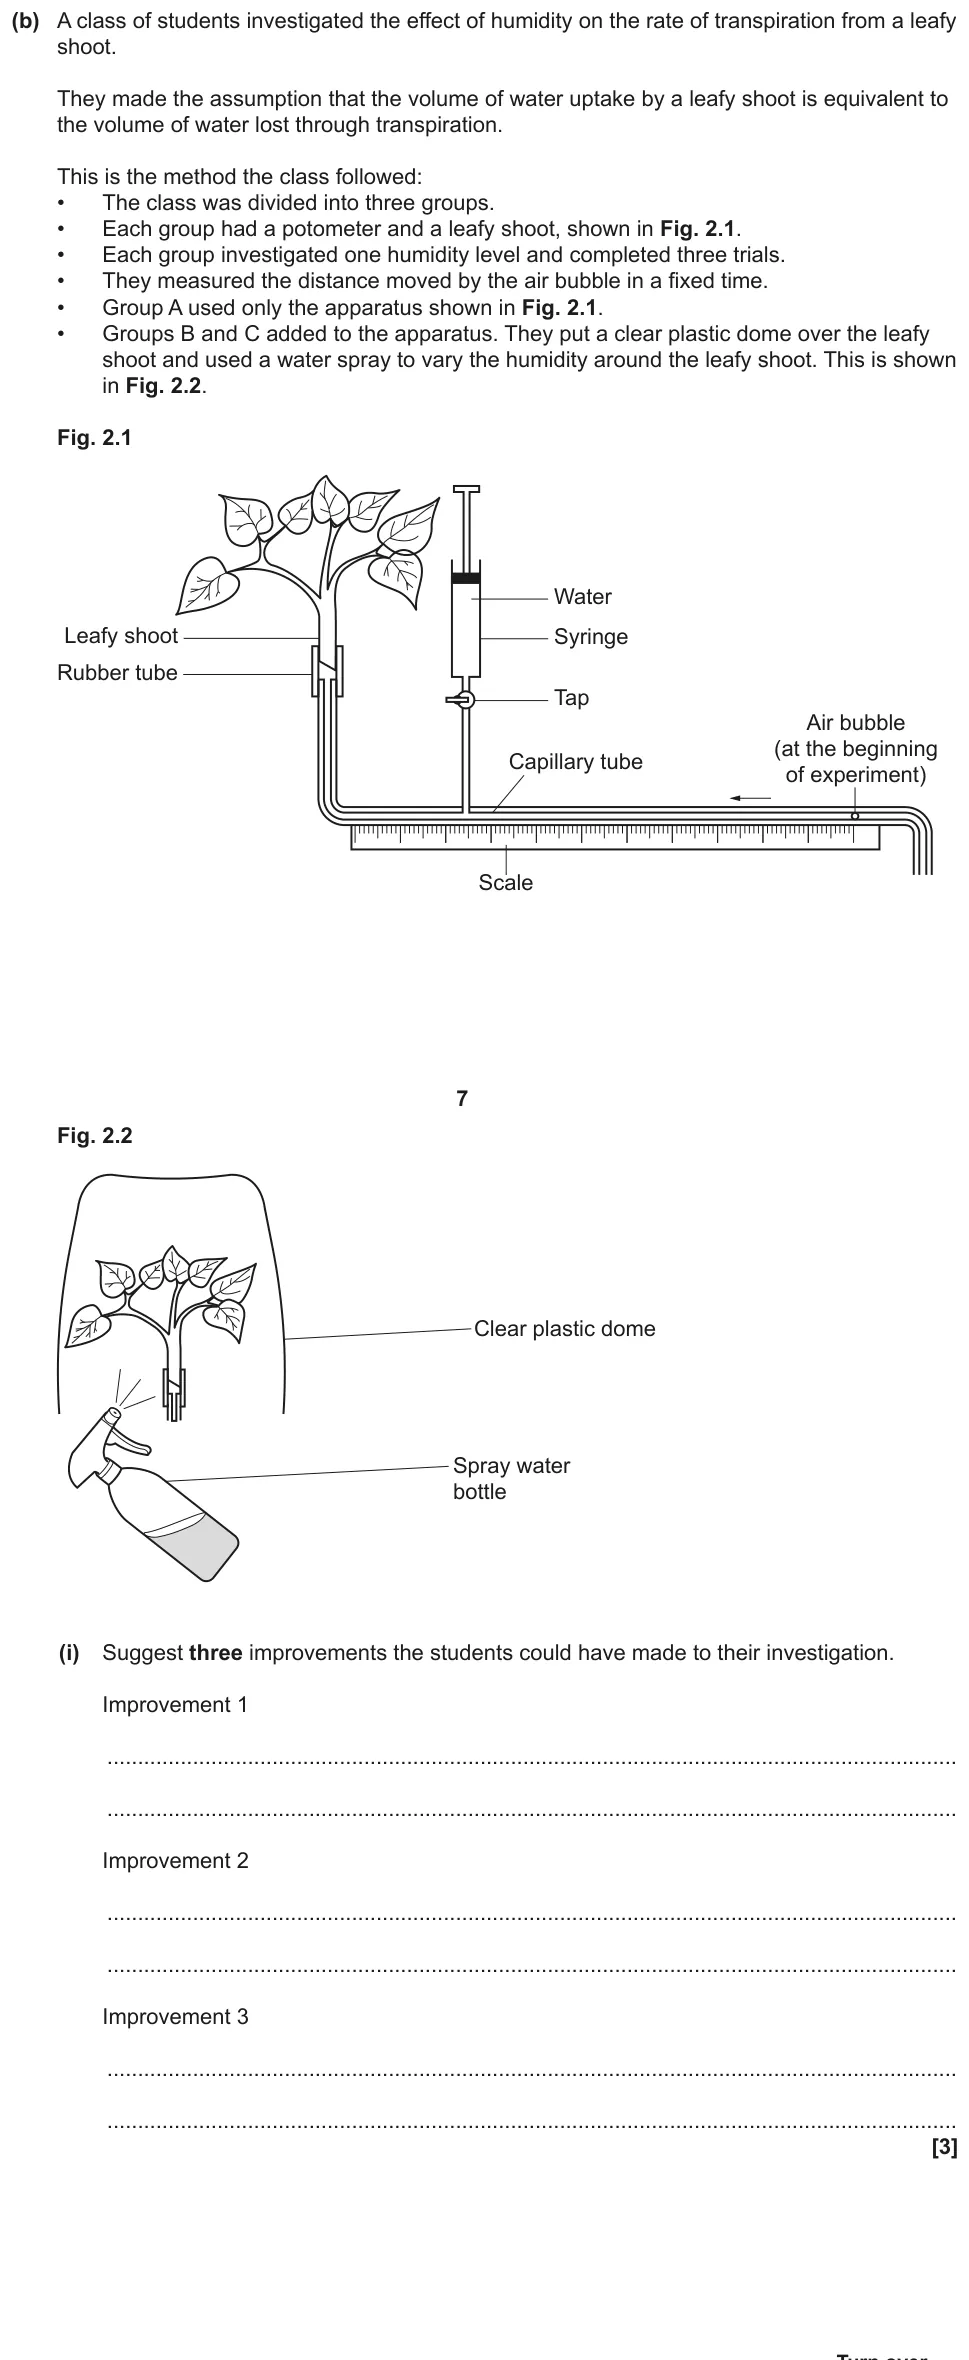
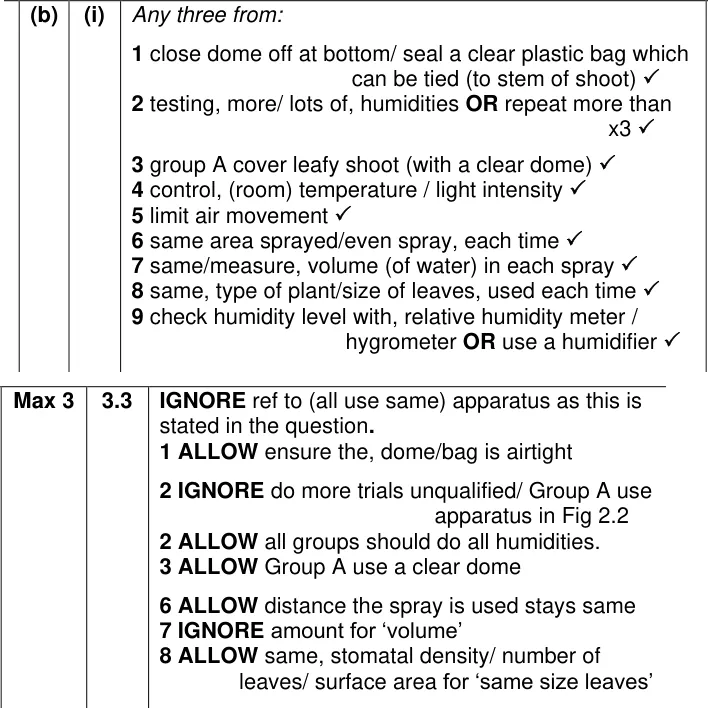
Suggest improvements to a class investigation into humidity and transpiration rate.
Show the mark scheme
Tap an image to open it full size.
From the examiners' report: Most students got one mark, few got all three. Many described setting up the potometer, which the groups had already done. Say 'volume' of water in each spray, not 'amount'.
Question 15
AS Paper 2 · June 2019 · Q4(b)(iii) · 3 marks · Medium
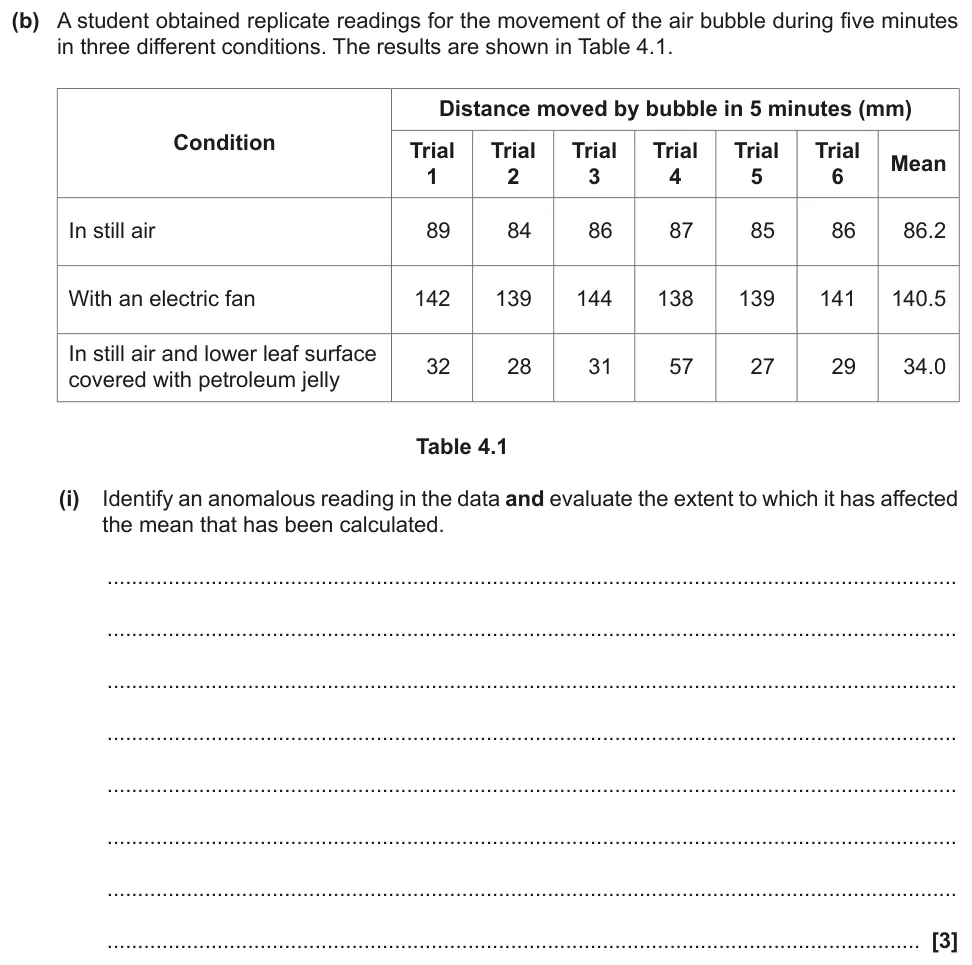
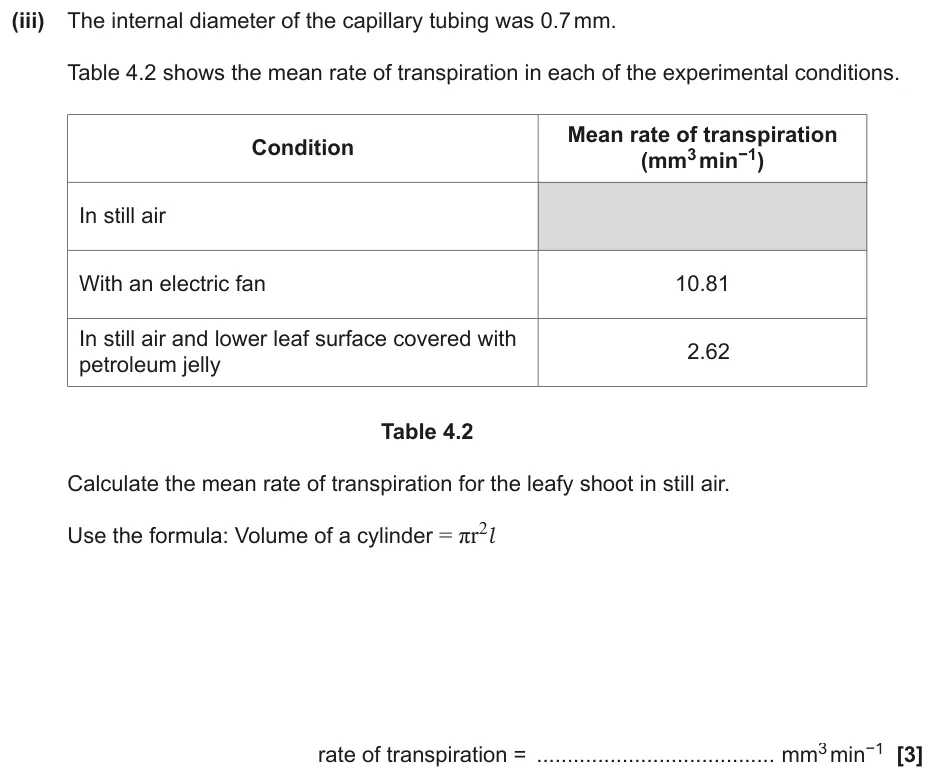
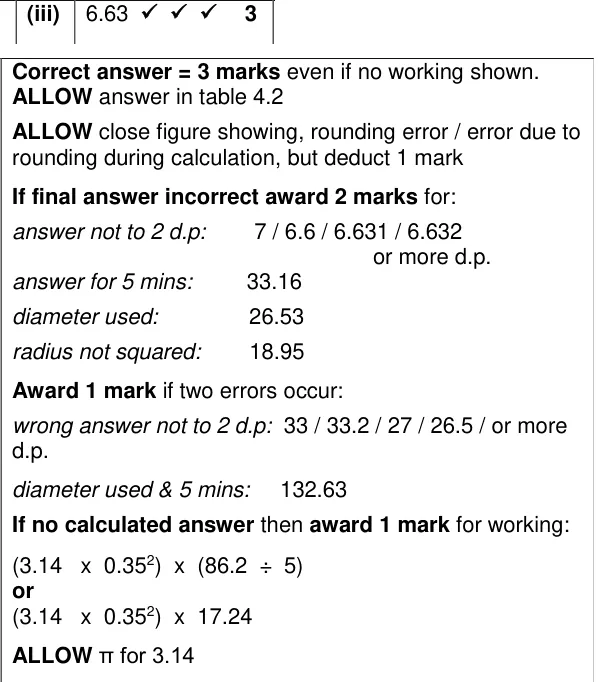
Calculate a transpiration rate in mm³ per minute from bubble distance and capillary diameter.
Information from earlier in this question:
Show the mark scheme
Tap an image to open it full size.
From the examiners' report: Most students did this well. Those who used the diameter instead of the radius lost a mark, and some forgot to divide the five-minute reading by five. Give the answer to 2 decimal places to match the table.
Question 16
A level Paper 3 · June 2024 · Q3(c)(i) · 2 marks · Hard
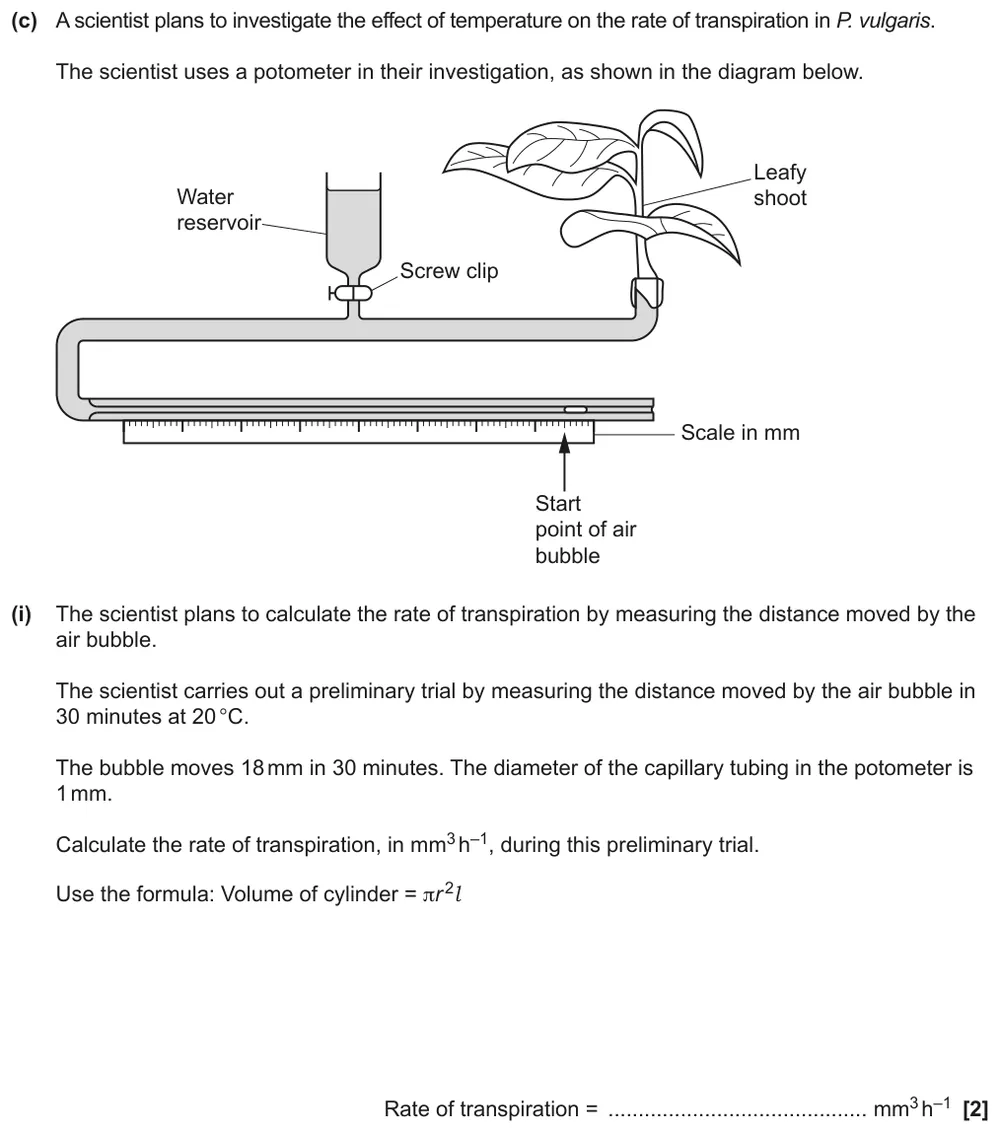
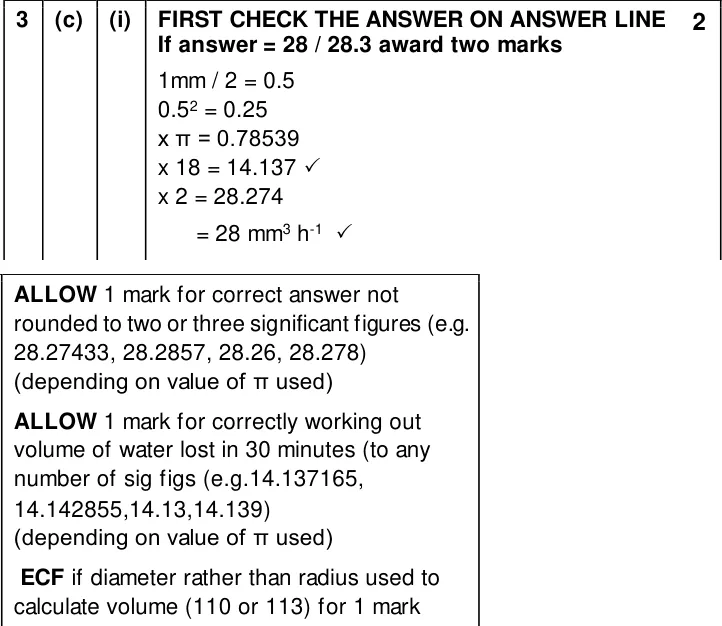
Calculate the rate of water uptake in mm³ per hour from a 30-minute potometer trial.
Show the mark scheme
Tap an image to open it full size.
From the examiners' report: Errors were spread across every step: not halving the diameter, not squaring the radius, and most often not converting 30 minutes to an hour, or halving instead of doubling.
Where students lose marks (from OCR examiners' reports and mark schemes)
Each point below is followed by wording that gained marks.
Zero it with a blank: Many students said a colorimeter is calibrated with 'a clear liquid' or a sample with no pigment, or put water in without saying it is set to zero.
✔ Gains credit: "Set the colorimeter to zero absorbance using a blank of distilled water" (or 100% transmission).
Accurate, not reliable: Saying calibration makes results 'more precise' or 'more reliable' as well as accurate lost the mark.
✔ Gains credit: "Calibrating means all the values are measured to the same standard, so they are accurate and comparable".
Match the filter to the colour: Students often chose a red filter for every colorimetry question because it is used for Benedict's, including for violet biuret and red beetroot pigment.
✔ Gains credit: "The filter depends on the colour of the solution: a red solution lets red light through, so absorbance would be low"; use a green or yellow filter for violet biuret.
Explain the rise and the plateau: Asked to explain a beetroot graph, many students described it instead, and few explained why it levels off.
✔ Gains credit: "Ethanol increases membrane permeability, so more pigment leaks out; the curve levels off when all the pigment has been released".
Same maximum at a higher temperature: Sketching the 30 °C result, many drew the curve to the left but above the original maximum.
✔ Gains credit: A curve to the left of the original that levels off at the same maximum absorbance.
Serial dilution is 1 in 10: A common error was mixing equal volumes of water and solution, which halves the concentration rather than giving the 10-fold steps needed.
✔ Gains credit: "Add 1 cm³ of the 100 ppm solution to 9 cm³ of distilled water to make 10 ppm, then repeat from each new solution, using a clean pipette and mixing each time".
State the potometer assumption: Students described using the apparatus, such as closing the tap, instead of what it assumes.
✔ Gains credit: "The volume of water taken up equals the volume lost by transpiration; none is used by the plant".
Radius, squared, then per hour: Potometer calculations lost marks for using the diameter, not squaring the radius, and not converting the time to the unit asked for.
✔ Gains credit: "r = 1 ÷ 2 = 0.5 mm; πr²l = π × 0.25 × 18 = 14.1 mm³ in 30 min, so 28 mm³ h⁻¹".
Download the questions
Download the PDF pack (16 questions, mark schemes at the end)
Keep practising
- Graph Skills (M3): OCR A Level Biology exam questions by topic
- Carbohydrates: OCR A Level Biology exam questions by topic
- OCR A Level Biology practical skills quiz
- Transport in Plants quiz
- OCR A Level Biology masterclasses
Questions, mark schemes and examiners' report extracts © OCR.