

OCR A M1 · 20 questions · mark schemes and examiners’ tips included
Handling data is the biggest group of maths skills in the OCR A Level Biology specification, and it turns up on every paper. It covers rounding to the right number of significant figures, means, histograms, probability, sampling, correlation, statistical tests, standard deviation and uncertainty. The biology changes from cloned goats to cheetahs to wood sorrel, but the maths underneath is the same each time.
The examiners' reports show that students lose marks here on the detail rather than the idea. They round 31.66 to 31.6, divide by the wrong value in a percentage change, name the t-test but don't say it compares means, ignore overlapping error bars, or forget that a length measured from two readings has two uncertainties. Every one of these is easy to fix once you've seen it.
Work through the twenty questions below with a calculator. They are grouped by skill, starting with significant figures and means and finishing with statistical tests, standard deviation and uncertainty. If you'd like to go through questions like these with me each week, my OCR A masterclasses run on Wednesdays at 5.15pm for Year 12 and on Tuesdays at 6.30pm or Thursdays at 5.15pm for Year 13.
What these questions cover (OCR maths skills M1: handling data)
The questions test these mathematical skills from the OCR A Level Biology A specification (H420):
- M1.1 Use an appropriate number of significant figures
- M1.2 Find arithmetic means
- M1.3 Construct and interpret frequency tables and diagrams, bar charts and histograms
- M1.4 Understand simple probability
- M1.5 Understand the principles of sampling as applied to scientific data
- M1.6 Understand the terms mean, median and mode
- M1.7 Use a scatter diagram to identify a correlation between two variables
- M1.8 Make order of magnitude calculations
- M1.9 Select and use a statistical test
- M1.10 Understand measures of dispersion, including standard deviation and range
- M1.11 Identify uncertainties in measurements and use simple techniques to determine uncertainty when data are combined
How to use this page
Write your answer on paper before you open the mark scheme. Allow about 1.2 minutes per mark: the 20 questions are worth 46 marks, so about 55 minutes in total. Then mark your answer strictly against the mark scheme and read the examiners' tip underneath it. If you'd rather print the questions, download the PDF pack.
Significant figures and means (M1.1, M1.2)
Question 1
A level Paper 2 · June 2019 · Q19(c)(i) · 2 marks · Easy
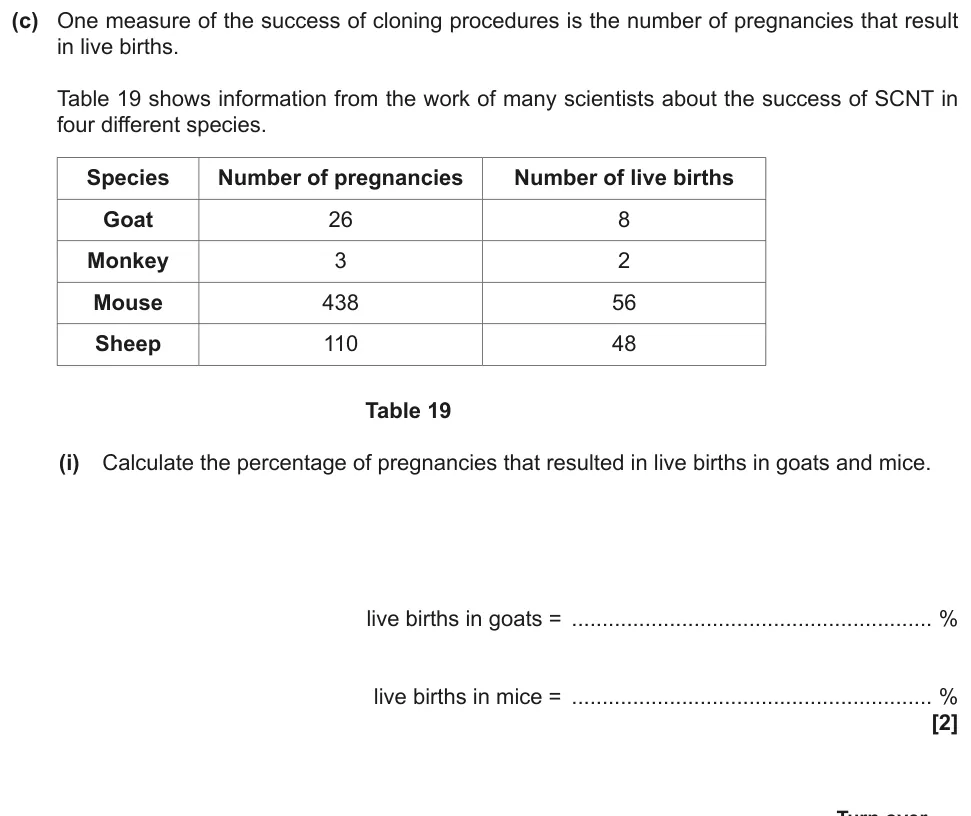
Calculate the percentage of pregnancies that gave live births in cloned goats and mice.
Show the mark scheme

Tap an image to open it full size.
From the examiners' report: Most students got both marks. The marks that were lost were for rounding wrongly or giving too many significant figures, so match your answer to the precision of the data.
Question 2
A level Paper 1 · June 2023 · Q17(b) · 2 marks · Medium
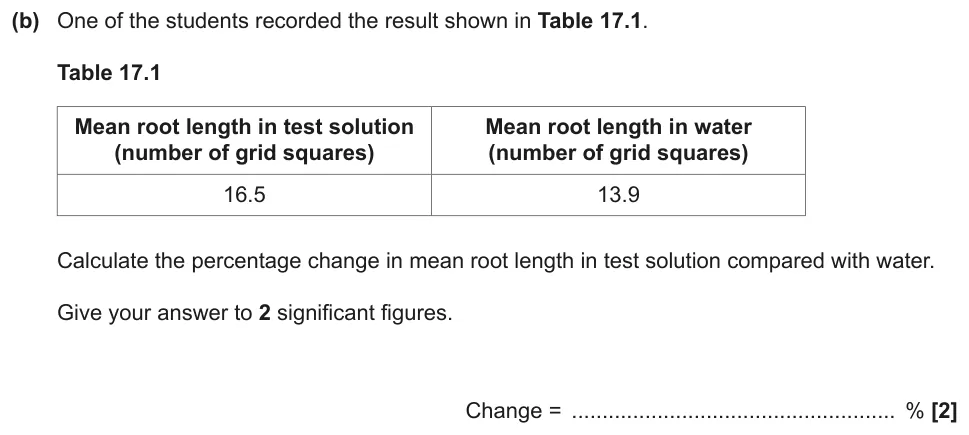
Calculate the percentage change in mean root length compared with water, to 2 significant figures.
Show the mark scheme
Tap an image to open it full size.
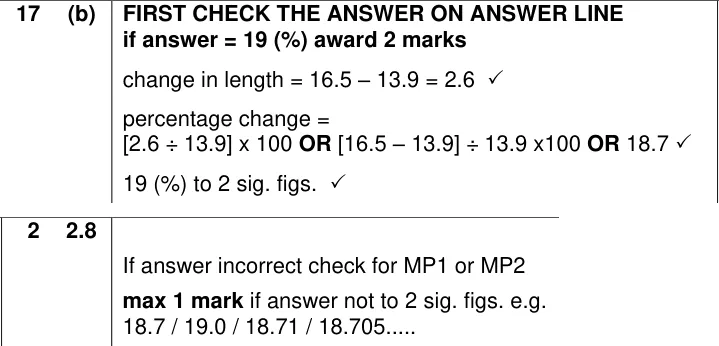
From the examiners' report: The common error was dividing the difference by the final length, which gives 16%. Always divide by the value you are comparing against (here water), then round to the 2 significant figures the question asks for. Show your working so a slip still earns a mark.
Question 3
AS Paper 2 · June 2023 · Q2(b)(ii) · 2 marks · Easy
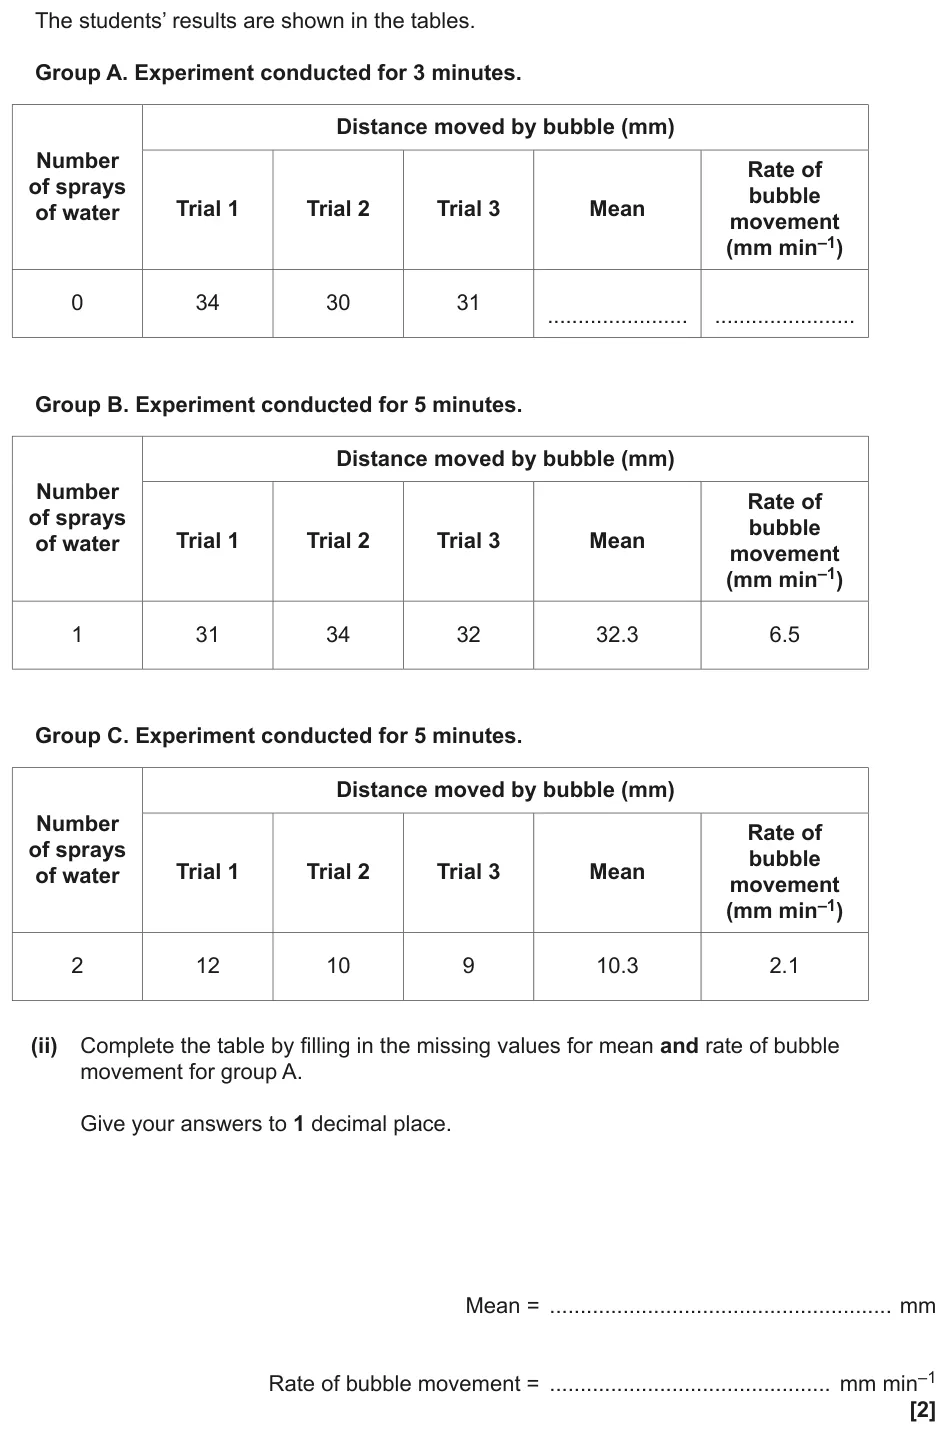
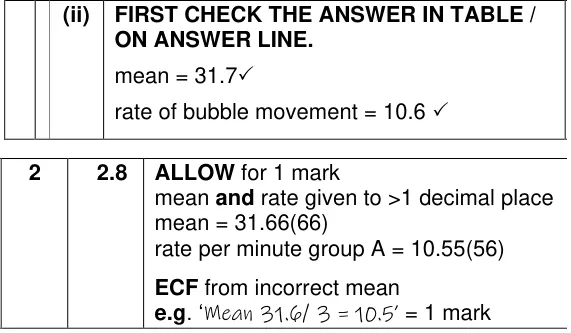
Work out a mean distance and a rate of bubble movement, both to 1 decimal place.
Show the mark scheme
Tap an image to open it full size.
From the examiners' report: Most students found the rate, but the usual mistake for the mean was 31.6, from rounding down instead of up. A recurring dot over 31.6 is not 1 decimal place either: write 31.7. Remember group A ran for 3 minutes, not 5.
Question 4
AS Paper 2 · June 2019 · Q4(b)(i) · 3 marks · Medium
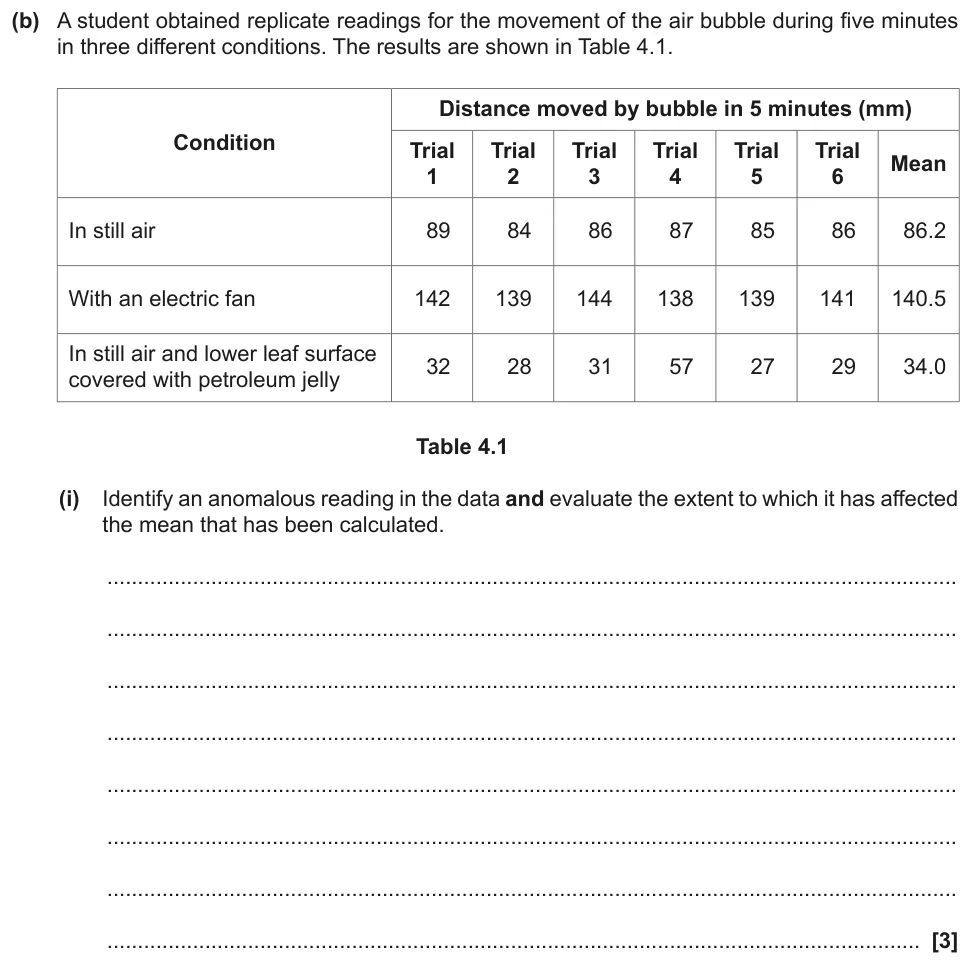
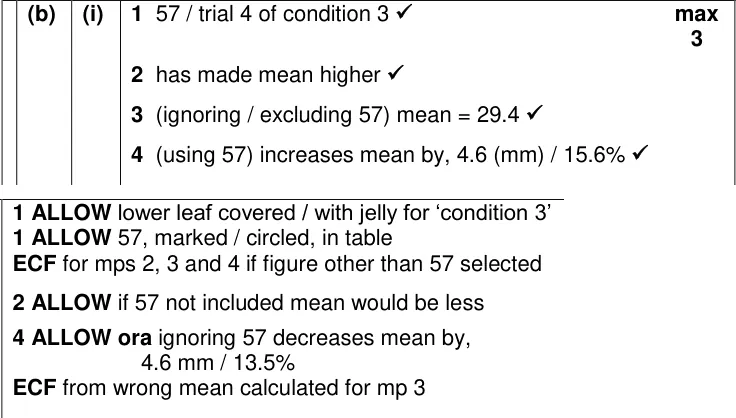
Identify an anomalous reading and evaluate how much it has changed the mean.
Show the mark scheme
Tap an image to open it full size.
From the examiners' report: Most students spotted 57 and said it made the mean higher. Full marks came from backing this up with a number: recalculate the mean without it (29.4 mm) or give the difference it makes.
Frequency diagrams and averages (M1.3, M1.6)
Question 5
A level Paper 2 · June 2022 · Q19(a)(i) · 5 marks · Medium
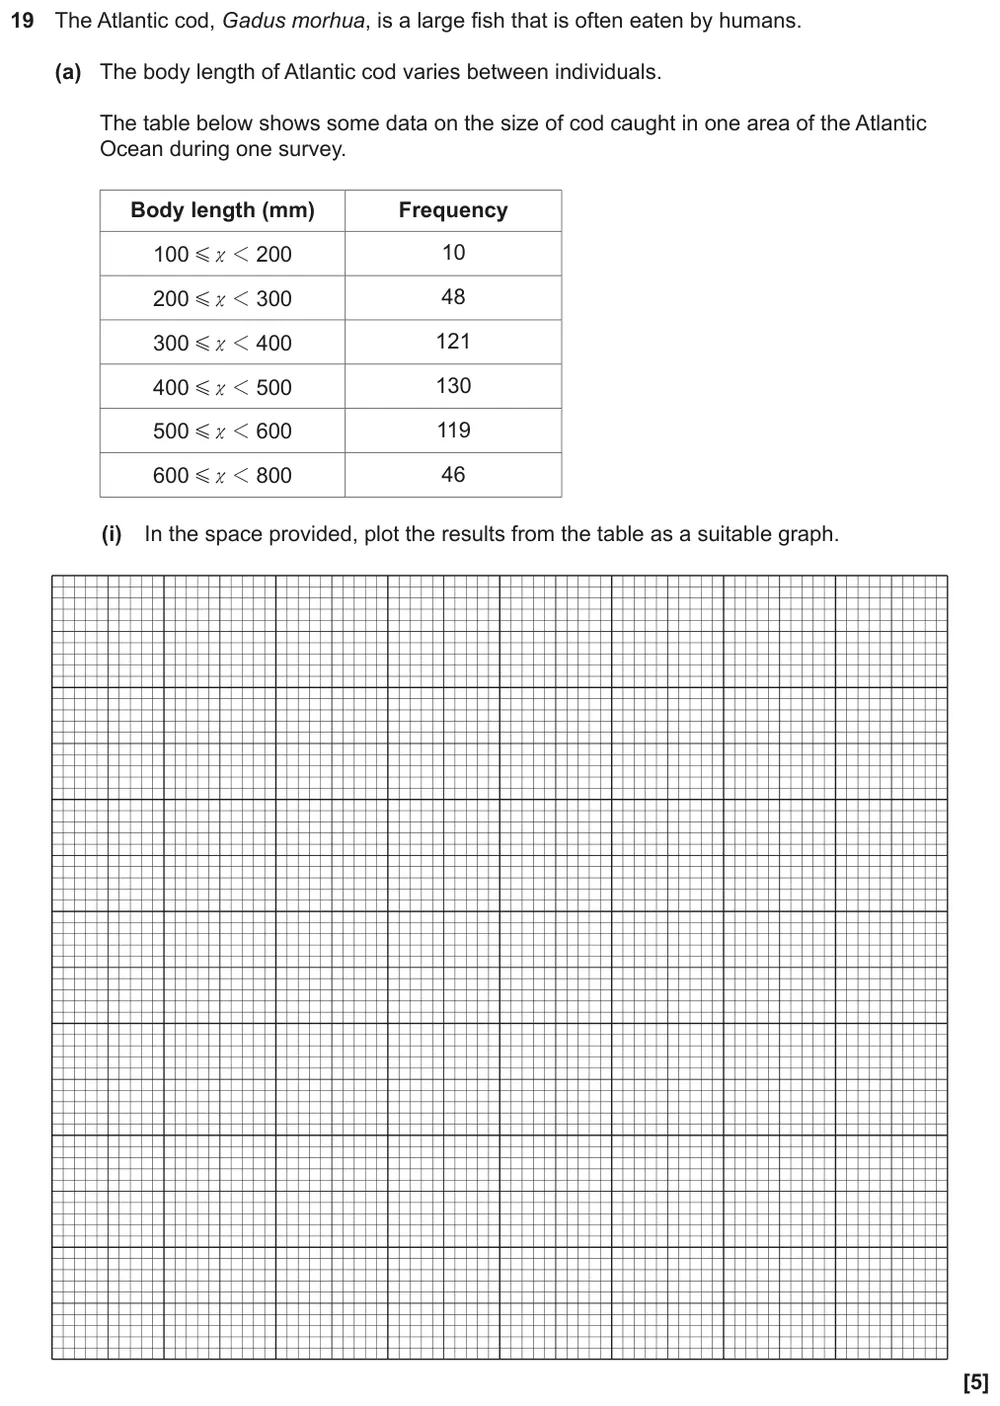
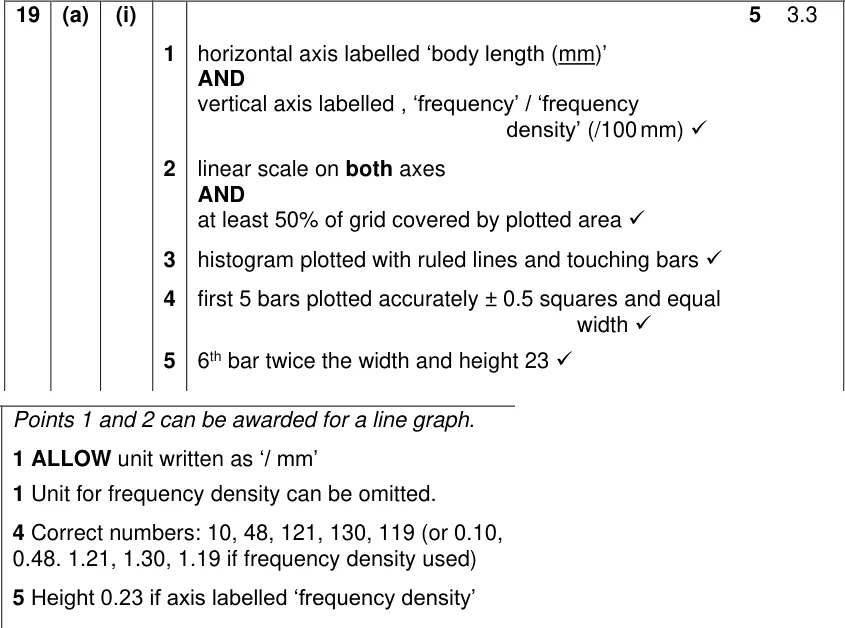
Plot the body lengths of Atlantic cod as a histogram, including one wider class.
Show the mark scheme
Tap an image to open it full size.
From the examiners' report: Most students labelled the axes, but some used a category scale on the x axis or drew a bar chart with gaps. Continuous data needs a histogram with touching bars. Very few spotted that the 600–800 mm class is twice as wide, so its bar must be twice as wide and half the height.
Question 6
A level Paper 3 · June 2019 · Q3(c)(iii) · 2 marks · Hard
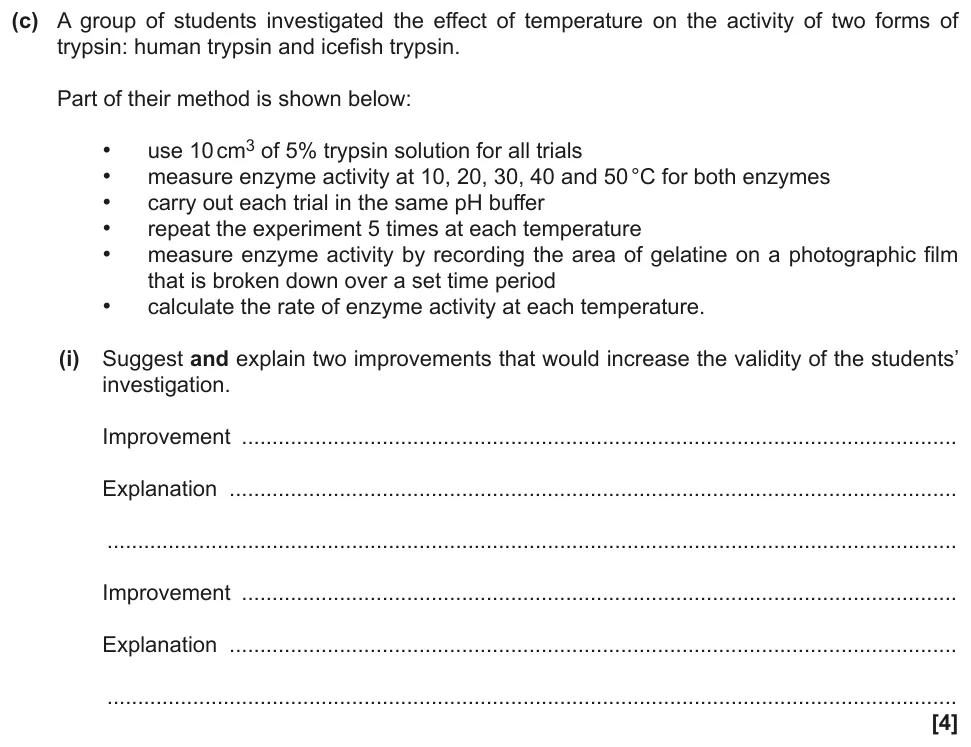
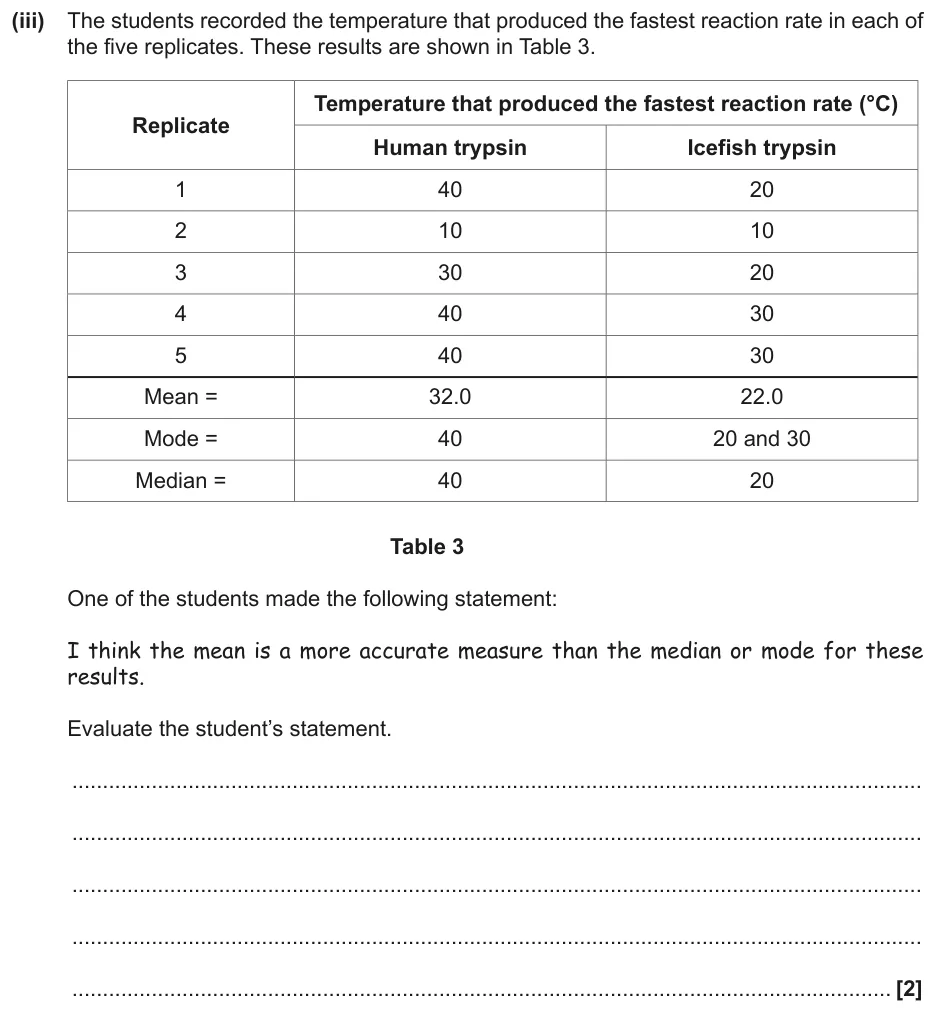
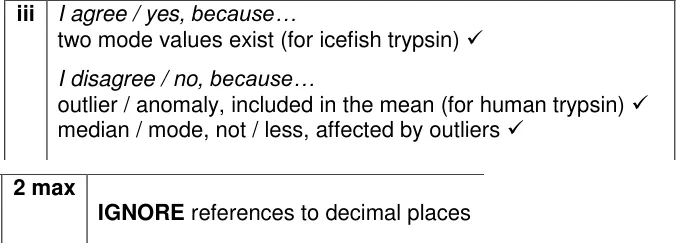
Evaluate a claim that the mean is a better measure than the median or mode for the trypsin results.
Information from earlier in this question:
Show the mark scheme
Tap an image to open it full size.
From the examiners' report: Definitions of mean, median and mode earned nothing. Use the table: the 10 °C outlier drags the human mean down, the median and mode ignore it, and icefish trypsin has two modes. Give a point on each side when you evaluate.
Probability and sampling (M1.4, M1.5)
Question 7
A level Paper 3 · June 2018 · Q4(b)(i) · 1 mark · Hard
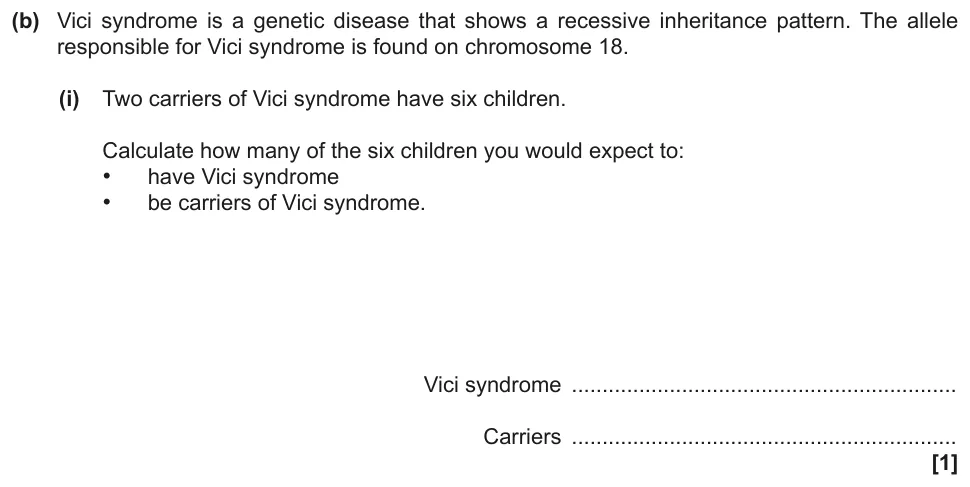
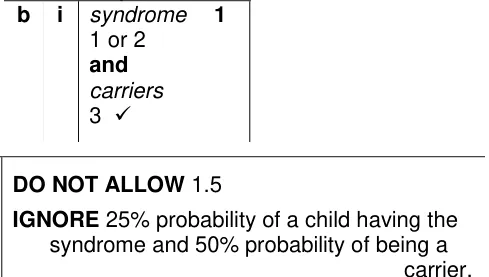
Work out how many of six children of two carriers you would expect to have Vici syndrome or be carriers.
Show the mark scheme
Tap an image to open it full size.
From the examiners' report: Most students got this right. The error was writing 1.5 children: a quarter of six is 1.5, but you can only have whole children, so round to 1 or 2.
Question 8
A level Paper 3 · June 2018 · Q4(b)(ii) · 1 mark · Medium
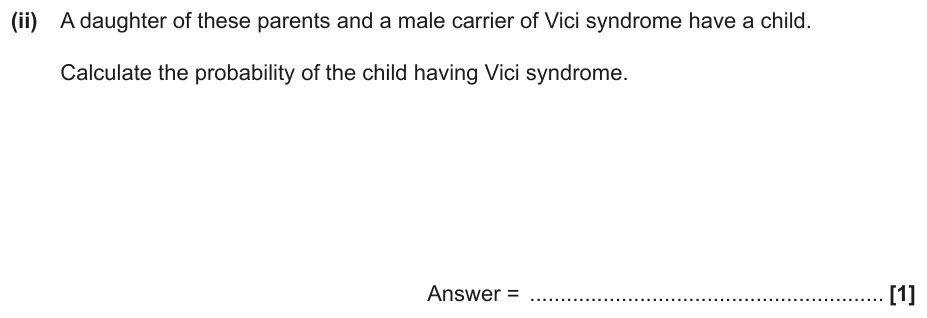
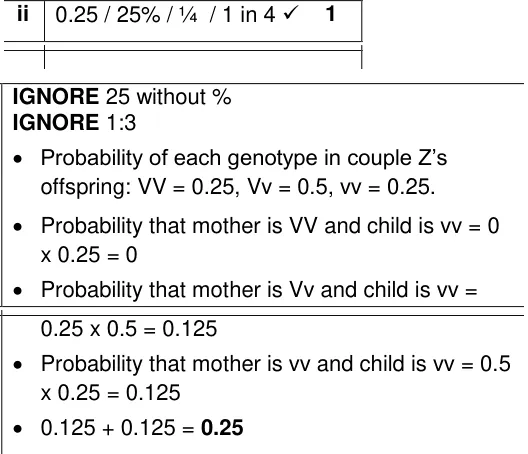
Calculate the probability that a daughter of the carriers and a male carrier have a child with Vici syndrome.
Show the mark scheme
Tap an image to open it full size.
From the examiners' report: This was a stretch question, but many students reached 25%. Write a probability as 0.25, 25% or 1 in 4, not as a ratio like 1:3 or a bare 25.
Question 9
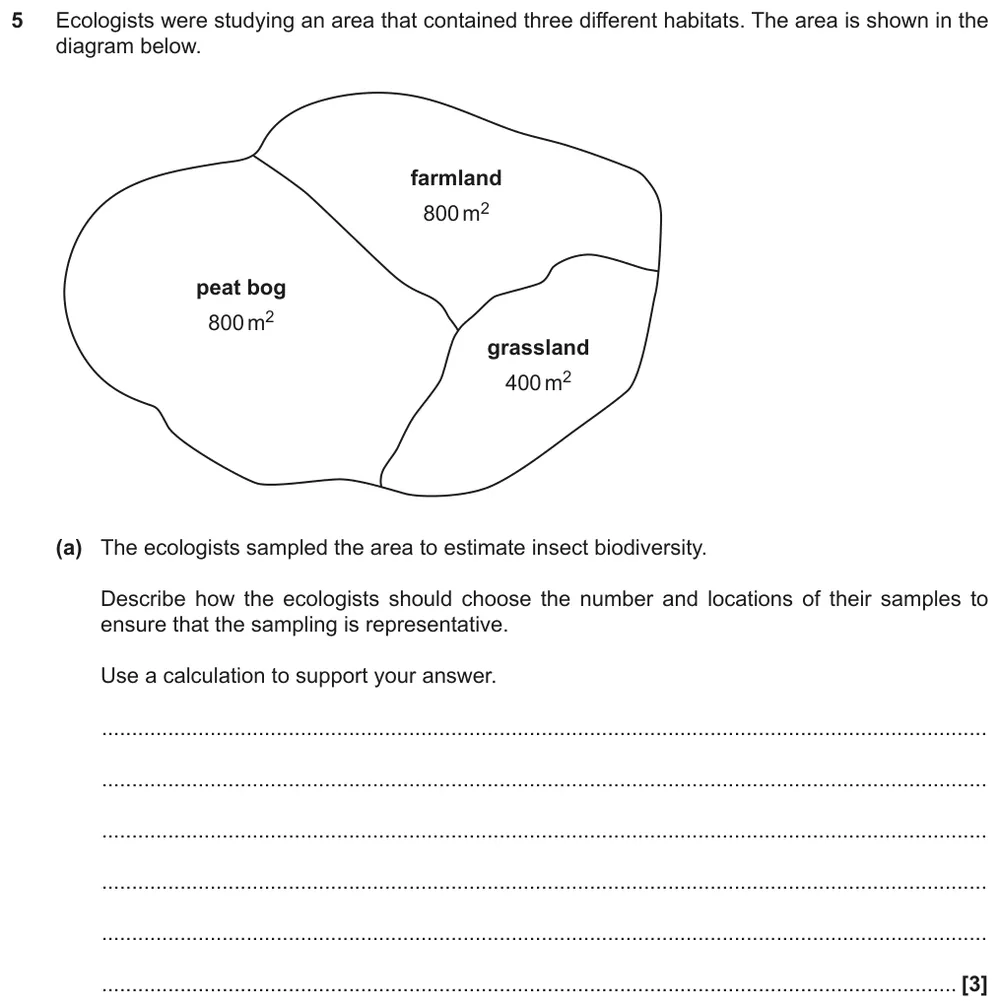
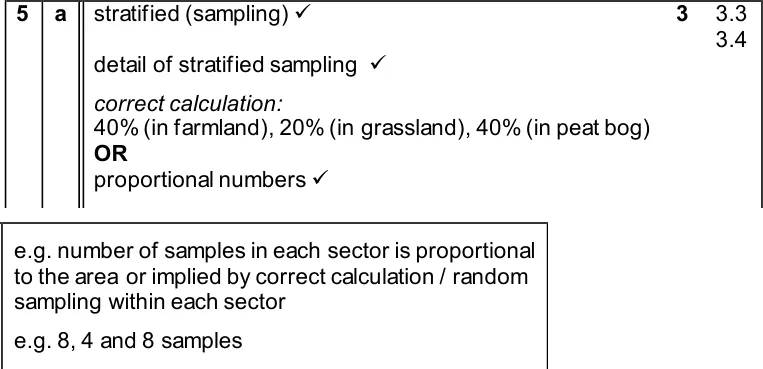
A level Paper 3 · November 2020 · Q5(a) · 3 marks · Hard
Describe how to choose the number and position of samples across three habitats of different areas.
Show the mark scheme
Tap an image to open it full size.
From the examiners' report: Most students knew samples should be in proportion to the area. Marks were lost for not naming stratified sampling or leaving out the calculation the question asked for, such as 8 samples in farmland, 8 in peat bog and 4 in grassland.
Correlation and orders of magnitude (M1.7, M1.8)
Question 10
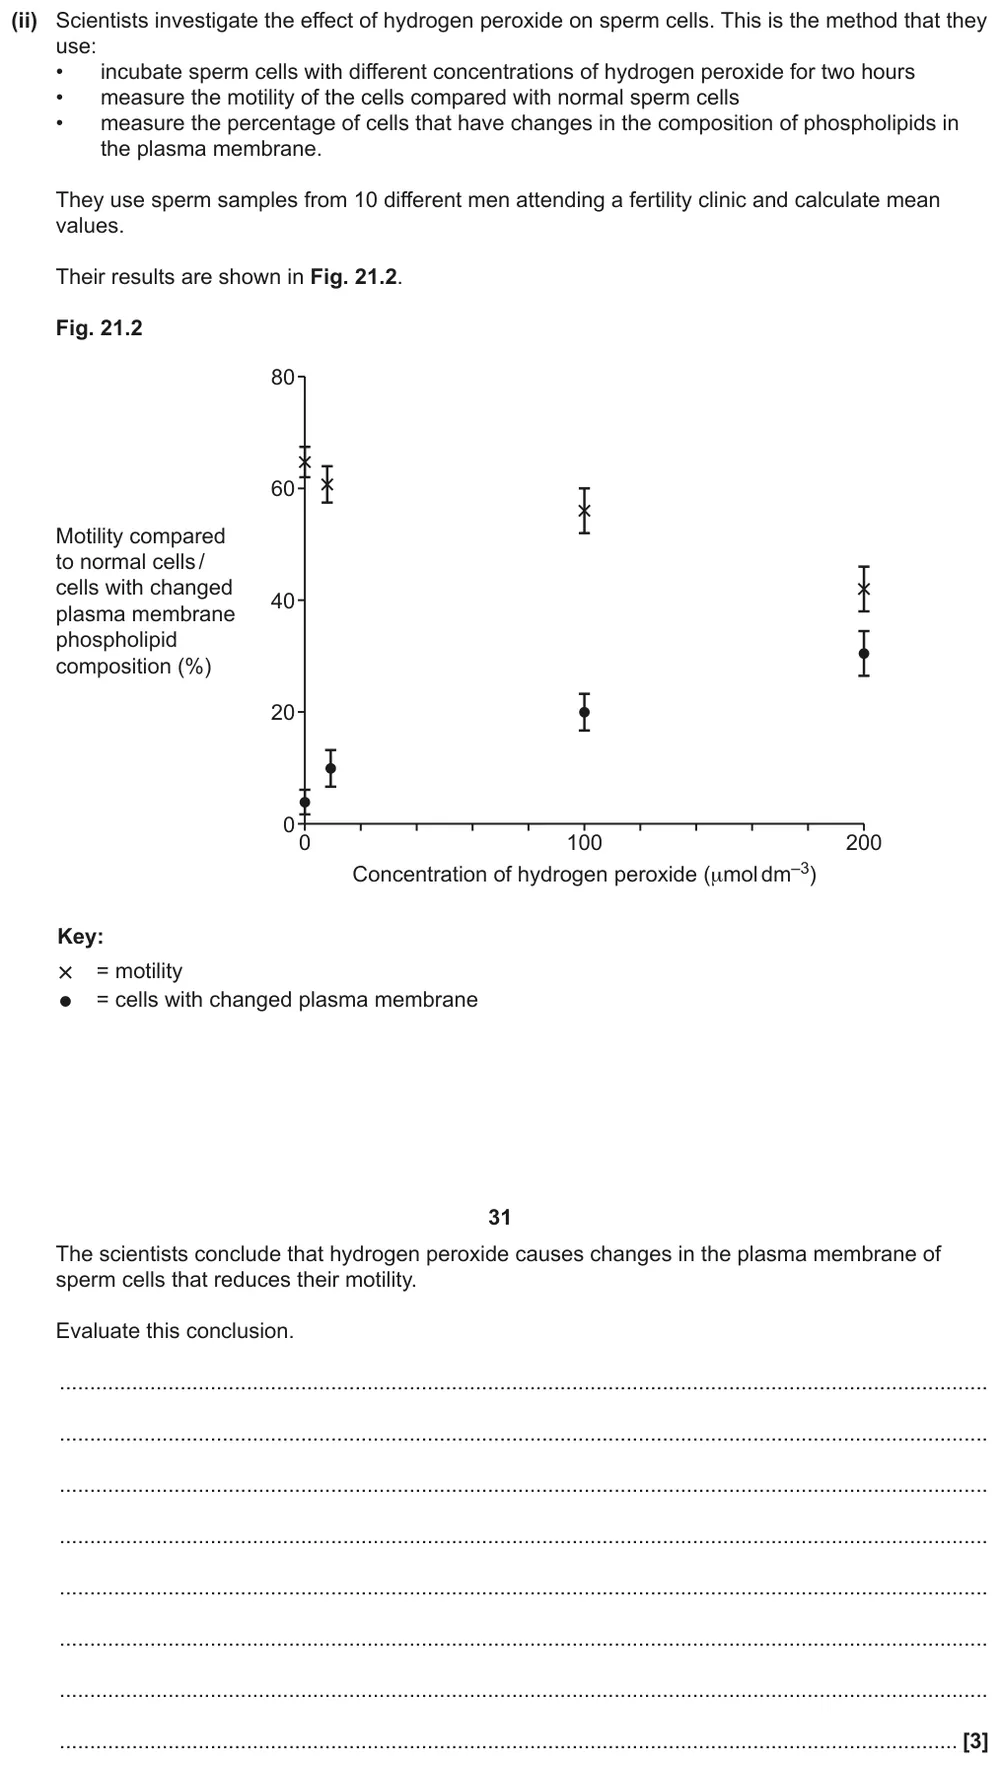
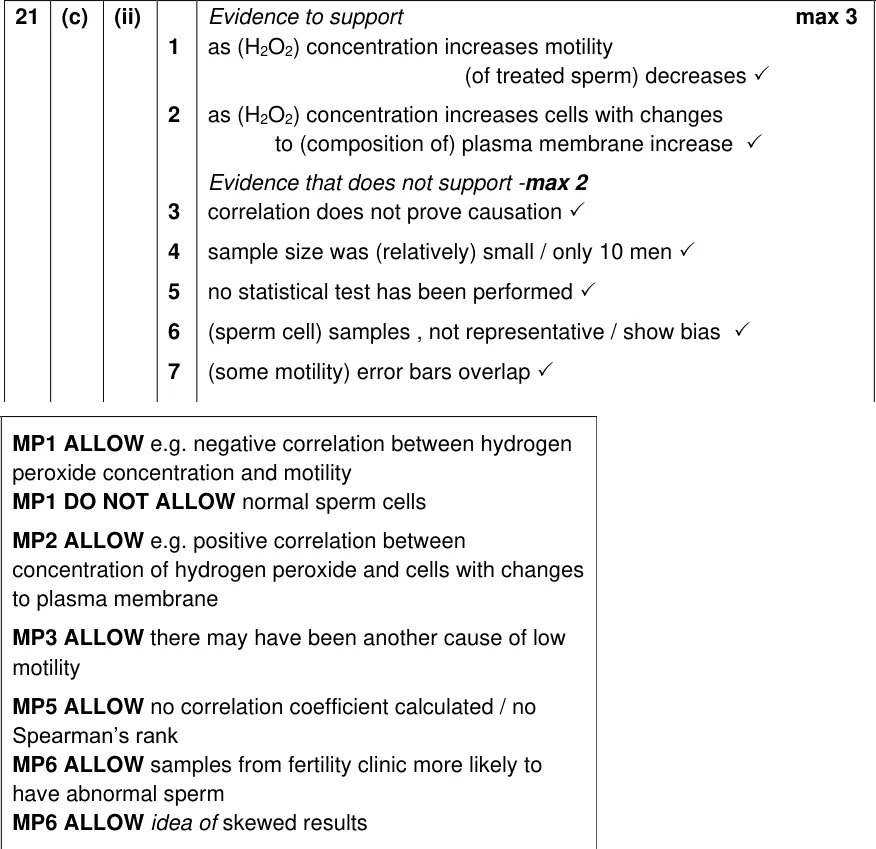
A level Paper 1 · June 2024 · Q21(c)(ii) · 3 marks · Medium
Evaluate a conclusion that hydrogen peroxide changes sperm cell membranes and so reduces motility.
Show the mark scheme
Tap an image to open it full size.
From the examiners' report: Strong answers gave supporting points and then points against. A correlation between two variables doesn't show that one causes the other, so say so, and read the axis labels and key carefully before you describe the trends.
Question 11
AS Paper 2 · June 2018 · Q5(a)(ii) · 2 marks · Hard
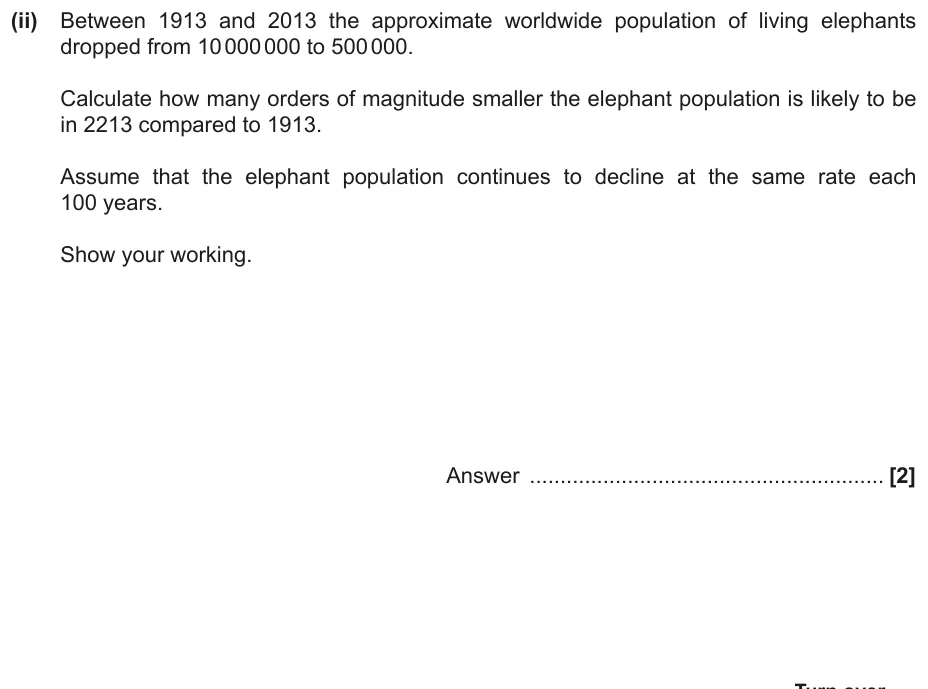
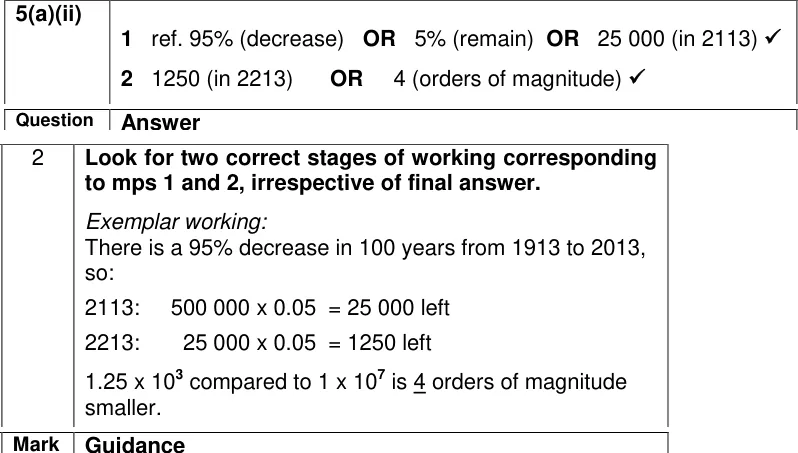
Calculate how many orders of magnitude smaller the elephant population will be in 2213 than in 1913.
Show the mark scheme
Tap an image to open it full size.
From the examiners' report: Only the strongest students reached 4. Write the numbers in standard form (1 × 10⁷ and 5 × 10⁵), apply the same 5% that remains each century, then compare the powers of ten.
Choosing and using a statistical test (M1.9)
Question 12
A level Paper 3 · June 2019 · Q3(c)(iv) · 2 marks · Easy
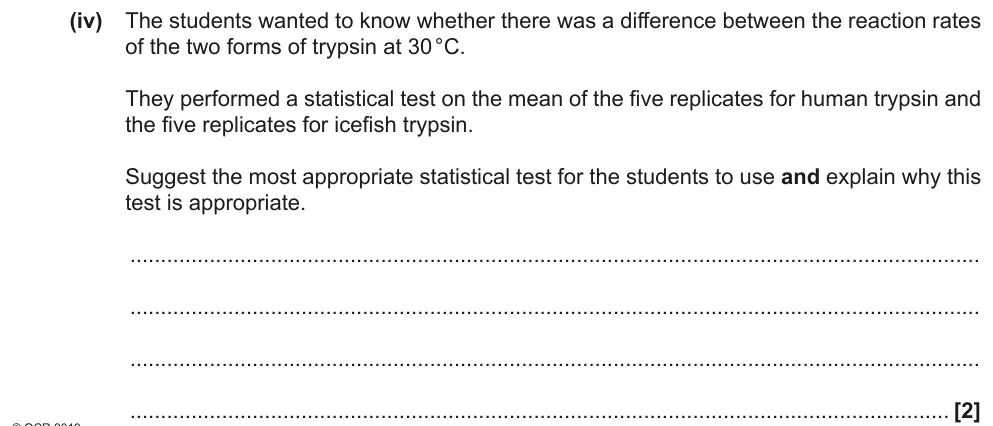
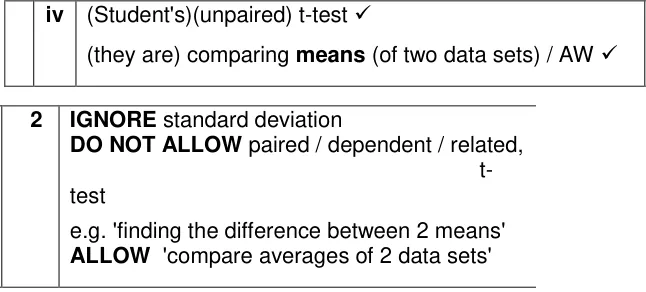
Choose a statistical test to compare the reaction rates of human and icefish trypsin and explain why.
Show the mark scheme
Tap an image to open it full size.
From the examiners' report: Most students named the t-test but lost the second mark by writing 'two data sets'. Say it compares two means. Chi squared, standard deviation and Spearman's rank were the usual wrong answers.
Question 13
A level Paper 2 · June 2024 · Q20(a)(i) · 3 marks · Medium
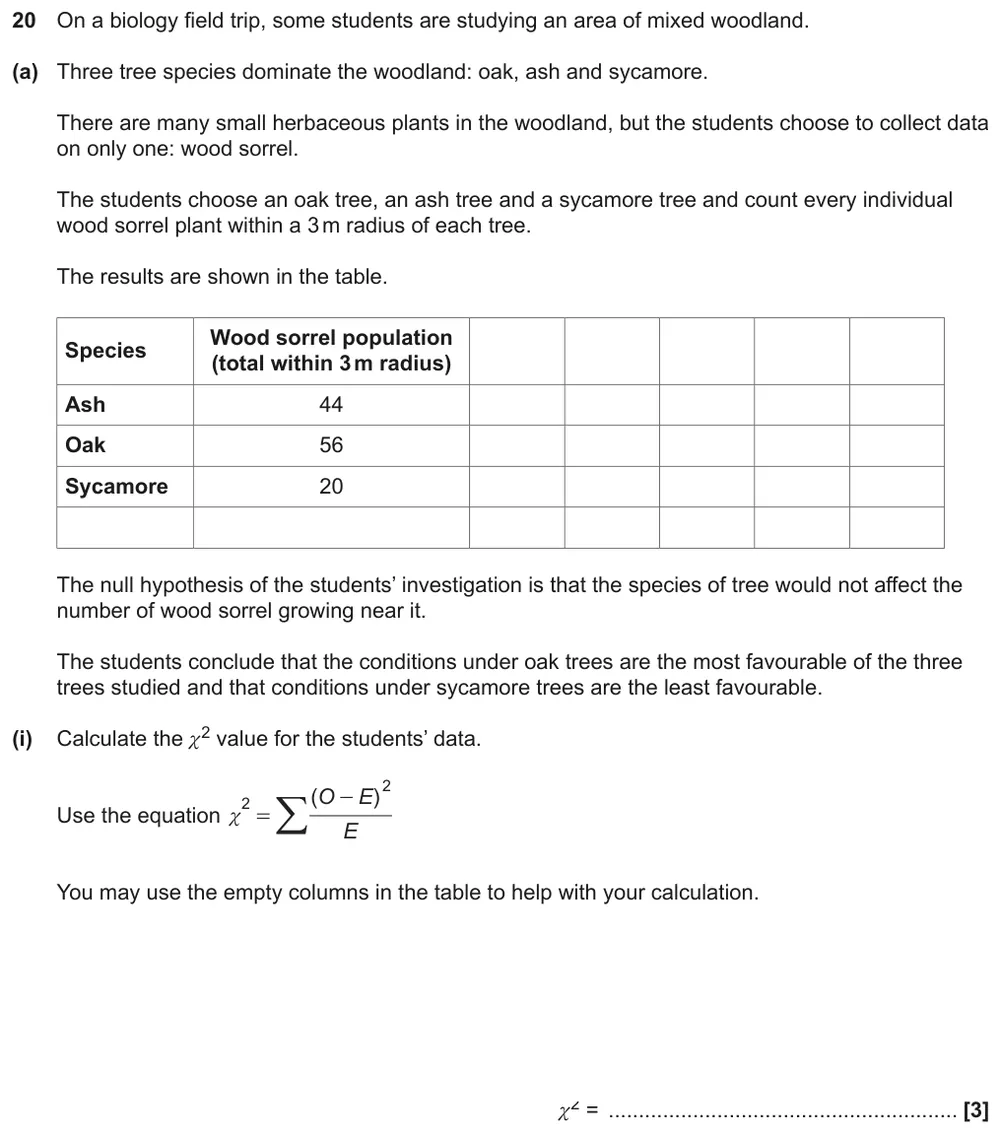
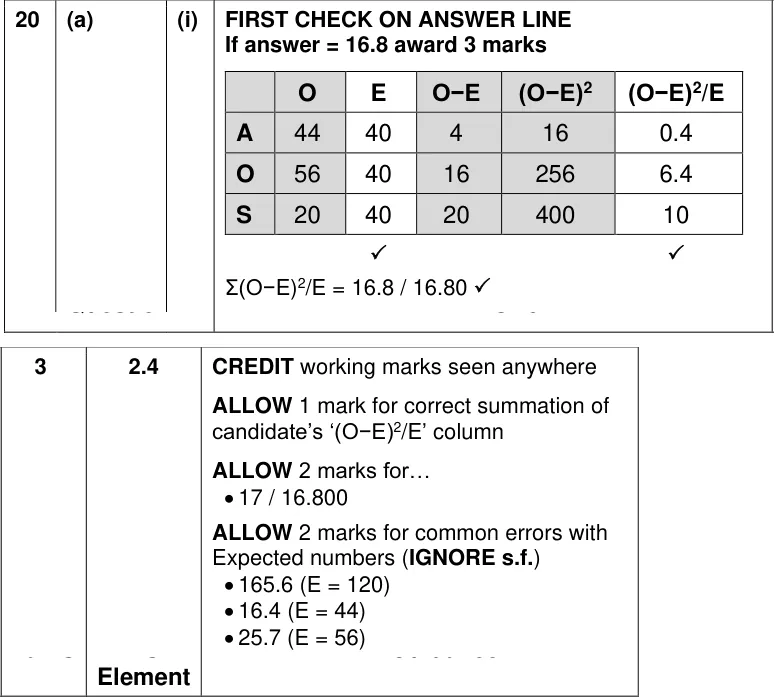
Calculate chi squared for the number of wood sorrel plants near ash, oak and sycamore trees.
Show the mark scheme
Tap an image to open it full size.
From the examiners' report: About half of students got all three marks. The most common error was the expected values: under the null hypothesis the 120 plants are shared equally, so E = 40 for each tree.
Question 14
A level Paper 2 · June 2024 · Q20(a)(ii) · 3 marks · Medium
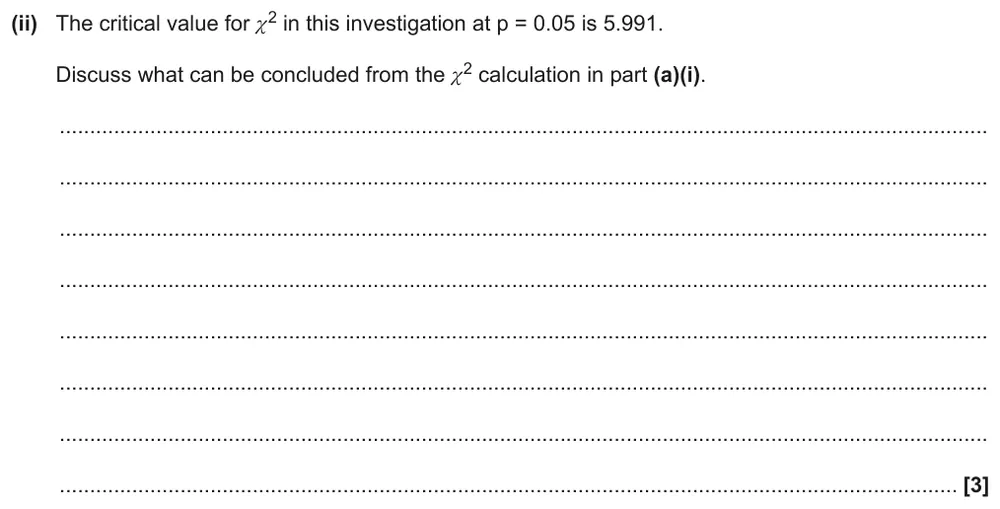
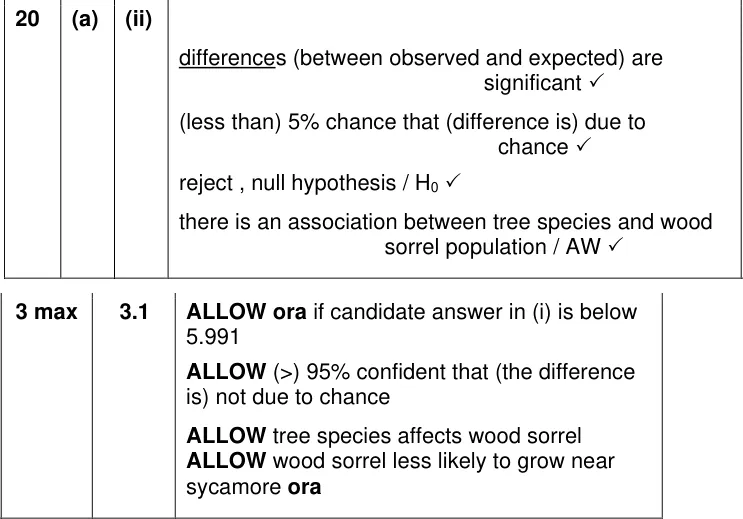
Use the critical value of 5.991 to discuss what the chi squared result shows.
Show the mark scheme
Tap an image to open it full size.
From the examiners' report: This went better than in earlier years. It is the difference between observed and expected that is significant, not the 'results' or the 'data'. If your value in (i) was wrong you could still score full marks here.
Question 15
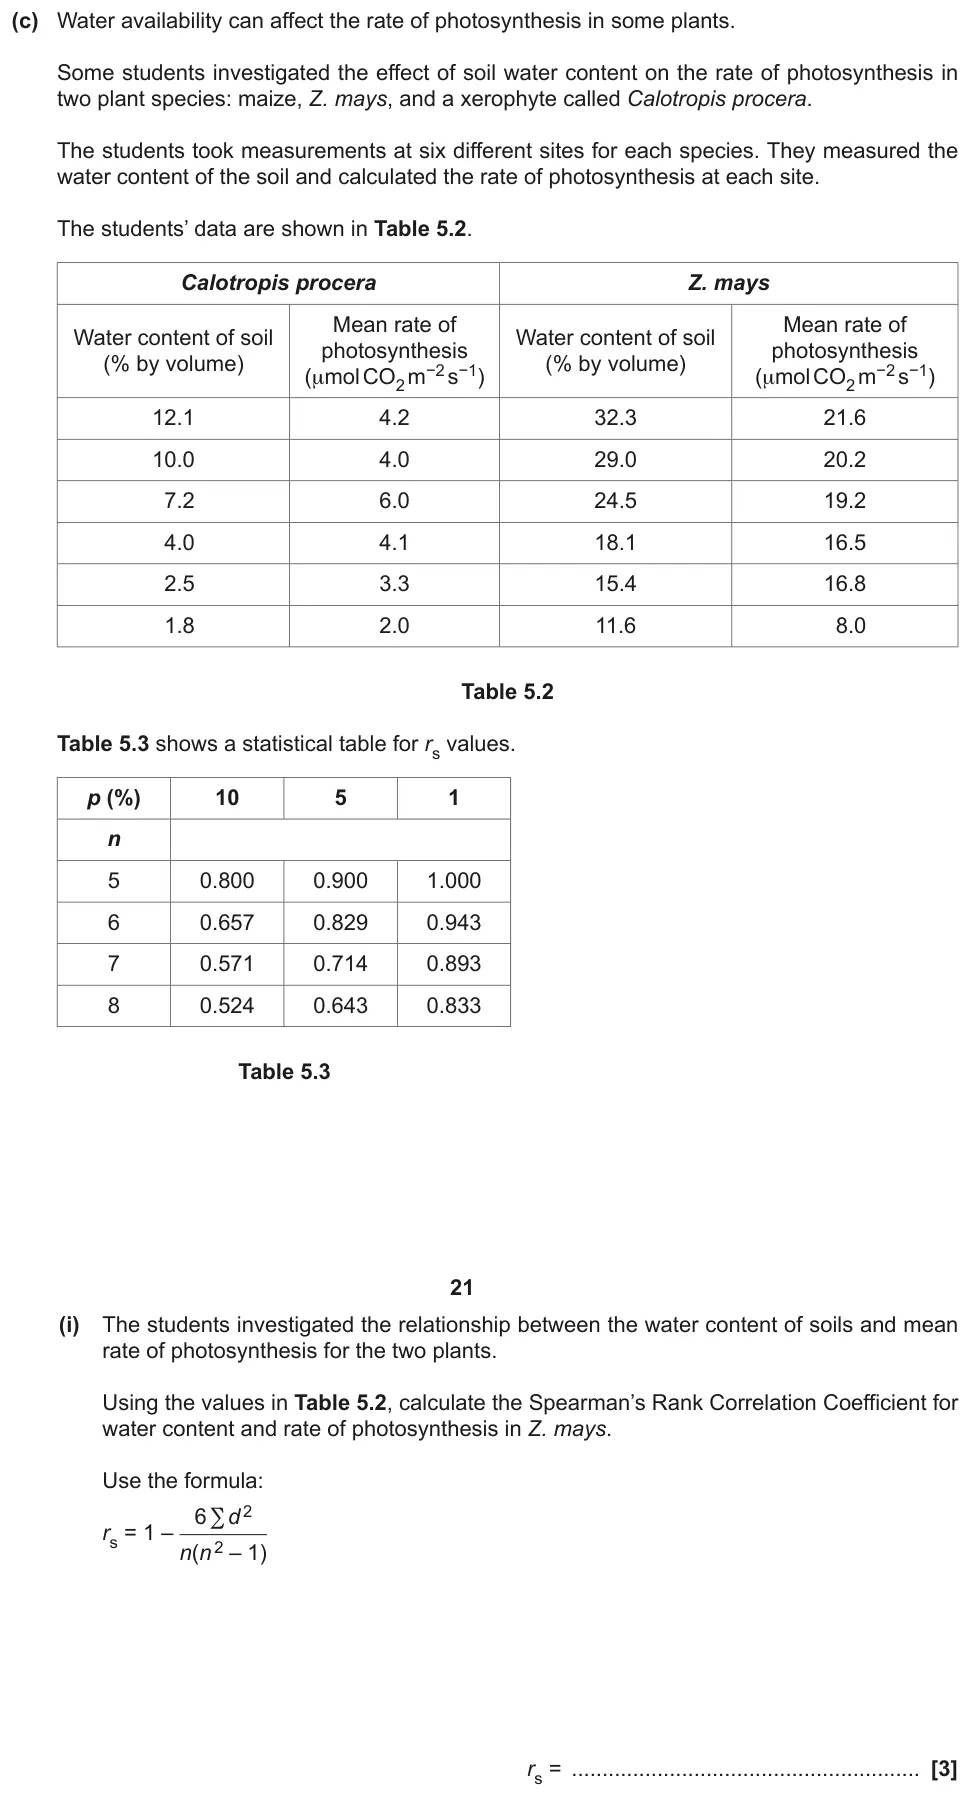
A level Paper 3 · November 2021 · Q5(c)(i) · 3 marks · Hard
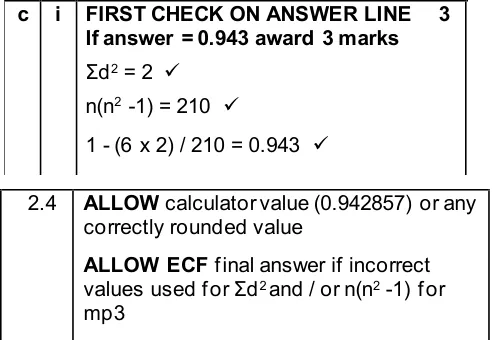
Calculate Spearman's rank correlation coefficient for soil water content and photosynthesis in maize.
Show the mark scheme
Tap an image to open it full size.
From the examiners' report: Few students got all three marks. Rank each variable separately, find d for each site and square it, and use n = 6. Then compare your value with the table: 0.943 shows a significant positive correlation.
Standard deviation and range (M1.10)
Question 16
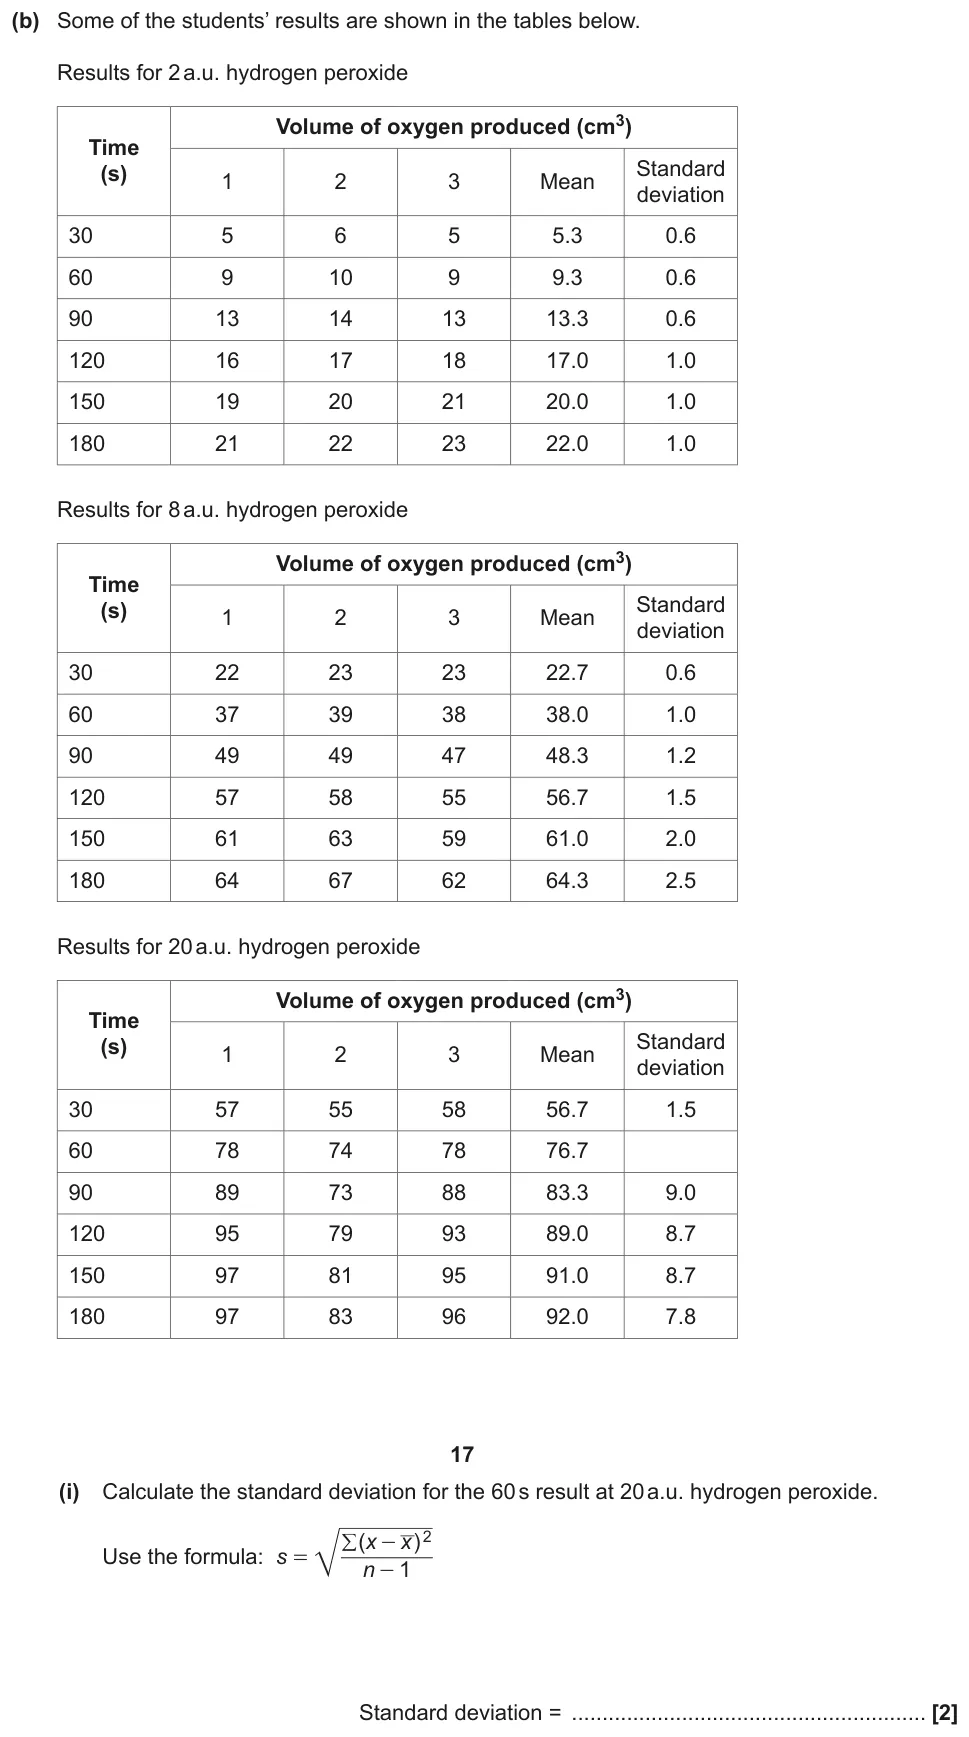
A level Paper 2 · June 2023 · Q17(b)(i) · 2 marks · Easy
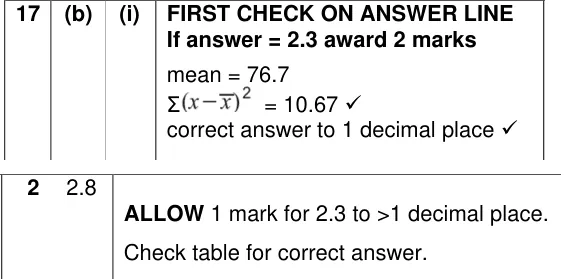
Calculate a standard deviation from three repeat readings, to match the table.
Show the mark scheme
Tap an image to open it full size.
From the examiners' report: Most students got both marks. One mark was lost for 2.31: the other standard deviations in the table are to 1 decimal place, so yours should be too.
Question 17
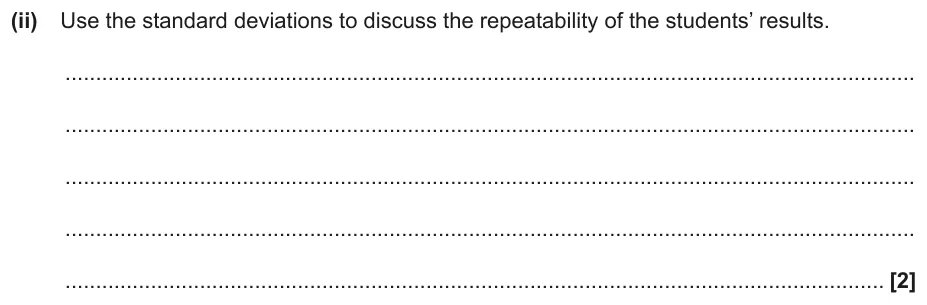
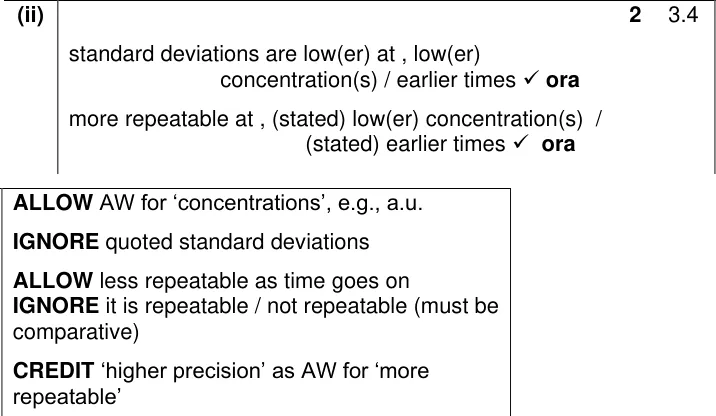
A level Paper 2 · June 2023 · Q17(b)(ii) · 2 marks · Medium
Use the standard deviations to discuss how repeatable the results are.
Show the mark scheme
Tap an image to open it full size.
From the examiners' report: Only about a third got both marks. Use the word 'repeatable' and make it comparative: more repeatable at low concentrations and early times, where the standard deviations are smaller. Just defining the terms scored nothing.
Question 18
AS Paper 1 · November 2020 · Q24(b) · 2 marks · Medium
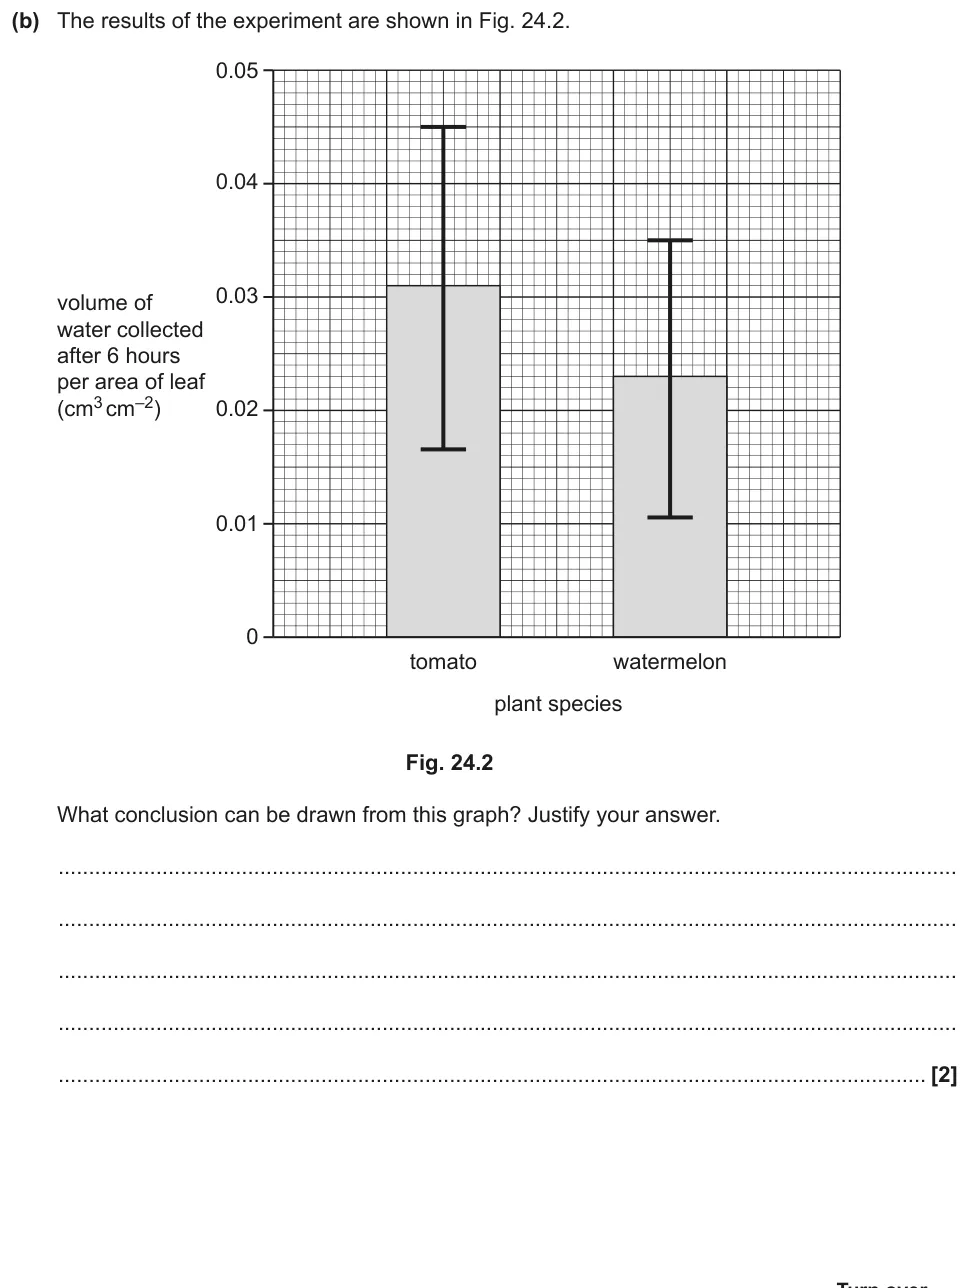
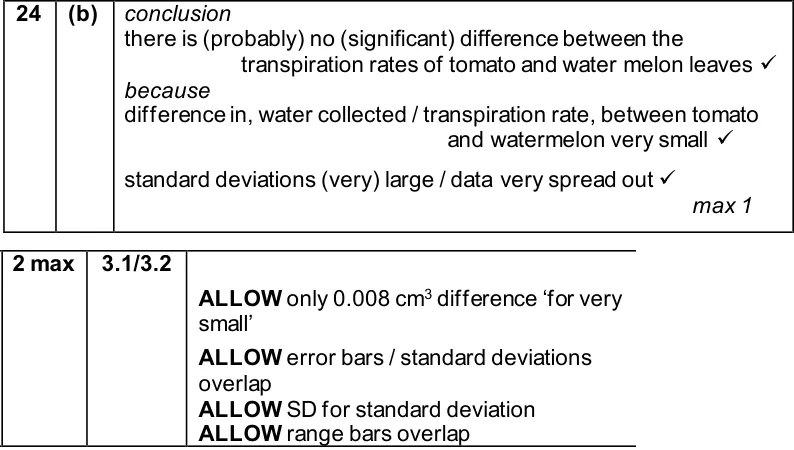
Draw a conclusion from a bar chart of water loss from tomato and watermelon leaves with standard deviation error bars.
Show the mark scheme
Tap an image to open it full size.
From the examiners' report: Many students ignored how small the difference between the means was and how much the error bars overlapped. When the standard deviations are large compared with the difference, conclude that there is probably no significant difference.
Uncertainty in measurements (M1.11)
Question 19
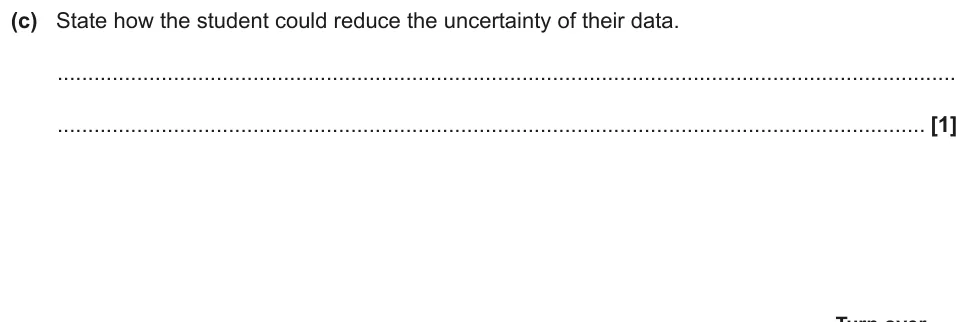
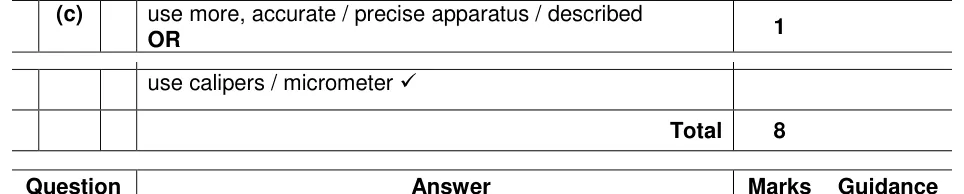
AS Paper 1 · June 2019 · Q21(c) · 1 mark · Medium
State how a student could reduce the uncertainty of their measurements.
Show the mark scheme
Tap an image to open it full size.
From the examiners' report: Many students didn't know what uncertainty means. Repeating and taking a mean earned no credit: uncertainty depends on the measuring instrument, so use one with a higher resolution.
Question 20
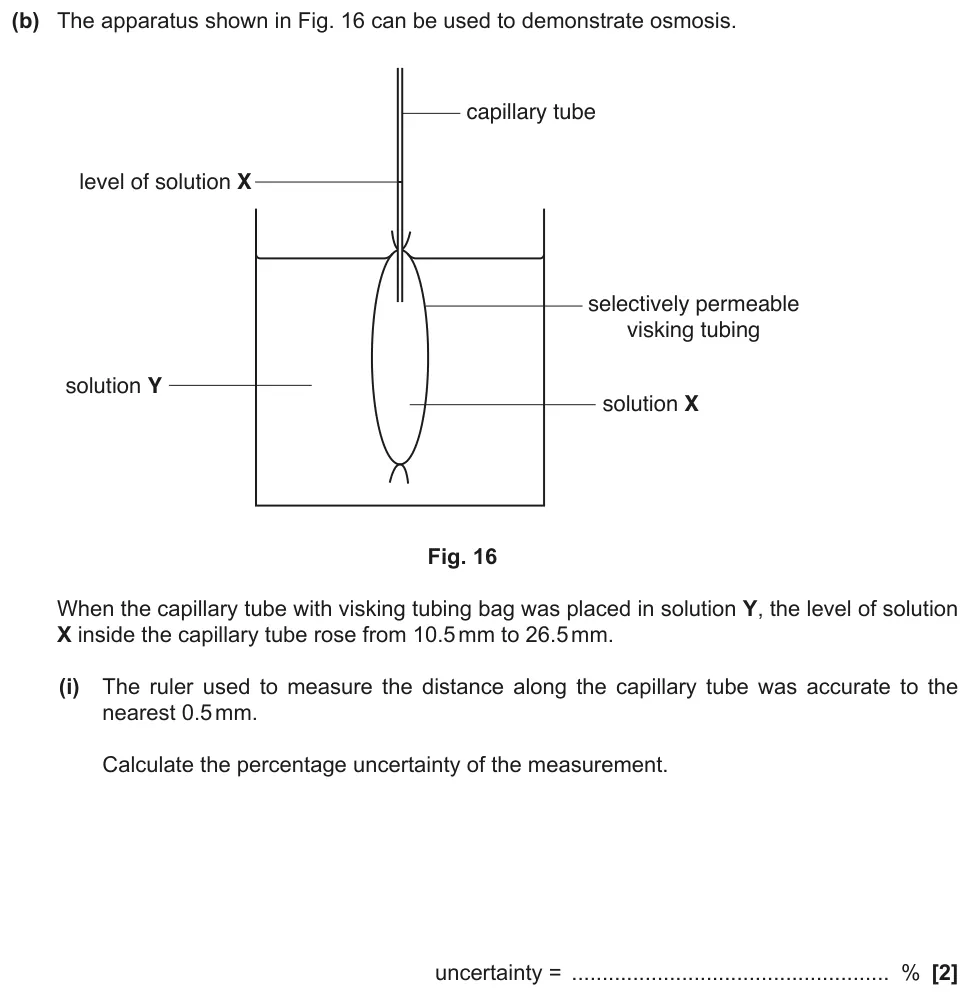
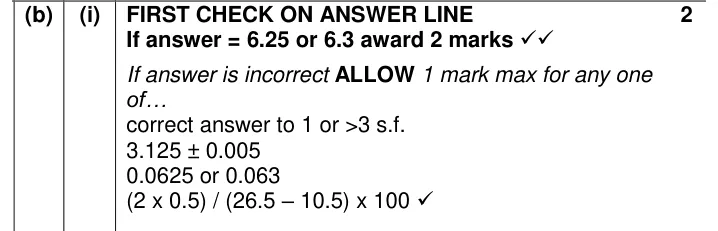
A level Paper 2 · June 2019 · Q16(b)(i) · 2 marks · Hard
Calculate the percentage uncertainty in a distance measured with a ruler read to 0.5 mm.
Show the mark scheme
Tap an image to open it full size.
From the examiners' report: Only a few students got both marks. The distance comes from two readings, so the uncertainty is 2 × 0.5 mm, divided by the 16 mm change. Many used only one reading's uncertainty, or gave too many significant figures.
Where students lose marks (from OCR examiners' reports and mark schemes)
Each point below is followed by wording that gained marks.
Round up from 0.66: A mean of 31.66 was often written as 31.6, or as 31.6 with a recurring dot, which is not 1 decimal place. Answers with too many figures, such as a standard deviation of 2.31 in a table of 1 decimal place values, also lost a mark.
✔ Gains credit: "mean = 31.7" and "correct answer to 1 decimal place": 2.3.
Divide by the original value: In a percentage change, dividing the difference by the final value instead of the starting value gave 16% instead of 19%.
✔ Gains credit: "percentage change = [2.6 ÷ 13.9] × 100 ... 19 (%) to 2 sig. figs."
Whole children only: Using a 1 in 4 probability for six children, many students wrote 1.5 children with the syndrome.
✔ Gains credit: "syndrome 1 or 2 and carriers 3" ("DO NOT ALLOW 1.5").
Histogram bars touch: For continuous data, students drew bar charts with gaps or used a category scale on the x axis, and very few made the wider 600–800 mm class twice as wide.
✔ Gains credit: "histogram plotted with ruled lines and touching bars" and "6th bar twice the width and height 23".
A t-test compares means: Most students named the t-test but justified it with 'two data sets', which was too vague, and some chose a paired t-test.
✔ Gains credit: "(Student's)(unpaired) t-test" because "(they are) comparing means (of two data sets)".
It's the difference that is significant: Answers said the 'results' or 'data' were significant, or got the expected values wrong before they started.
✔ Gains credit: "differences (between observed and expected) are significant", "(less than) 5% chance that (difference is) due to chance", "reject null hypothesis".
Overlapping error bars mean caution: Students claimed one plant lost more water than the other, ignoring the small difference between the means and the large overlap of the standard deviation error bars.
✔ Gains credit: "there is (probably) no (significant) difference" because the difference is "very small" and the "standard deviations (very) large / data very spread out".
Two readings, double the uncertainty: For a distance worked out from two ruler readings, most students used the uncertainty of one reading only. Others said repeats and a mean would reduce uncertainty, which gained nothing.
✔ Gains credit: "(2 × 0.5) / (26.5 – 10.5) × 100" = 6.25%, and "use more, accurate / precise apparatus".
Download the questions
Download the PDF pack (20 questions, mark schemes at the end)
Keep practising
- Graph skills: OCR A Level Biology exam questions by topic
- Arithmetic and numerical computation: OCR A Level Biology exam questions by topic
- OCR A Level Biology practical skills quiz
- OCR A Level Biology biodiversity quiz
- OCR A Level Biology masterclasses
Questions, mark schemes and examiners' report extracts © OCR.