

OCR A M2 · 16 questions · mark schemes and examiners’ tips included
Algebra in A Level Biology isn't about long proofs. It's about using the handful of equations that keep coming up: magnification, ventilation rate, Simpson's Index of Diversity, the Lincoln index and the Hardy–Weinberg equations. These are the M2 maths skills in the specification: changing the subject of an equation, substituting values with the right units, solving an equation, and using logarithms when numbers range over several orders of magnitude.
The examiners' reports show that students rarely lose these marks because they don't know the equation. They lose them because they rearrange it the wrong way round, forget to convert dm³ to cm³ or mm to µm, round too early, or treat q² as if it were q. Showing every step of your working matters too, because a correct method often earns a mark even when the final answer is wrong.
Work through the sixteen questions below with a calculator. They are grouped by skill, starting with rearranging equations, then substituting into formulae, solving Hardy–Weinberg problems and finally logarithms. If you'd like to go through questions like these with me each week, my OCR A masterclasses run on Wednesdays at 5.15pm for Year 12 and on Tuesdays at 6.30pm or Thursdays at 5.15pm for Year 13.
What these questions cover (OCR maths skills M2: algebra)
The questions test these mathematical skills from the OCR A Level Biology A specification (H420):
- M2.2 Change the subject of an equation
- M2.3 Substitute numerical values into algebraic equations using appropriate units
- M2.4 Solve algebraic equations
- M2.5 Use logarithms in relation to quantities that range over several orders of magnitude
How to use this page
Write your answer on paper before you open the mark scheme. Allow about 1.2 minutes per mark: the 16 questions are worth 31 marks, so about 37 minutes in total. Then mark your answer strictly against the mark scheme and read the examiners' tip underneath it. If you'd rather print the questions, download the PDF pack.
Changing the subject of an equation (M2.2)
Question 1
A level Paper 3 · June 2019 · Q1(a)(ii) · 2 marks · Easy
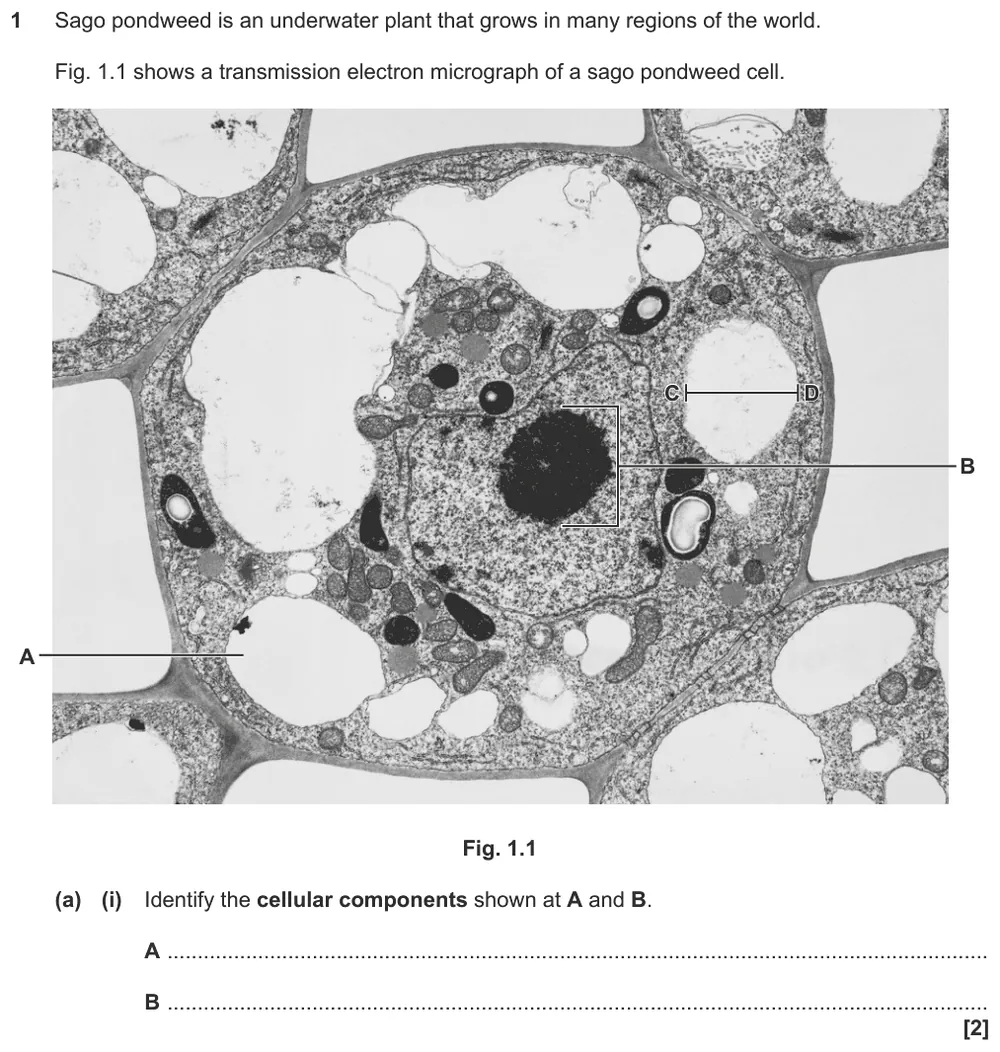
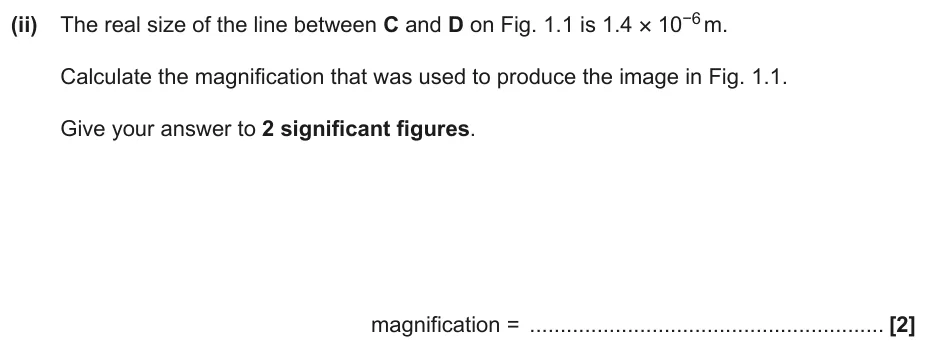
Calculate the magnification of an electron micrograph from a real size given in metres, to 2 significant figures.
Information from earlier in this question:
Show the mark scheme

Tap an image to open it full size.
From the examiners' report: Most students calculated the magnification correctly. The mark that was lost was for not rounding to 2 significant figures, so always check the answer line for how many figures you need.
Question 2
AS Paper 2 · June 2022 · Q4(a)(ii) · 2 marks · Medium
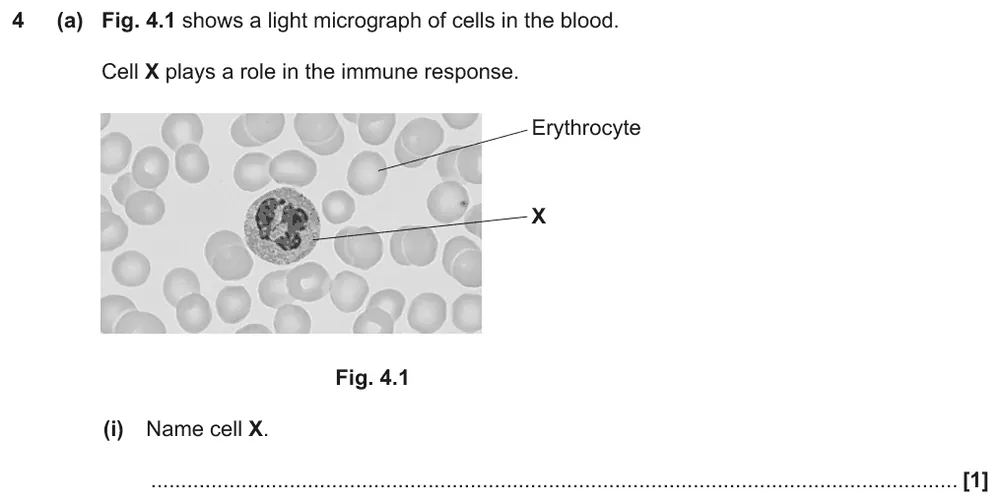
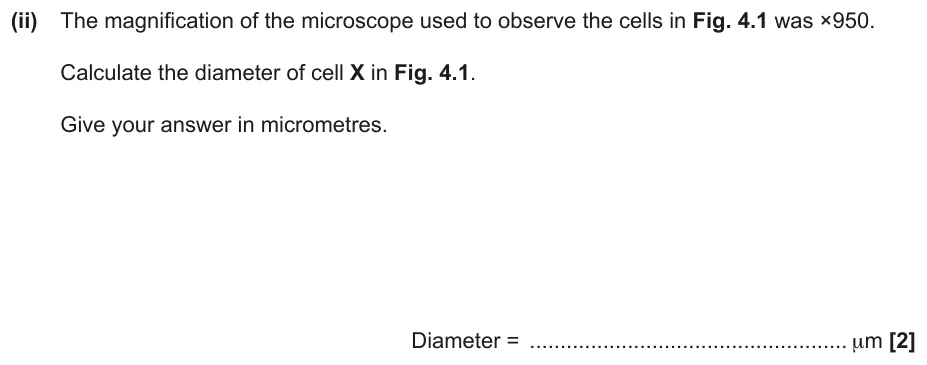
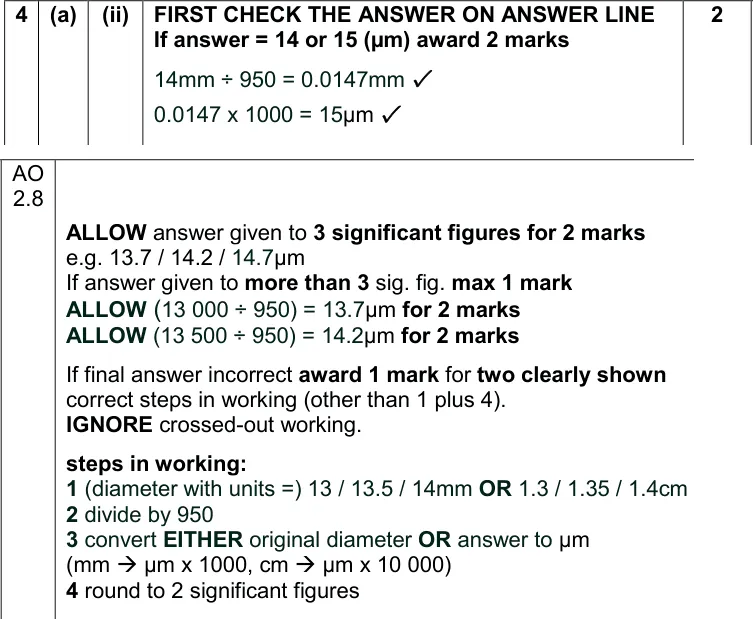
Rearrange the magnification equation to find the real diameter of a blood cell in micrometres.
Information from earlier in this question:
Show the mark scheme
Tap an image to open it full size.
From the examiners' report: Most students knew the equation, but not all could rearrange it to actual size = image size ÷ magnification. Many answers were out by a factor of 10 because they measured in centimetres and then multiplied by 1000, not 10 000, to get micrometres.
Question 3
A level Paper 3 · November 2021 · Q1(c)(i) · 1 mark · Medium
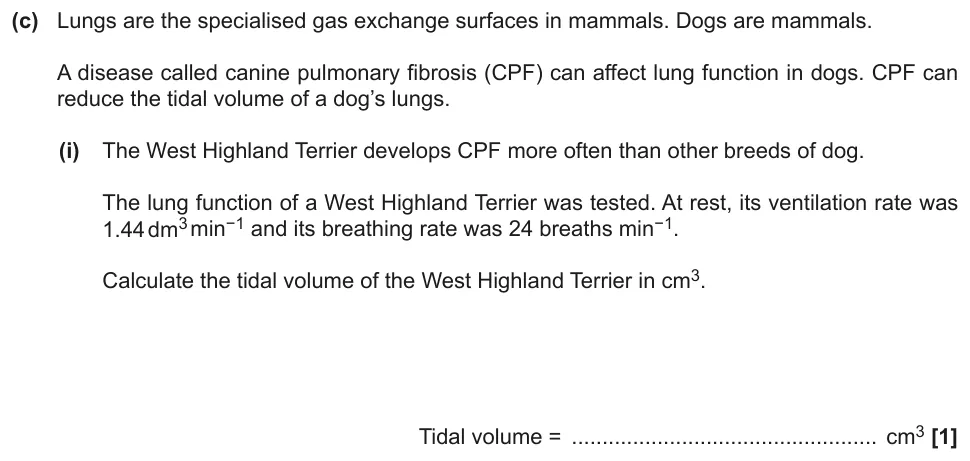
Calculate a dog's tidal volume in cm³ from its ventilation rate and breathing rate.
Show the mark scheme
Tap an image to open it full size.
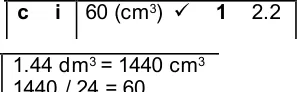
From the examiners' report: Students who got this wrong usually didn't know how tidal volume, breathing rate and ventilation rate are linked, or slipped when converting dm³ to cm³. Learn ventilation rate = tidal volume × breathing rate, then rearrange it.
Question 4
AS Paper 2 · June 2025 · Q6(a)(i) · 2 marks · Hard
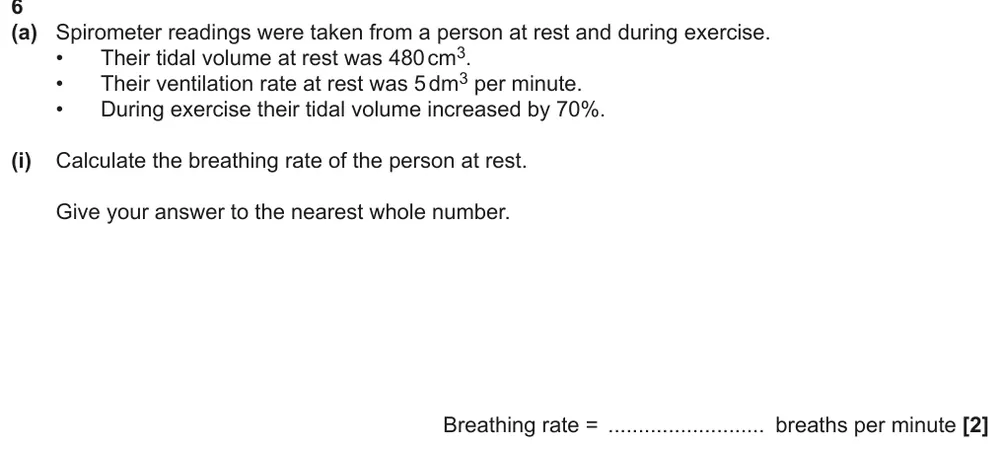
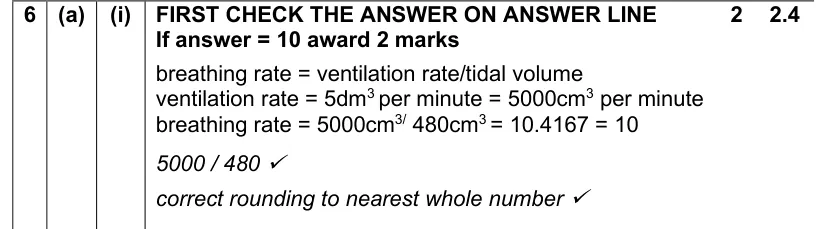
Calculate breathing rate from tidal volume and ventilation rate given in different units.
Show the mark scheme
Tap an image to open it full size.
From the examiners' report: The most common wrong answer was 96, from 480 ÷ 5, which divides the wrong way round and mixes units. Convert 5 dm³ to 5000 cm³, divide ventilation rate by tidal volume, and round to the nearest whole number as asked.
Substituting values into equations (M2.3)
Question 5
A level Paper 3 · June 2018 · Q5(b) · 2 marks · Easy
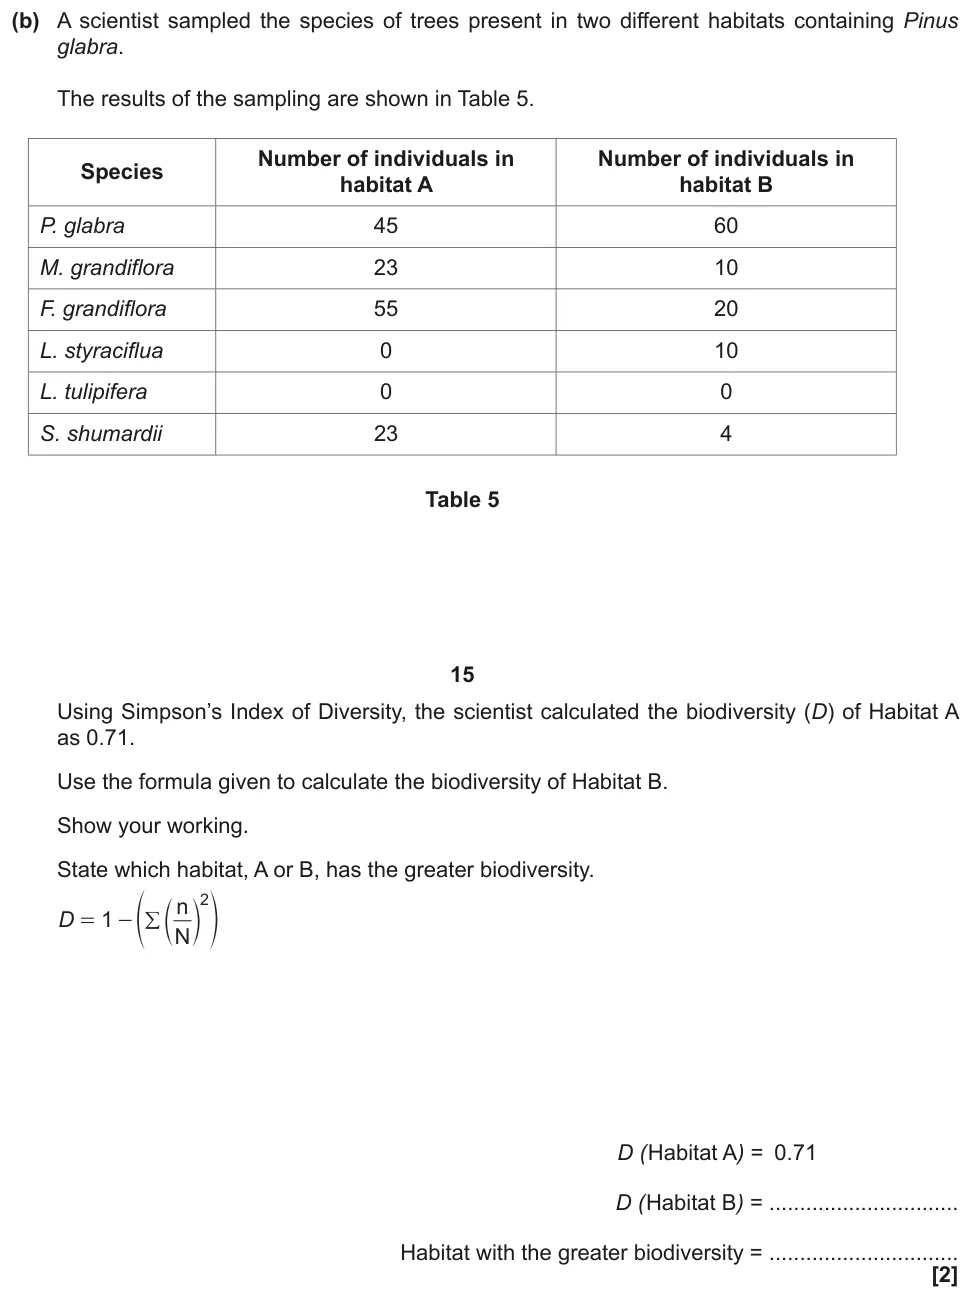
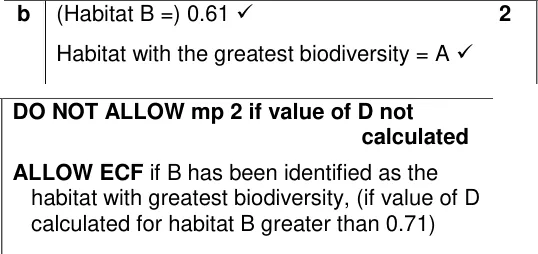
Calculate Simpson's Index of Diversity for a second habitat and say which habitat is more diverse.
Show the mark scheme
Tap an image to open it full size.
From the examiners' report: Most students got both marks. Students who showed clear working scored well; some forgot to subtract their sum from 1 at the end.
Question 6
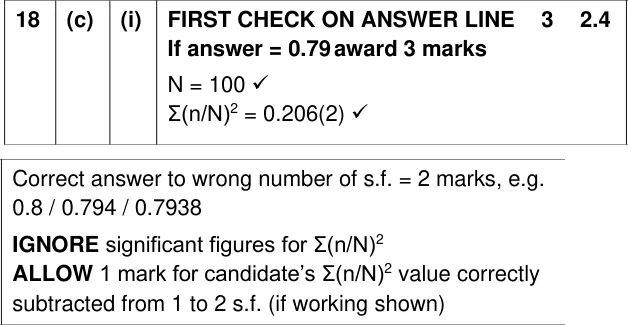
A level Paper 2 · June 2025 · Q18(c)(i) · 3 marks · Medium
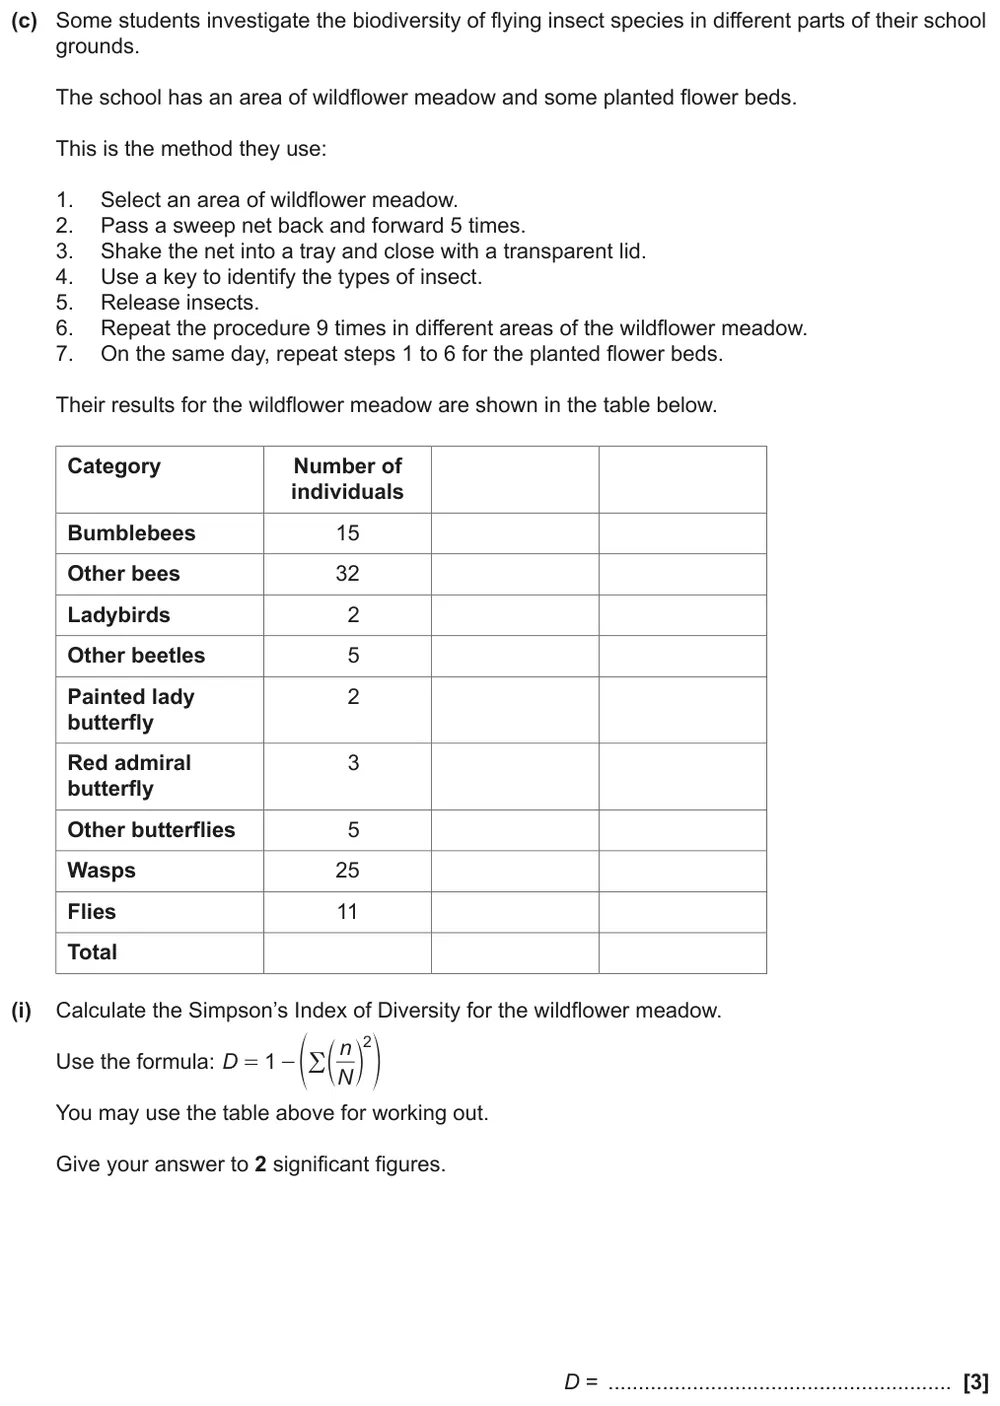
Calculate Simpson's Index of Diversity for insects in a wildflower meadow, to 2 significant figures.
Show the mark scheme
Tap an image to open it full size.
From the examiners' report: This was generally well answered, but students who didn't get full marks usually rounded the values in the middle of the calculation. Keep the full values in your calculator and only round at the end.
Question 7
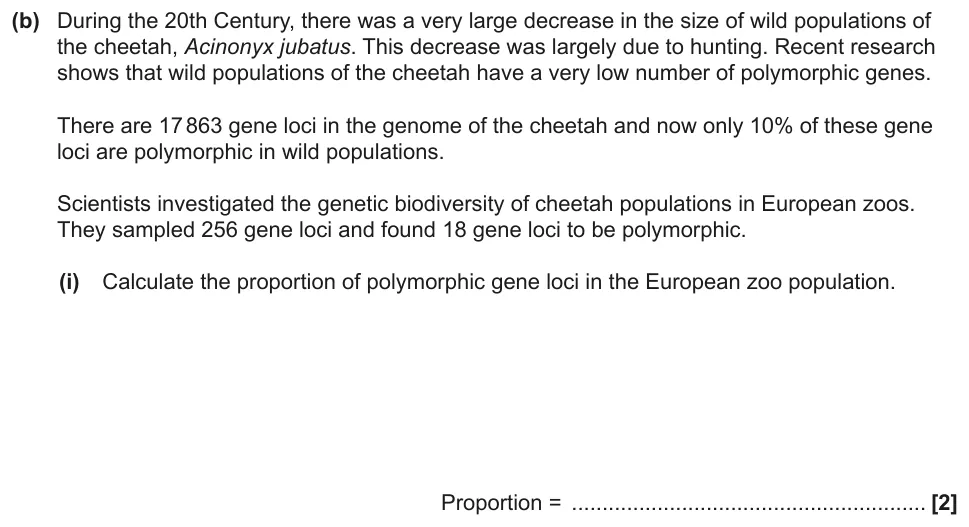
AS Paper 1 · June 2022 · Q22(b)(i) · 2 marks · Medium
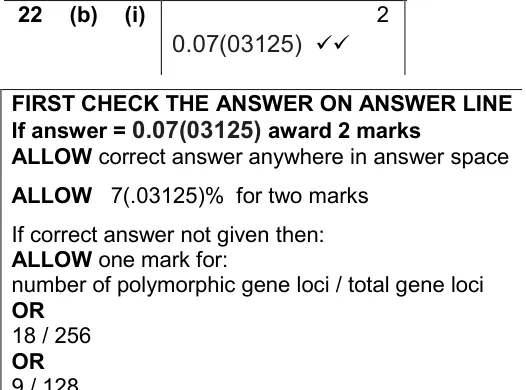
Calculate the proportion of polymorphic gene loci in a zoo population of cheetahs.
Show the mark scheme
Tap an image to open it full size.
From the examiners' report: Most students got this right, but too many didn't show their working, so a slip cost them both marks. Write the substitution down (18 ÷ 256) before you work it out.
Question 8
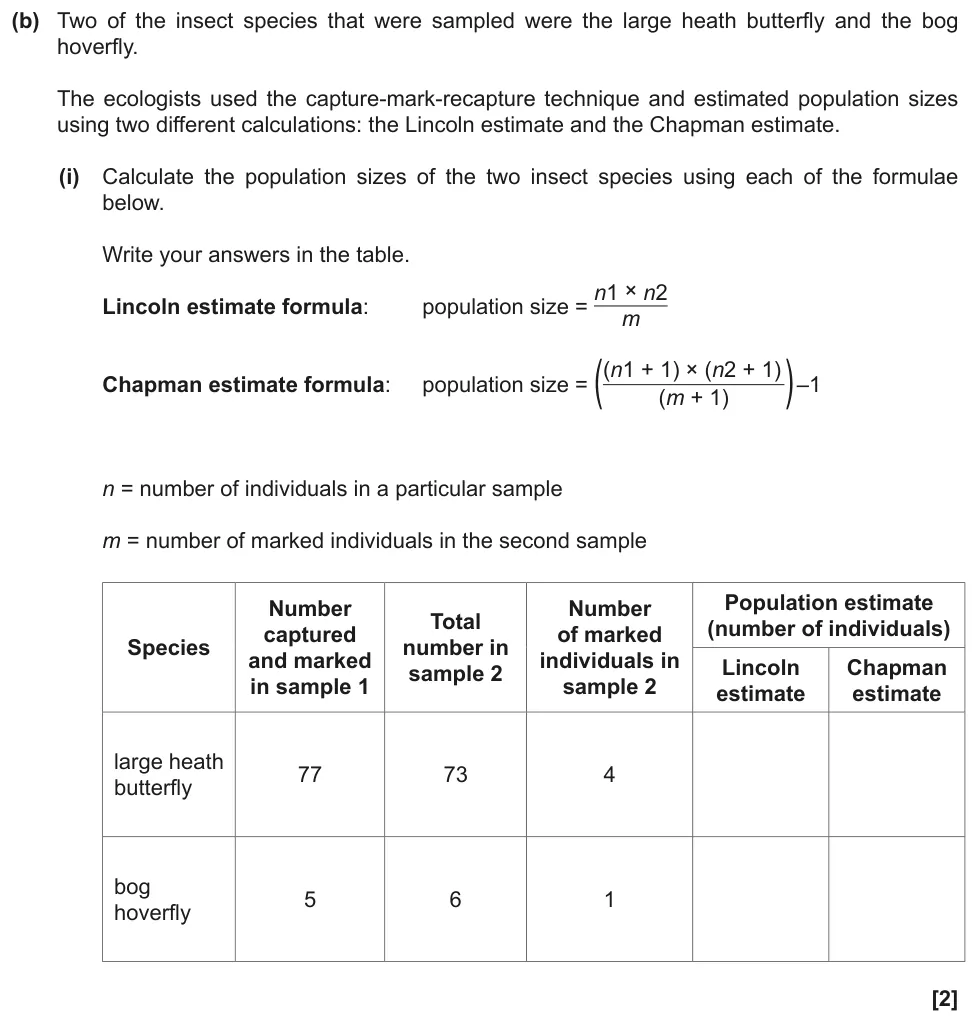
A level Paper 3 · November 2020 · Q5(b)(i) · 2 marks · Hard
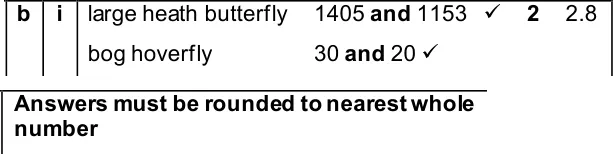
Use the Lincoln and Chapman formulae to estimate the populations of two insect species.
Show the mark scheme
Tap an image to open it full size.
From the examiners' report: The calculations were generally well done. The most common error was not giving the population sizes to the nearest whole number: you can't have part of an insect.
Solving equations: Hardy–Weinberg and more (M2.4)
Question 9
A level Paper 3 · June 2019 · Q5(a) · 2 marks · Easy
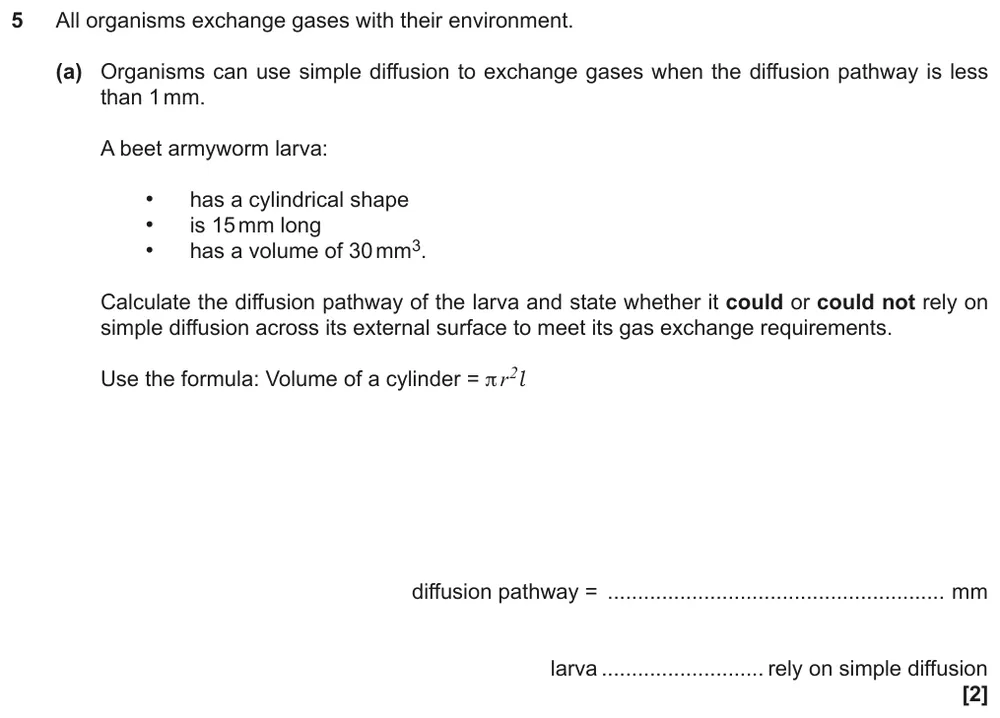
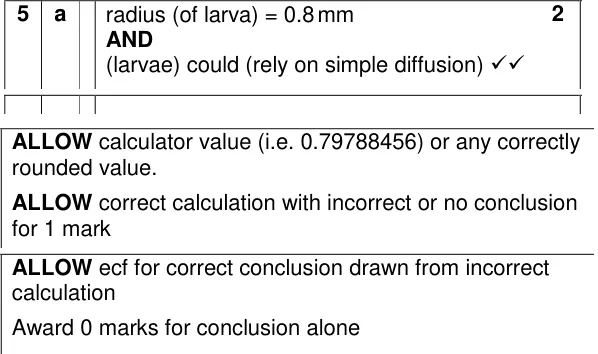
Solve the volume of a cylinder equation for a larva's radius and decide if it can rely on diffusion.
Show the mark scheme
Tap an image to open it full size.
From the examiners' report: Most students scored well. Even students who slipped in the calculation often got a mark for a conclusion that matched their value, so always finish by saying what your answer means.
Question 10
A level Paper 3 · June 2022 · Q5(c) · 2 marks · Medium
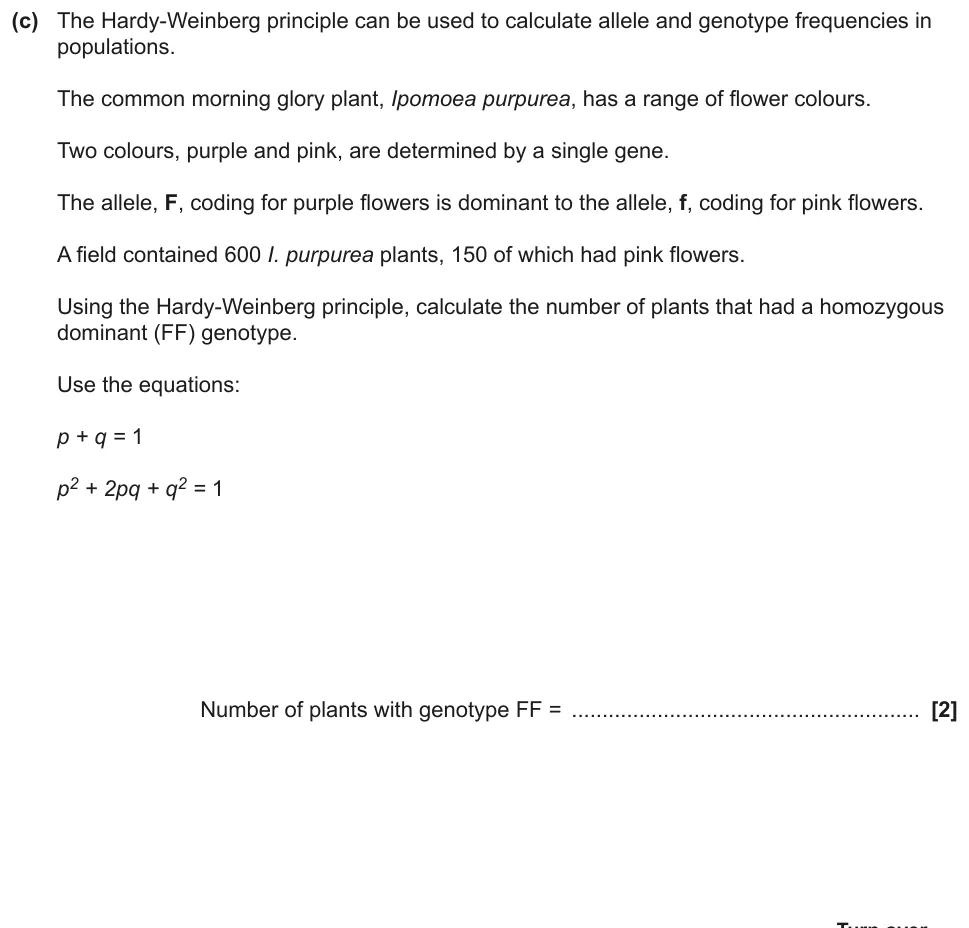
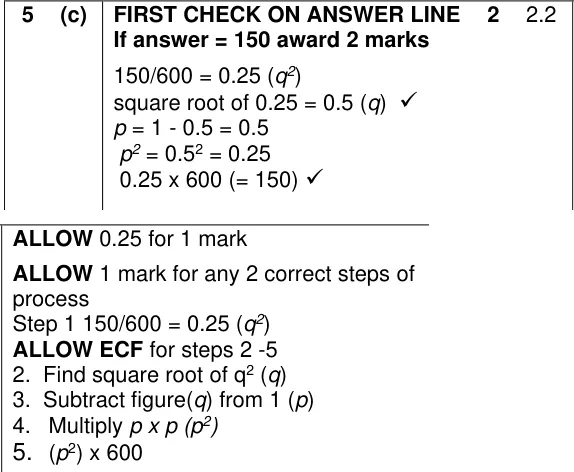
Use the Hardy–Weinberg equations to find the number of homozygous dominant plants.
Show the mark scheme
Tap an image to open it full size.
From the examiners' report: The most common error was taking 150/600 as q instead of q². The recessive phenotype gives you q², so take the square root before you find p.
Question 11
A level Paper 2 · June 2025 · Q20(b)(i) · 3 marks · Medium
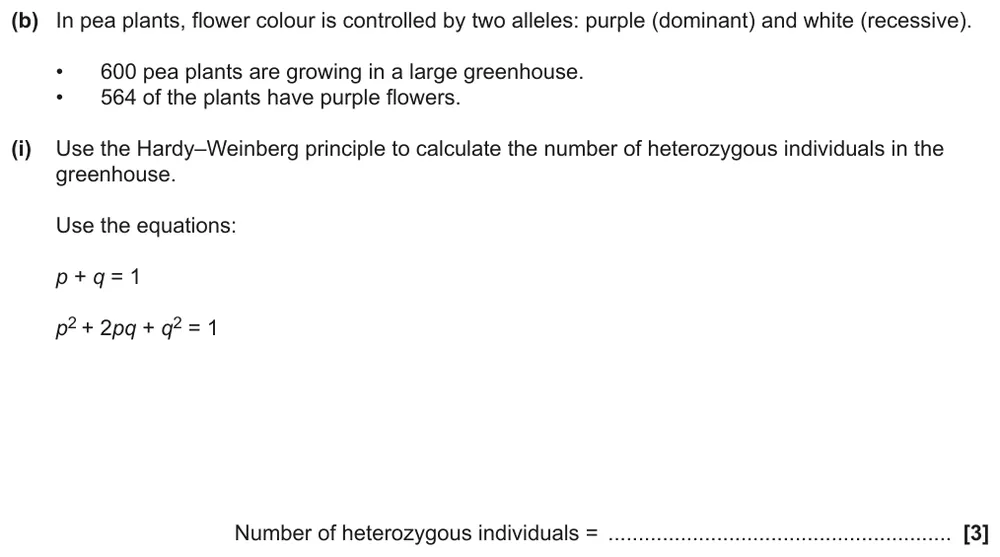
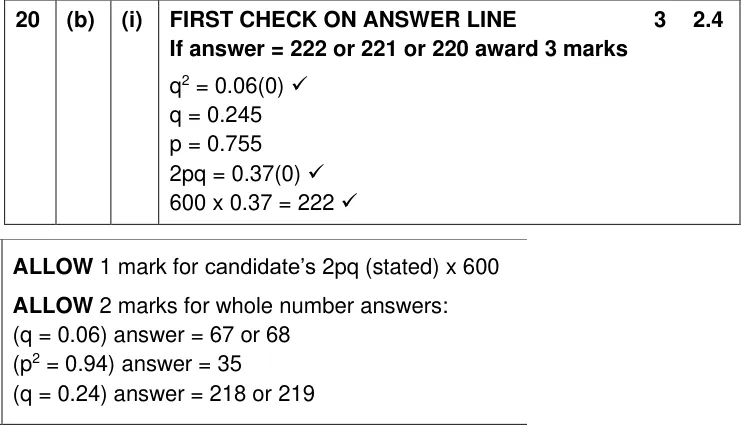
Use the Hardy–Weinberg equations to calculate the number of heterozygous pea plants.
Show the mark scheme
Tap an image to open it full size.
From the examiners' report: Many students scored nothing, often because their working was muddled. Always start by finding q² from the recessive (white) plants, 36 ÷ 600, then q, then p, then 2pq, and finally multiply by 600.
Logarithms and log scales (M2.5)
Question 12
A level Paper 1 · June 2023 · Q17(c)(iv) · 1 mark · Easy
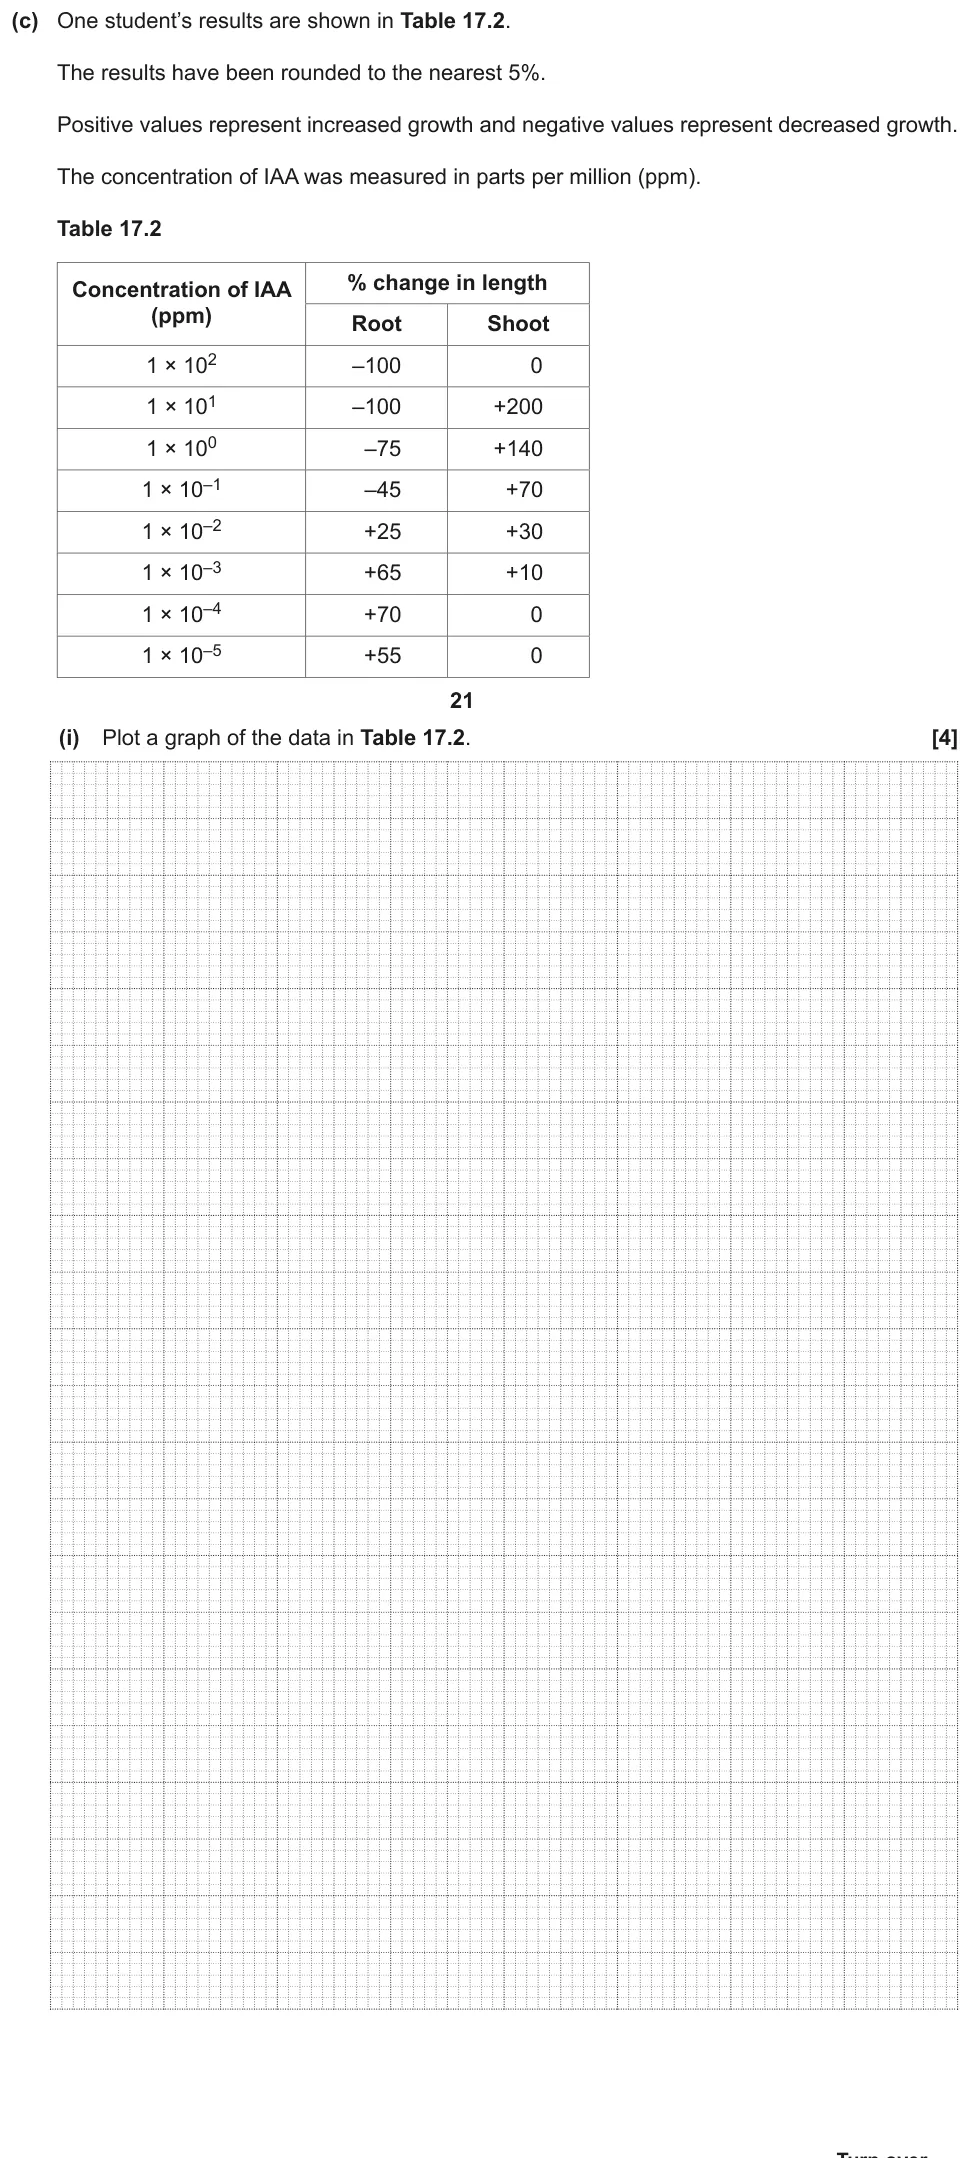
Suggest why a range of IAA concentrations could be described as logarithmic.
Information from earlier in this question:

Show the mark scheme

Tap an image to open it full size.
From the examiners' report: There is no specific examiners' comment for this part. The mark scheme wants the idea that each concentration is ten times the one before, a factor of 10; saying it 'changes by 10' sounds like adding 10 and doesn't score.
Question 13
A level Paper 1 · June 2017 · Q17(a)(i) · 2 marks · Medium
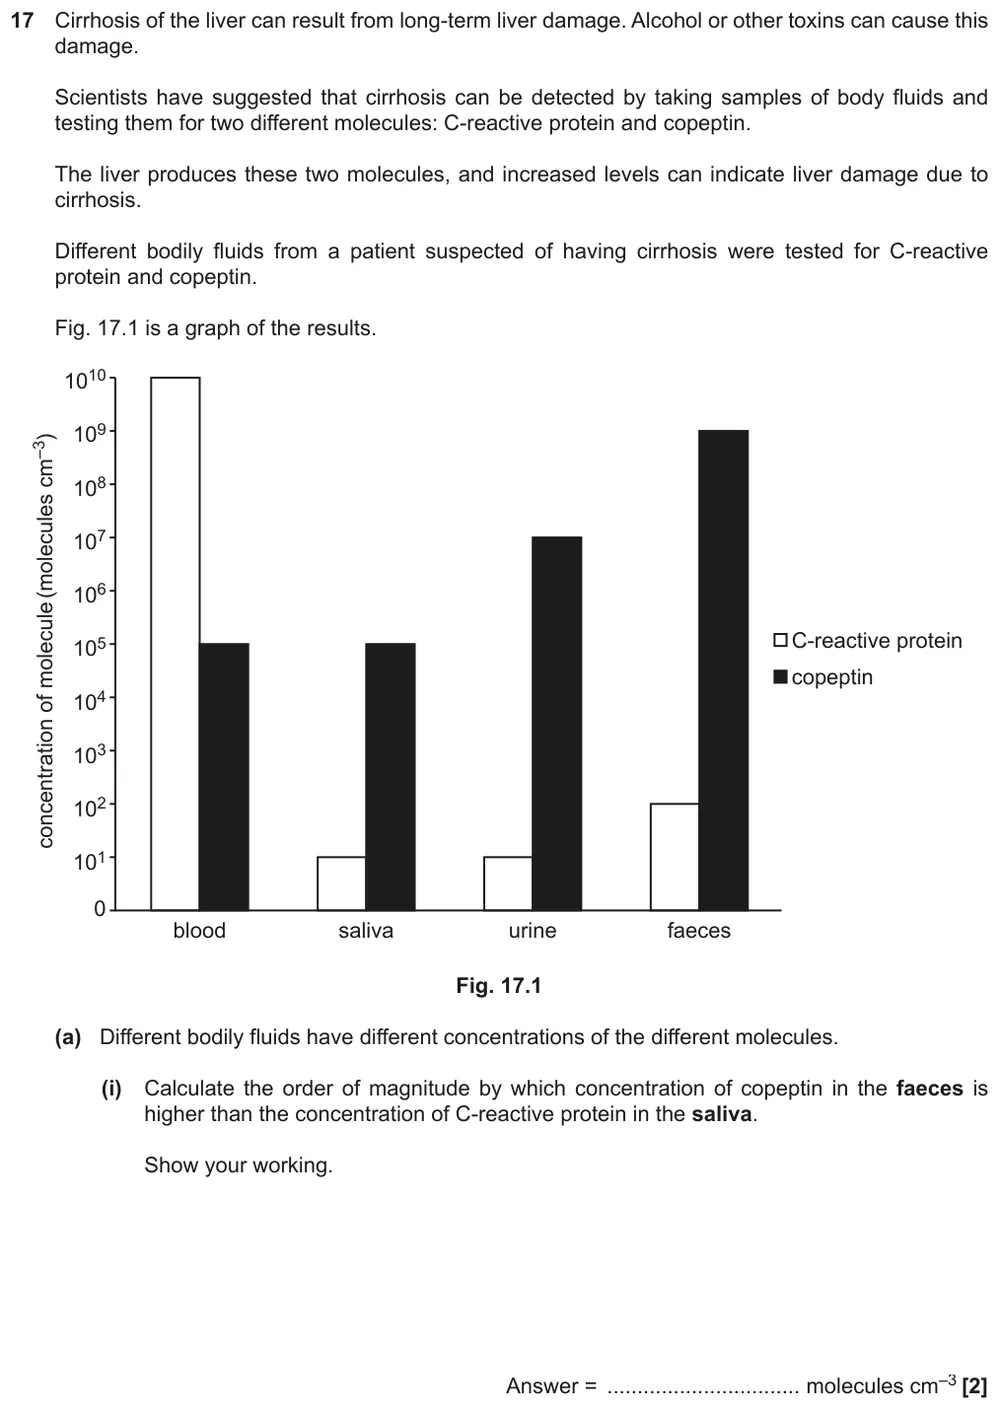
Use a log scale graph to find the order of magnitude difference between two concentrations.
Show the mark scheme

Tap an image to open it full size.
From the examiners' report: There is no examiners' report for this paper. The mark scheme gives credit for reading the two values as powers of ten and dividing them, 10⁹ ÷ 10¹ = 10⁸, so show that step.
Question 14
A level Paper 2 · June 2024 · Q19(b)(iii) · 1 mark · Medium
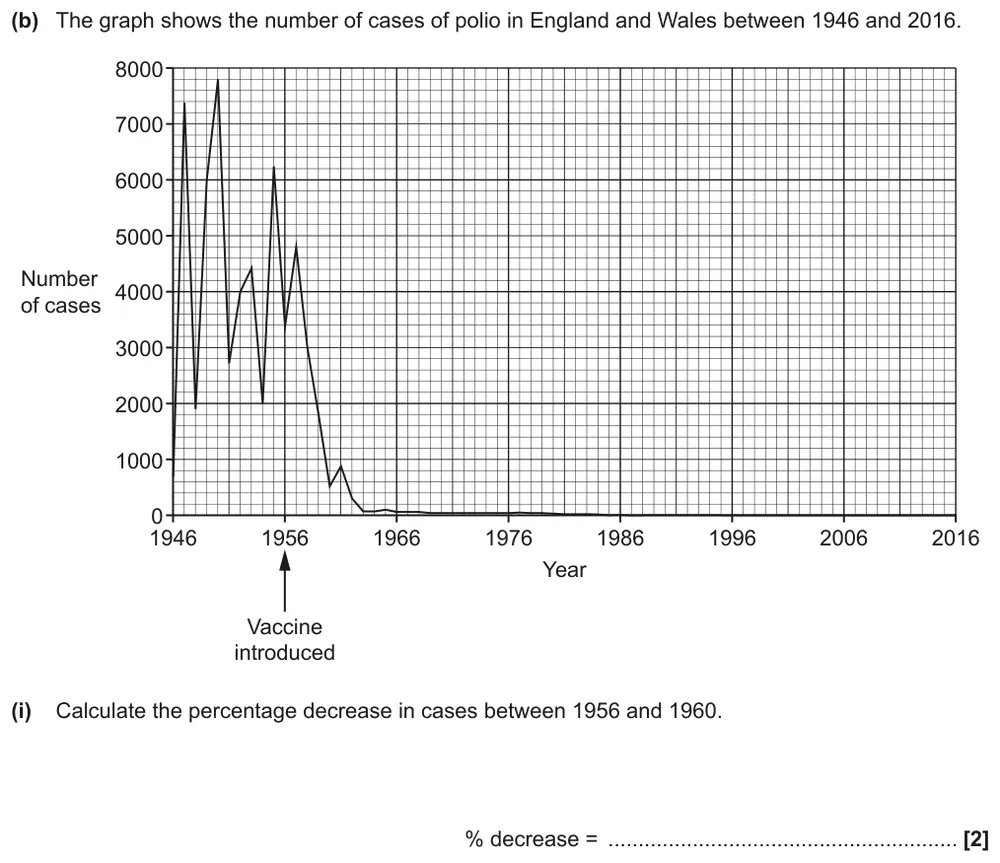
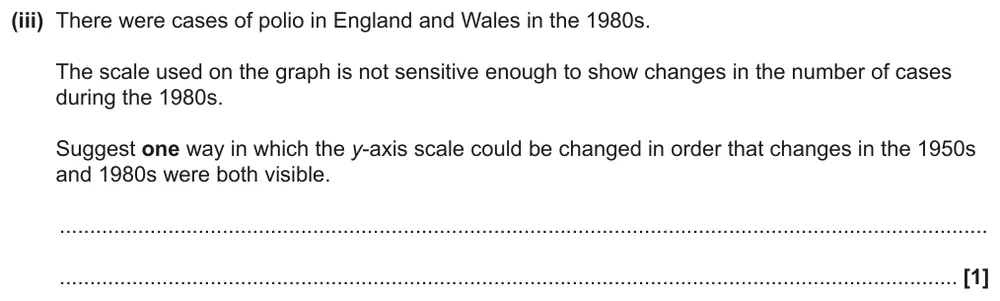
Suggest how to change the y-axis so that polio cases in both the 1950s and 1980s are visible.
Information from earlier in this question:
Show the mark scheme

Tap an image to open it full size.
From the examiners' report: Fewer than one in four students thought of a logarithmic scale. When numbers range from thousands down to a handful, a log scale lets you see changes at both ends.
Question 15
A level Paper 3 · June 2022 · Q3(b)(i) · 1 mark · Hard
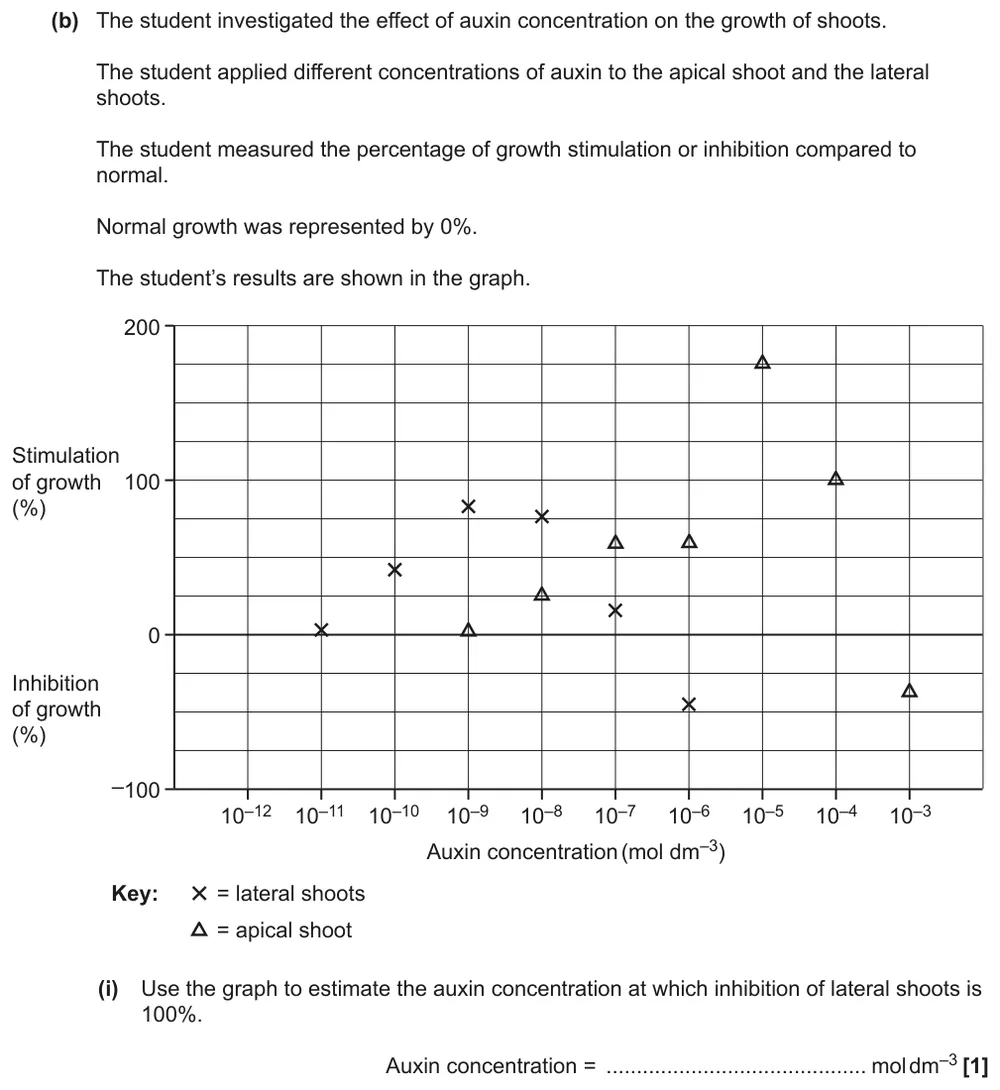
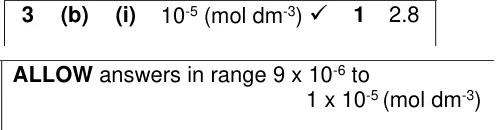
Read an auxin concentration off a logarithmic x-axis.
Show the mark scheme
Tap an image to open it full size.
From the examiners' report: Most students got this right. Errors came from misreading the log scale and writing the standard form wrongly, or from reading the apical shoot line instead of the lateral shoots, so check the key.
Question 16
A level Paper 2 · June 2022 · Q17(c)(ii) · 3 marks · Hard
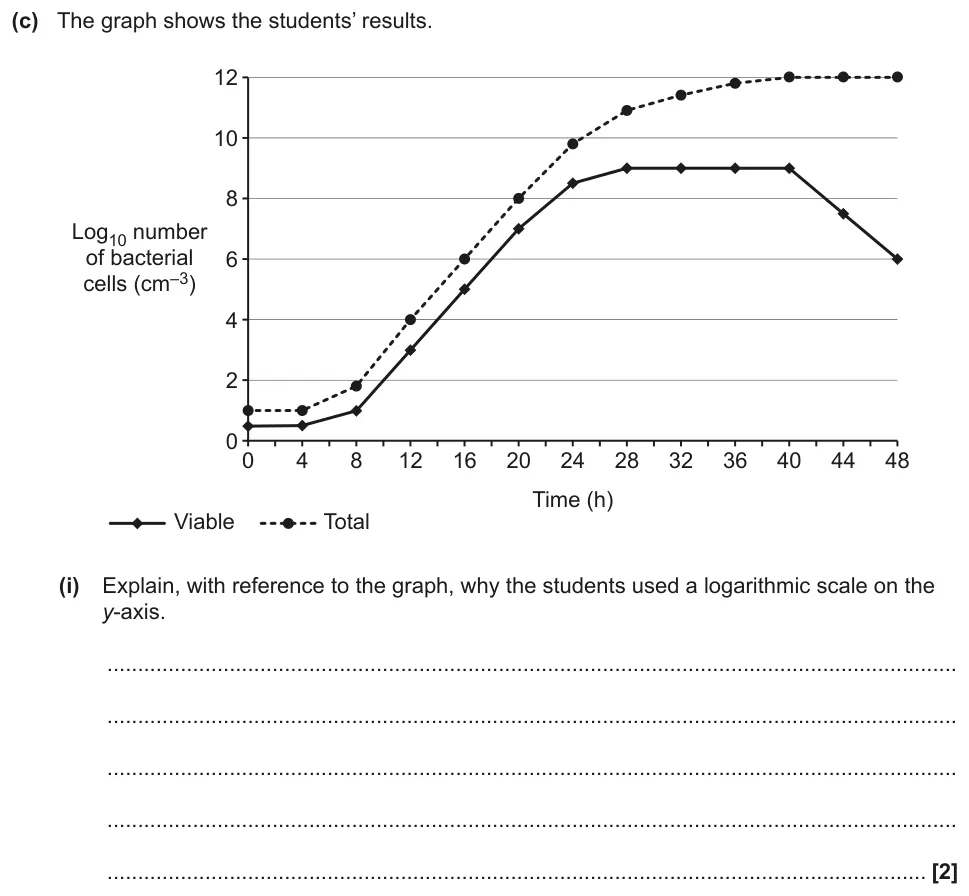
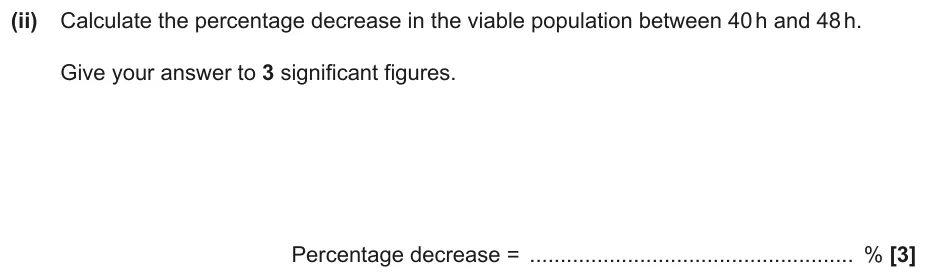
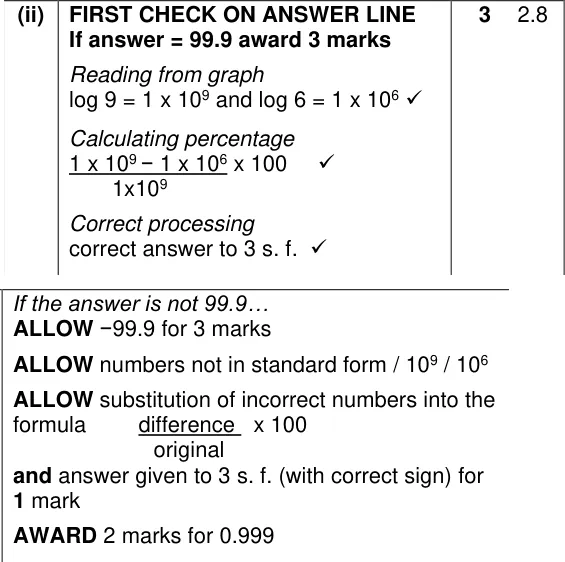
Convert log values from a graph back into numbers to calculate a percentage decrease.
Information from earlier in this question:
Show the mark scheme
Tap an image to open it full size.
From the examiners' report: Fewer than a fifth of students got full marks, because many couldn't turn a log value such as 6 into 1 000 000. About half still got a mark for setting up the percentage change, so show the formula even if you're unsure of the numbers.
Where students lose marks (from OCR examiners' reports and mark schemes)
Each point below is followed by wording that gained marks.
Rearrange before you substitute: For breathing rate, the most common wrong answer was 96, from dividing tidal volume by ventilation rate (480 ÷ 5). Some students also couldn't rearrange the magnification equation to find actual size.
✔ Gains credit: "breathing rate = ventilation rate / tidal volume = 5000 / 480 = 10.4167 = 10".
Convert to matching units first: Students mixed dm³ with cm³, and measured in centimetres but multiplied by 1000 instead of 10 000 to get micrometres, so answers were out by a factor of 10.
✔ Gains credit: "1.44 dm³ = 1440 cm³; 1440 / 24 = 60" and "14 mm ÷ 950 = 0.0147 mm; 0.0147 × 1000 = 15 µm".
Round only at the end: In Simpson's Index questions, students who didn't get full marks usually rounded intermediate values, which shifted the final answer.
✔ Gains credit: "N = 100 ✓ Σ(n/N)² = 0.206(2) ✓", giving D = 0.79 to 2 s.f.
Match the significant figures asked for: A correct magnification or diversity index lost a mark when it wasn't rounded to the 2 significant figures the question asked for, and population estimates lost marks when they weren't whole numbers.
✔ Gains credit: "(×)14000 / 1.4 × 10⁴" and "large heath butterfly 1405 and 1153; answers must be rounded to nearest whole number".
Finish with 1 minus the sum: Some students worked out Σ(n/N)² correctly for Simpson's Index but forgot to subtract it from 1.
✔ Gains credit: "(Habitat B =) 0.61; habitat with the greatest biodiversity = A".
The recessive phenotype gives q²: In Hardy–Weinberg questions, the most common error was treating the fraction of recessive individuals as q instead of q².
✔ Gains credit: "150/600 = 0.25 (q²); square root of 0.25 = 0.5 (q); p = 1 − 0.5 = 0.5".
Turn log values back into numbers: Many students couldn't convert a value read off a log₁₀ axis into an ordinary number, for example log 6 into 1 000 000, before calculating a percentage change.
✔ Gains credit: "log 9 = 1 × 10⁹ and log 6 = 1 × 10⁶", then "(1 × 10⁹ − 1 × 10⁶) ÷ 1 × 10⁹ × 100 = 99.9%".
Suggest a log scale for a huge range: Fewer than one in four students suggested a logarithmic scale for data that ran from thousands of cases down to very few.
✔ Gains credit: "use a log(arithmic) scale"; a log range is one where "each interval is a factor of 10" (not "change by 10 each time").
Download the questions
Download the PDF pack (16 questions, mark schemes at the end)
Keep practising
- Graph Skills (M3): OCR A Level Biology exam questions by topic
- Arithmetic and Numerical Computation (M0): OCR A Level Biology exam questions by topic
- OCR A Level Biology biodiversity quiz
- All OCR A Level Biology quizzes
- OCR A Level Biology masterclasses
Questions, mark schemes and examiners' report extracts © OCR.