

Graphs appear on every AQA A Level Biology paper, and at least 10% of the marks across the papers test maths. The biology changes from haemoglobin to trout farms to tumours, but the graph skills stay the same: read a value accurately, plot data in the right format, recognise a straight line and its intercept, work out a rate from a straight line, and draw a tangent to find a rate from a curve. These are the MS 3 skills in the specification.
The examiners' reports show that most marks here are lost on method, not biology: misreading the scale, dividing one reading by the time instead of drawing a tangent, forgetting to convert a log value with the 10x button, drawing a bar chart when the data need a histogram, or writing units with a slash. Every question below is from a real AQA paper, with the mark scheme and the examiners' comments turned into advice.
Answer each question on paper first, using a ruler and a sharp pencil on the printed PDF for the plotting and tangent questions. If you'd like to practise these skills with me, my AQA masterclasses run online on Tuesdays at 5.15pm for Year 12 and on Wednesdays or Thursdays at 6.30pm for Year 13.
What you need from GCSE
Each question on this page assumes you're secure on these GCSE ideas. If any of them feels shaky, look it up before you start.
- The independent variable goes on the x-axis and the dependent variable on the y-axis, each with a label and units.
- Choose a scale that uses at least half the grid and goes up in equal steps.
- Use a line graph for continuous data and a bar chart for categories; draw a line or smooth curve of best fit, not dot-to-dot through scattered points.
- The gradient of a straight line is the change in y divided by the change in x.
- Percentage change = (new value − original value) ÷ original value × 100.
Key terms
These words come up in the questions and mark schemes. Examiners expect you to use them exactly.
- Independent variable: the variable you change or choose, plotted on the x-axis.
- Dependent variable: the variable you measure, plotted on the y-axis.
- Rate: how fast something changes with time; the units always include 'per unit time', for example mg dm⁻³ min⁻¹.
- Gradient: the steepness of a line: change in y ÷ change in x. On a graph against time, the gradient is the rate.
- Intercept: the point where a line crosses an axis; in y = mx + c, c is where the line crosses the y-axis.
- Linear relationship: a relationship that gives a straight line (y = mx + c). It is only directly proportional if the line also goes through the origin.
- Tangent: a straight line drawn to touch a curve at one point; its gradient gives the rate at that moment.
- Logarithmic scale: a scale where each equal step is ten times bigger (log₁₀), used when values cover a huge range. Use the 10ˣ button to turn a log₁₀ value back into a number (or eˣ for a natural log, ln).
- Histogram: a chart for continuous data in classes, with touching bars whose area shows the frequency; unlike a bar chart, which has separate bars for categories.
- Standard deviation: a measure of how spread out the data are around the mean; often shown as error bars.
What these questions cover (AQA maths skills MS 3: graphs)
The questions test these mathematical skills from the AQA AS and A-level Biology specification (7401/7402):
- MS 3.1 Translate information between graphical, numerical and algebraic forms
- MS 3.2 Plot two variables from experimental or other data
- MS 3.3 Understand that y = mx + c represents a linear relationship
- MS 3.4 Determine the intercept of a graph (the trout question in MS 3.3 also uses the intercept)
- MS 3.5 Calculate rate of change from a graph showing a linear relationship
- MS 3.6 Draw and use the slope of a tangent to a curve as a measure of rate of change
How to use this page
Write your answer on paper before you open the mark scheme. Allow about 1.3 minutes per mark: the 17 questions are worth 33 marks, so about 43 minutes in total. Then mark your answer strictly against the mark scheme and read the examiners' tip underneath it. If you'd rather print the questions, download the PDF pack.
Reading and translating graphs (MS 3.1)
Question 1
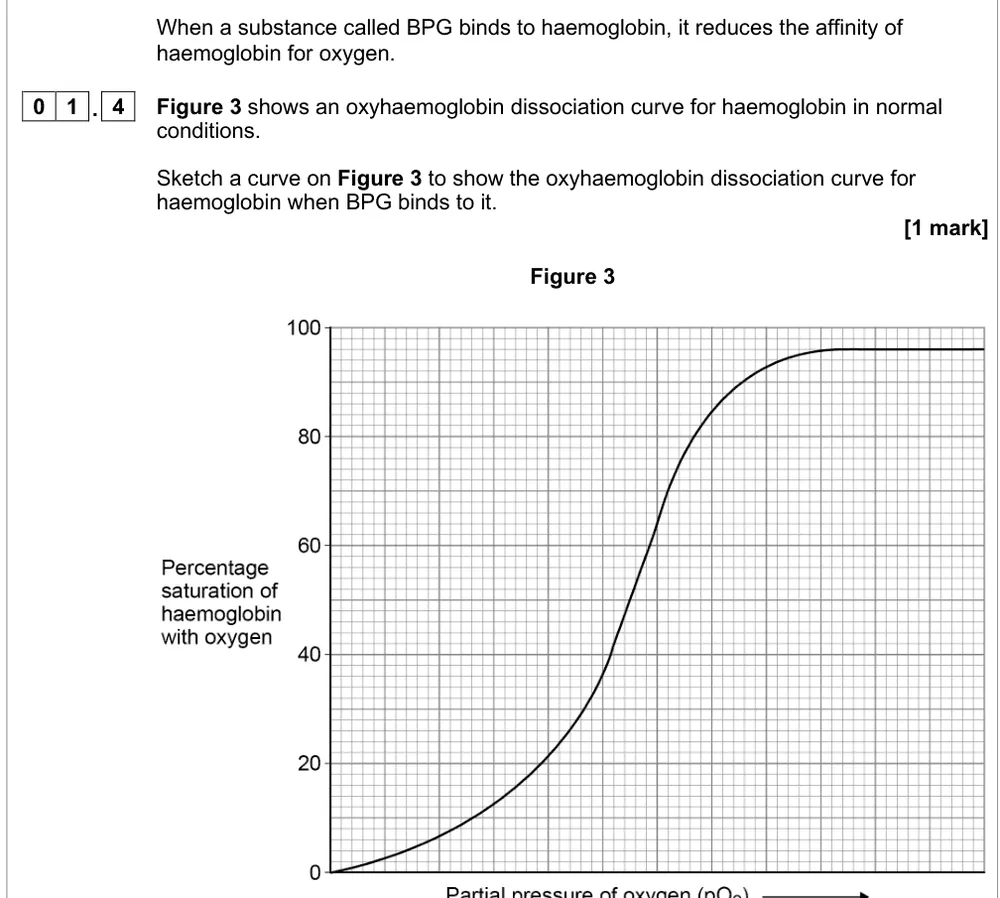
A level Paper 3 · June 2022 · Q01.4 · 1 mark
Sketch the dissociation curve for haemoglobin when BPG lowers its affinity for oxygen.
Show the mark scheme

Tap an image to open it full size.
From the examiners' report: 44% drew it correctly. Lower affinity moves the curve to the right, but it still reaches the same maximum saturation.
Question 2
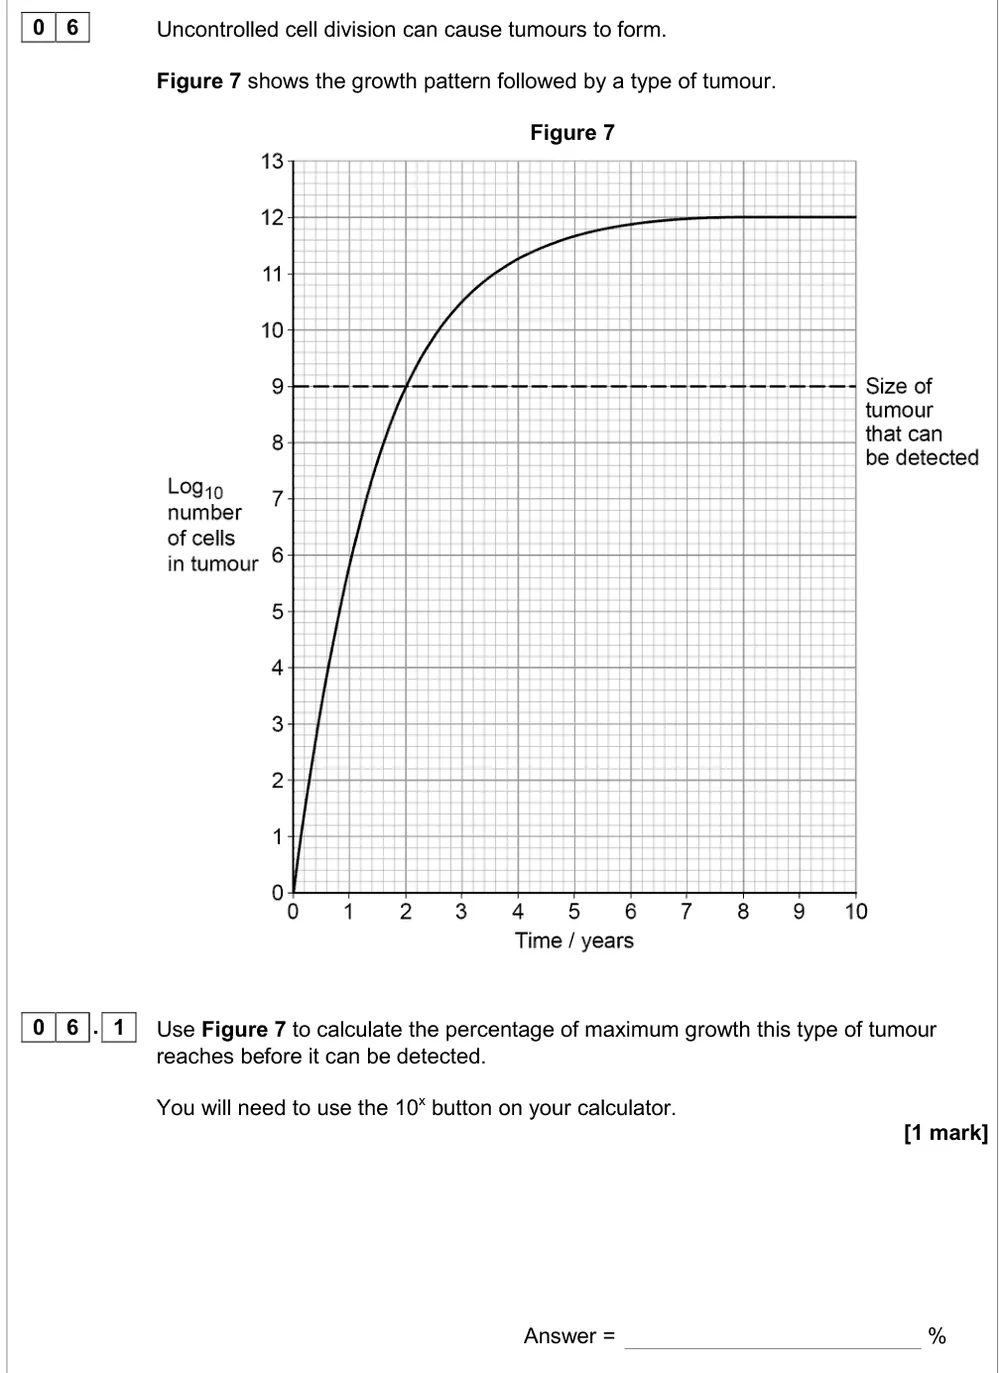
A level Paper 3 · June 2019 · Q06.1 · 1 mark · Hard
Use a log graph of tumour growth to find the percentage of maximum size when it can be detected.
Show the mark scheme
Tap an image to open it full size.
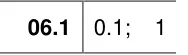
From the examiners' report: Only about a third scored. Convert both log values with 10^x first: 10⁹ cells out of a maximum of 10¹².
Question 3
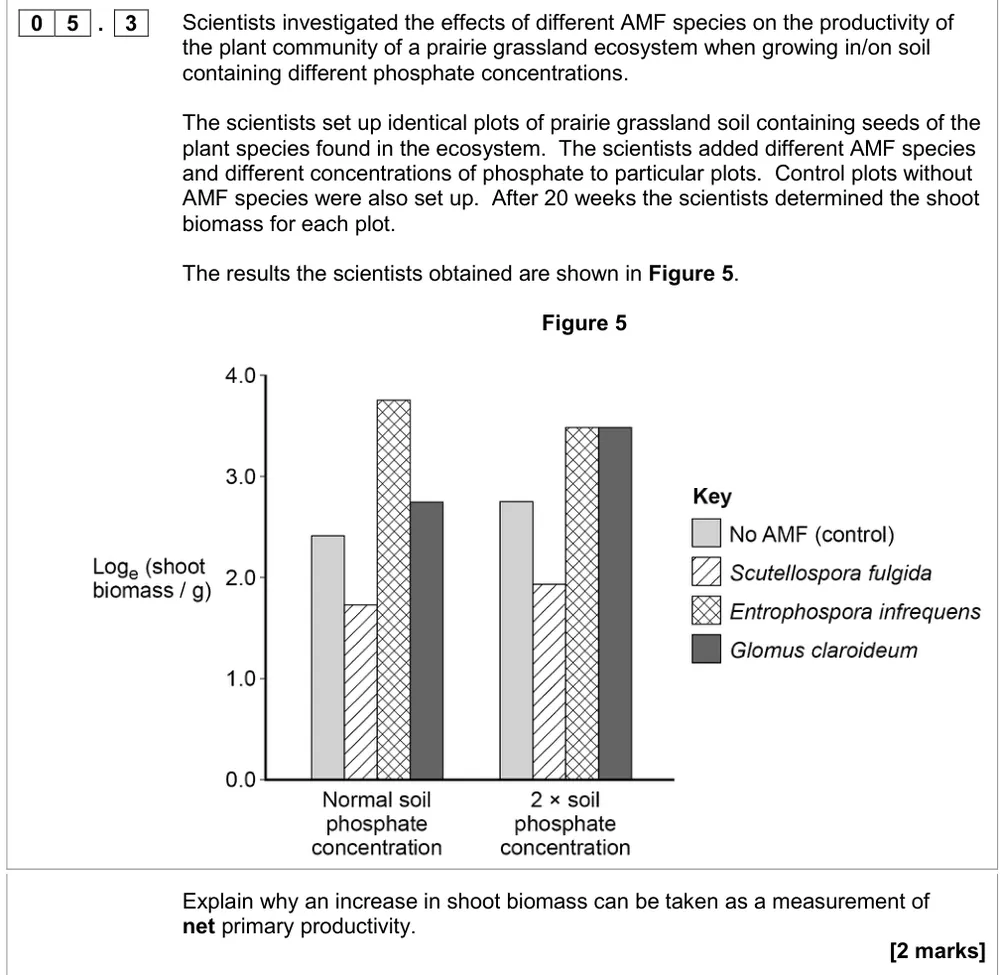
A level Paper 2 · June 2017 · Q05.5 · 2 marks · Easy
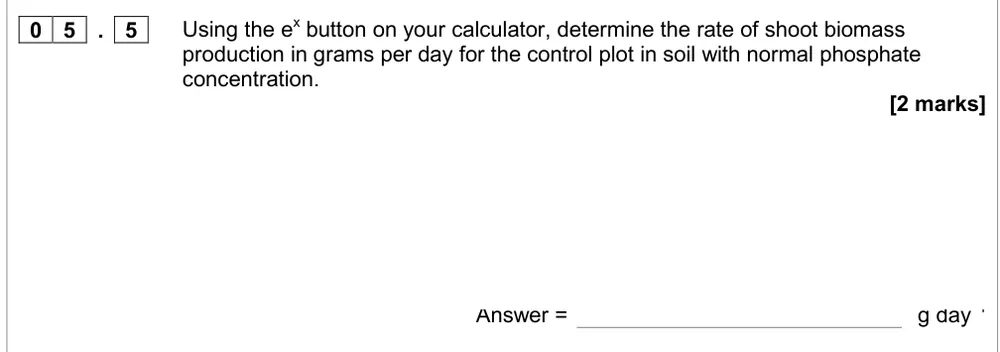
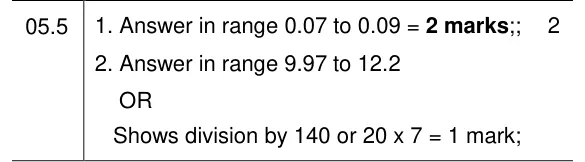
Use a natural log bar chart to find the rate of shoot biomass production per day.
Information from earlier in this question:
Show the mark scheme
Tap an image to open it full size.
From the examiners' report: Over half got both marks. Convert the loge value with e^x, then divide by 140 days (20 weeks).
Plotting and reading two variables (MS 3.2)
Question 4
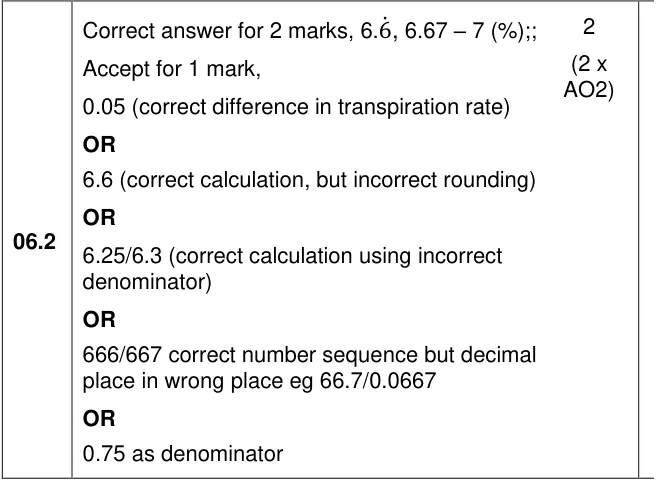
A level Paper 1 · June 2022 · Q06.2 · 2 marks · Hard
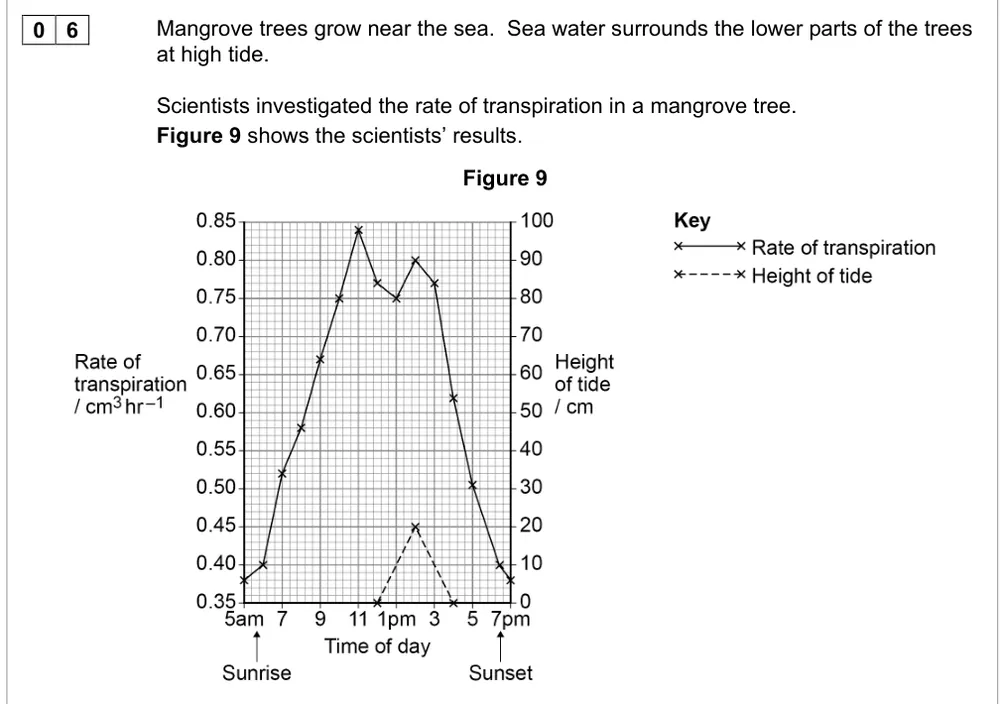
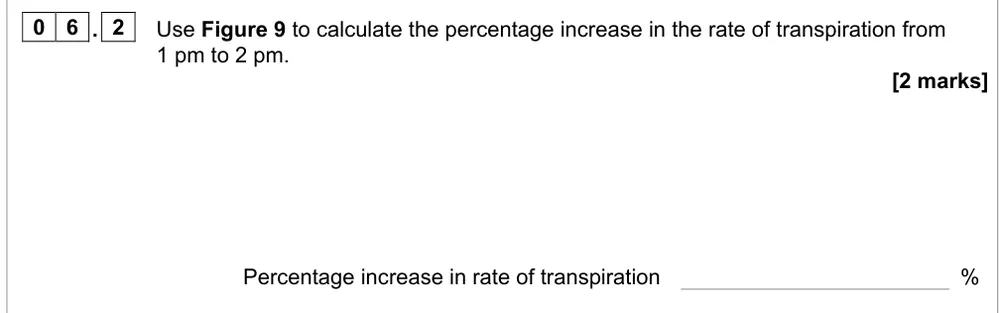
Read two values off a graph and calculate a percentage increase in transpiration rate.
Information from earlier in this question:
Show the mark scheme
Tap an image to open it full size.
From the examiners' report: About half got full marks. Many used 0.8 as the denominator; divide the change by the starting value at 1 pm.
Question 5
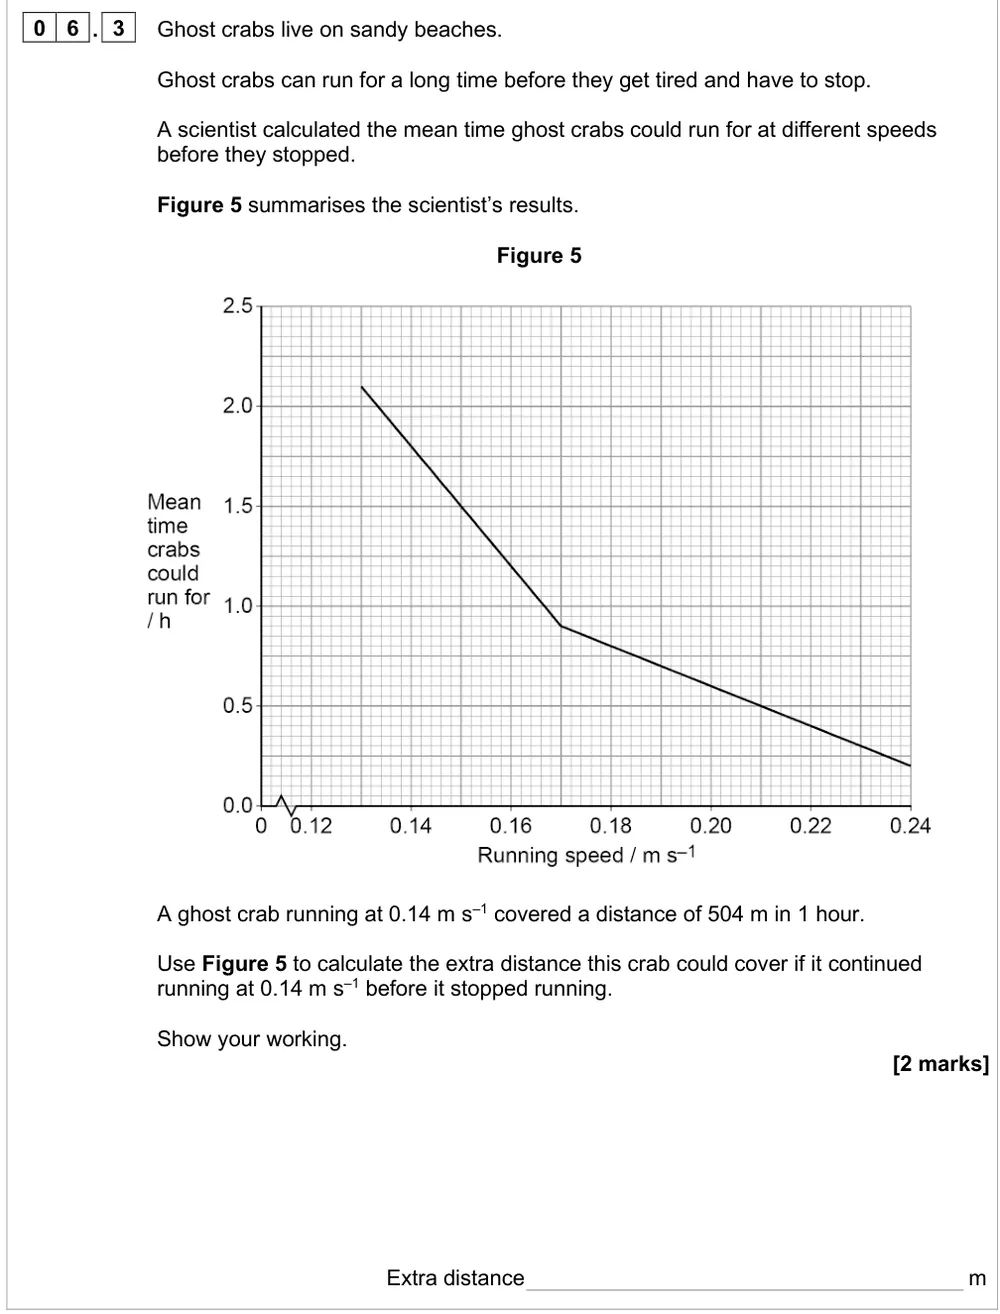
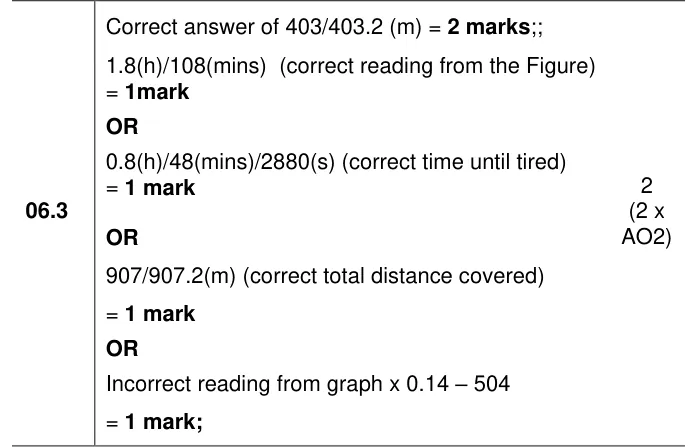
A level Paper 1 · June 2025 · Q06.3 · 2 marks · Easy
Read a time off a graph and work out how much further a crab could run.
Show the mark scheme
Tap an image to open it full size.
From the examiners' report: About 55% got both marks. Many read 1.6 h instead of 1.8 h off the trend line; read the curve carefully before converting hours to seconds.
Question 6
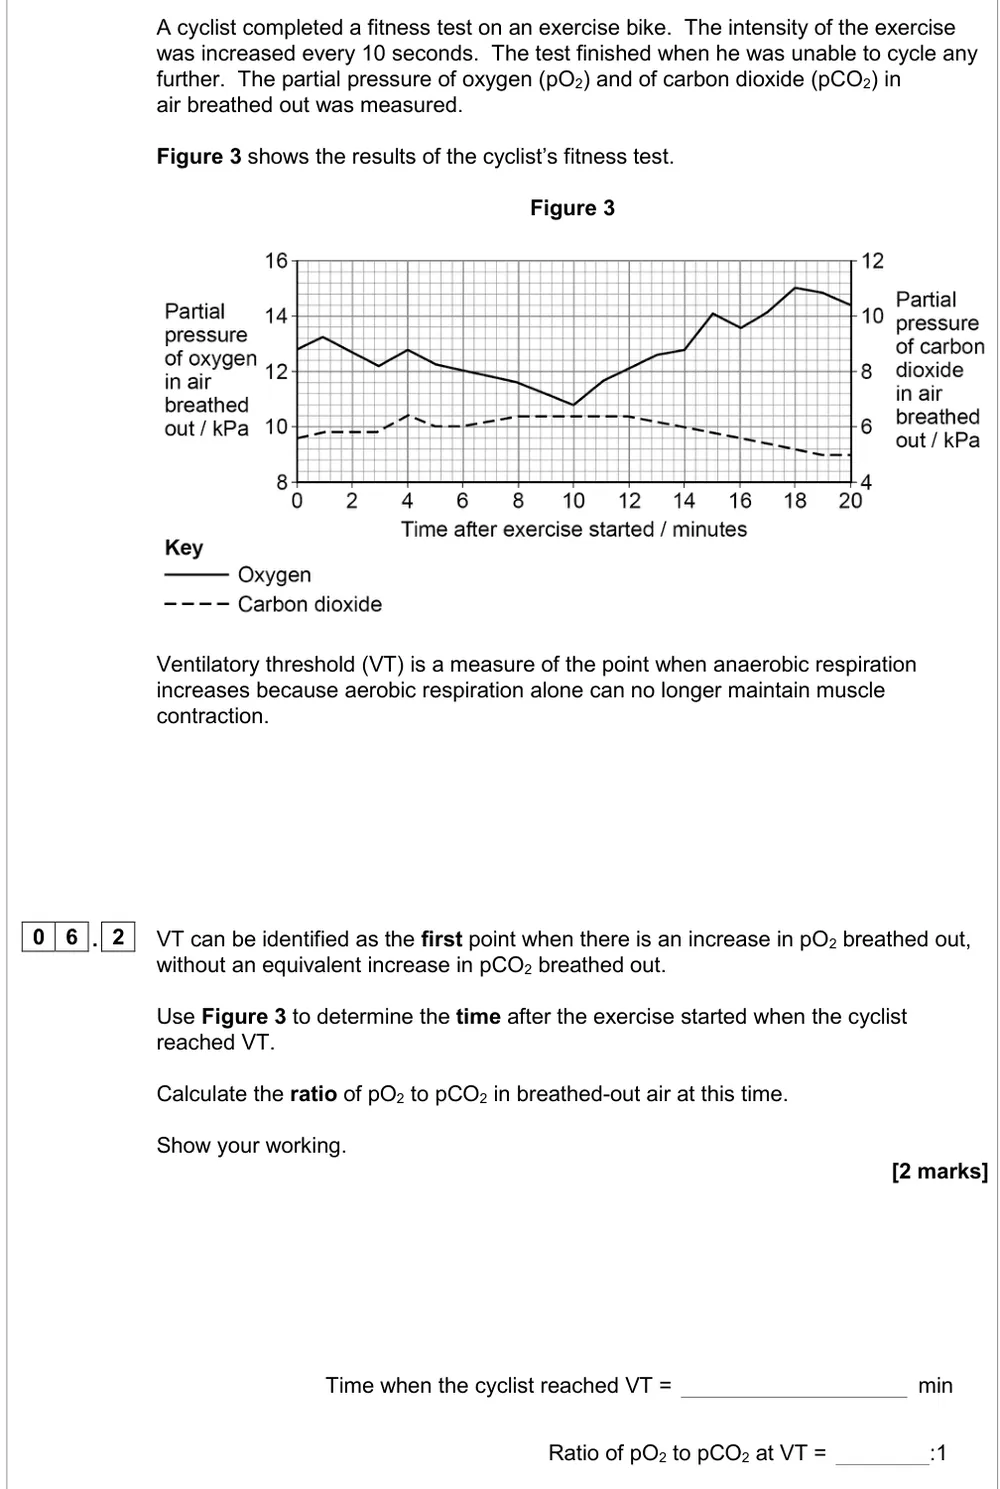
A level Paper 3 · November 2020 · Q06.2 · 2 marks · Medium
Find when the ventilatory threshold occurs and calculate the ratio of pO2 to pCO2.
Show the mark scheme

Tap an image to open it full size.
From the examiners' report: Only just over a quarter scored 2 marks. The usual error was misreading the axes; check which y axis each line uses.
Question 7
AS Paper 2 · June 2025 · Q02.4 · 1 mark · Medium
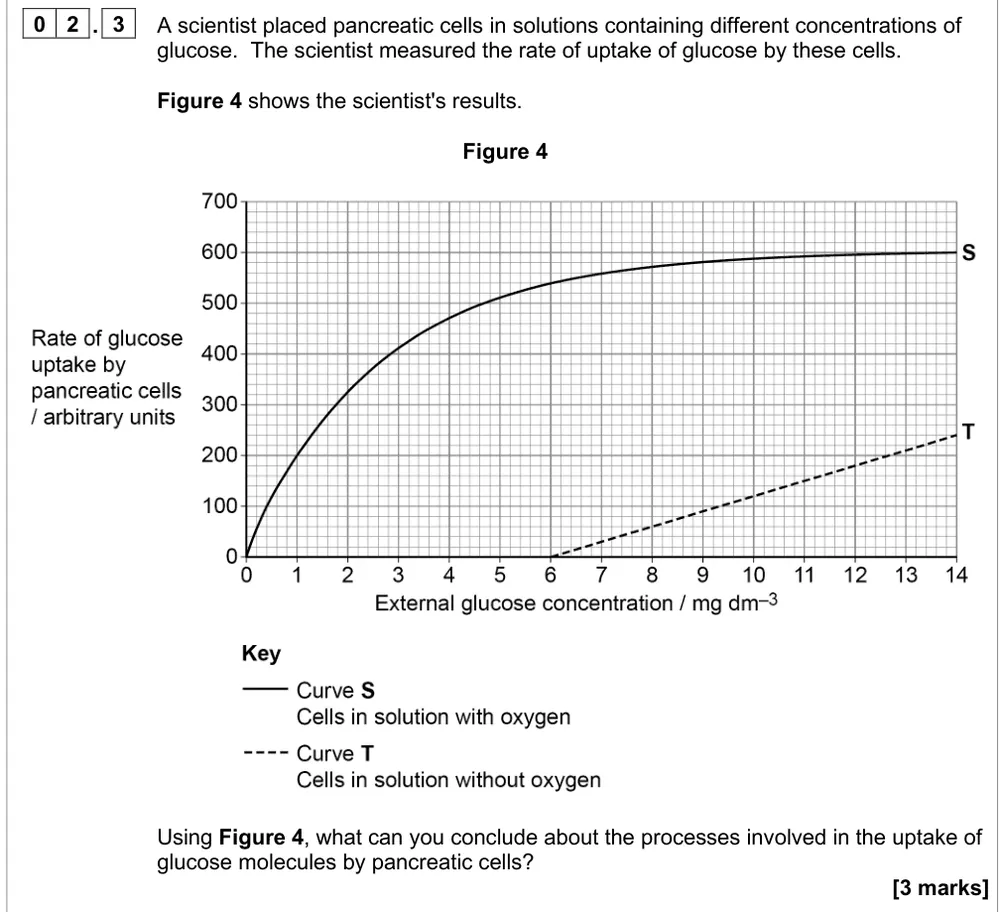
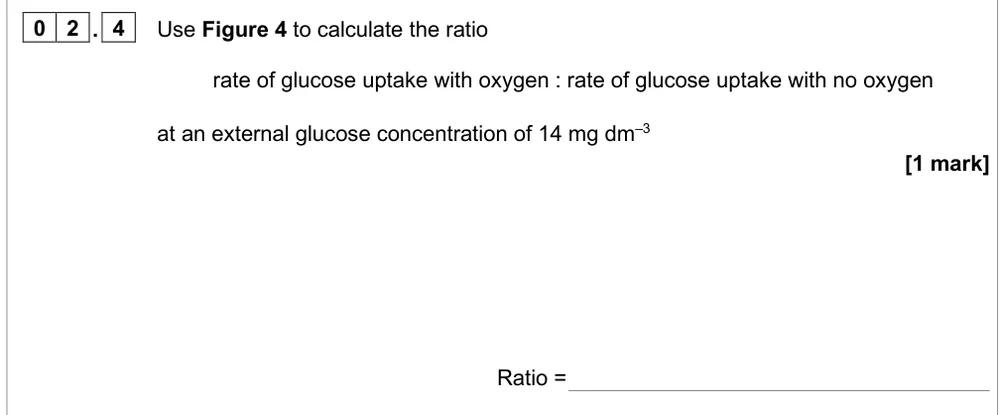
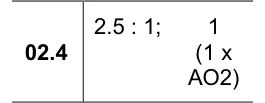
Read two rates off a graph of glucose uptake and give them as a ratio to one.
Information from earlier in this question:
Show the mark scheme
Tap an image to open it full size.
From the examiners' report: Most read 600 and 240 correctly but wrote 5 : 2. A ratio should be given to 1.
Question 8
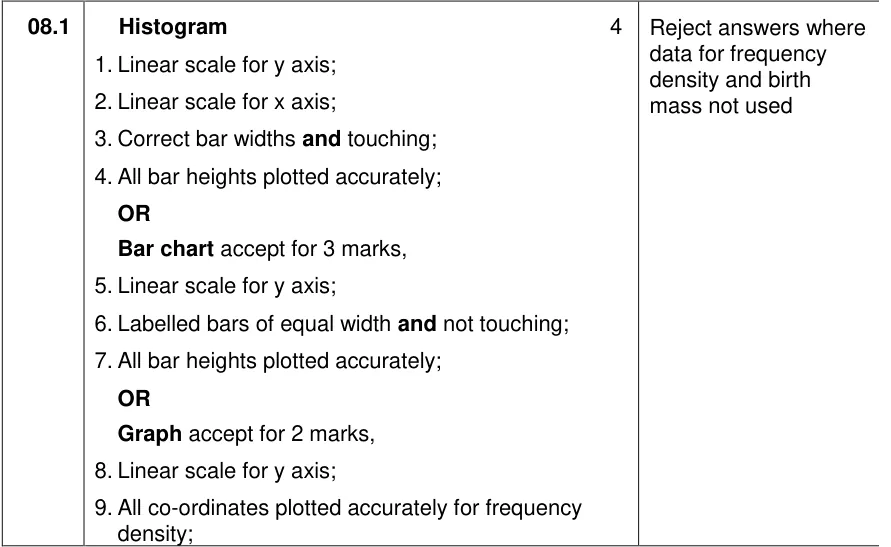
AS Paper 1 · November 2020 · Q08.1 · 4 marks
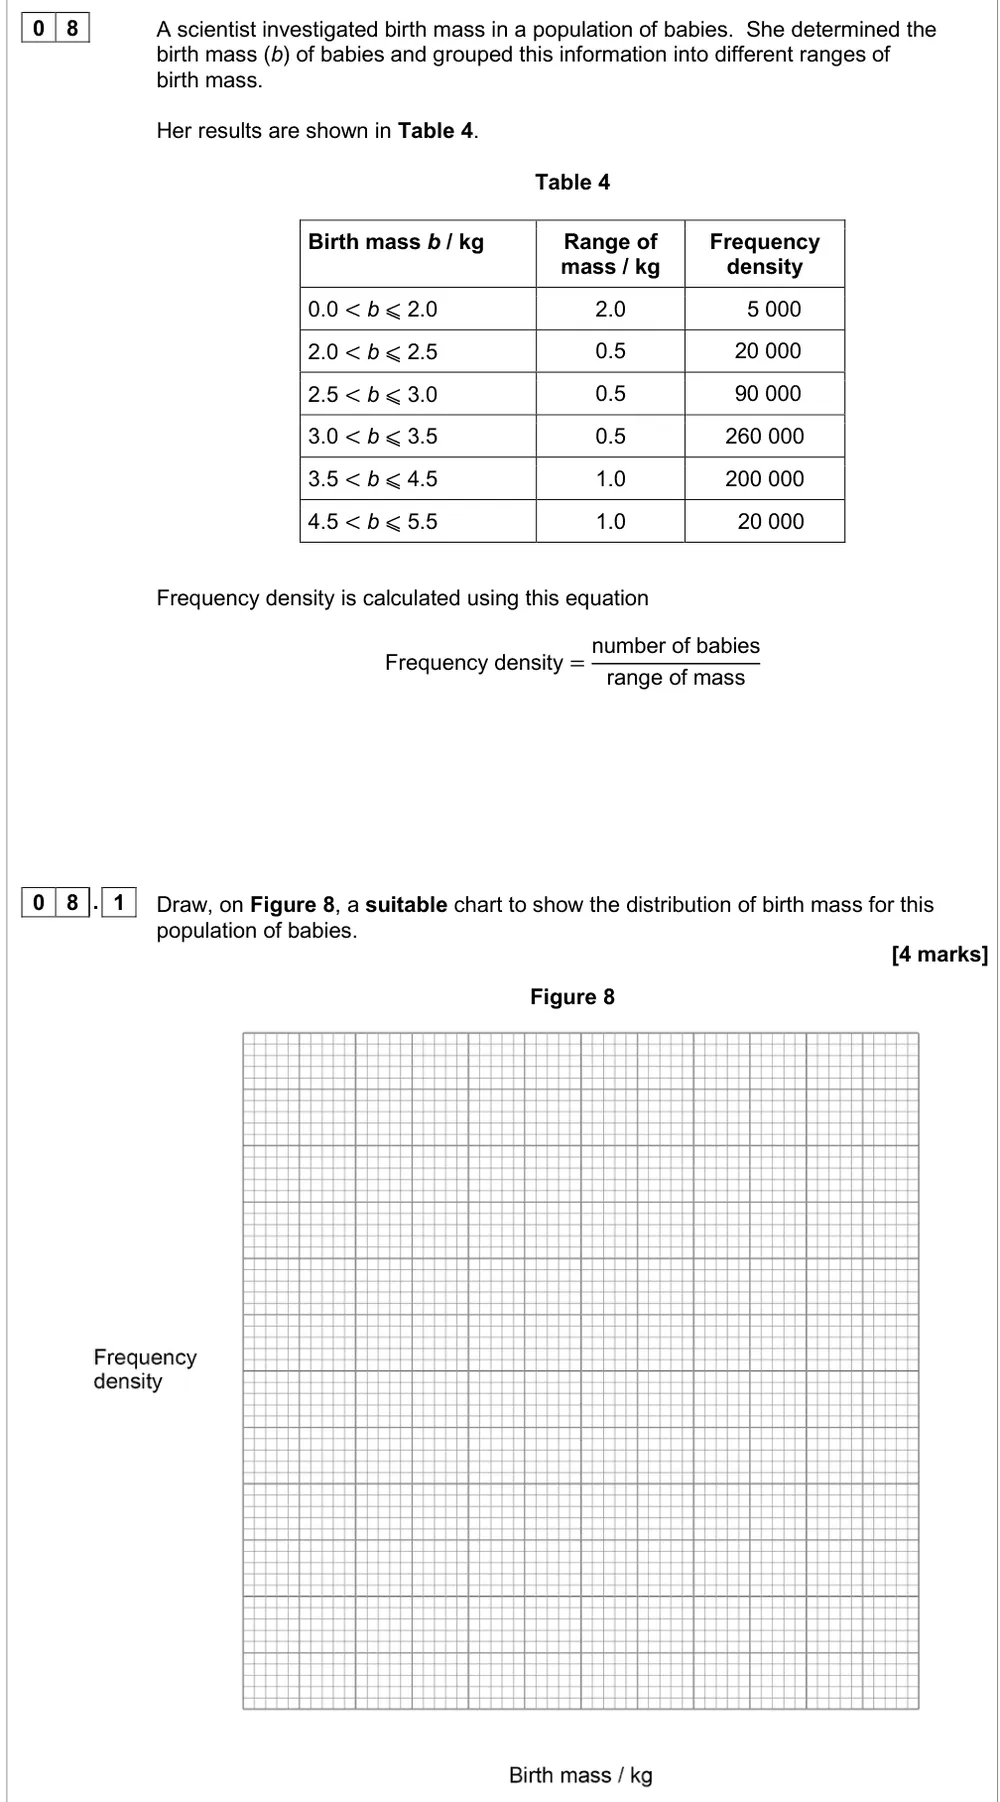
Choose and draw a suitable chart for birth mass data in unequal classes.
Show the mark scheme
Tap an image to open it full size.
From the examiners' report: The best answers were histograms with touching bars whose widths matched each mass range. The classes aren't equal, so a bar chart can't show the distribution properly.
Question 9
A level Paper 3 · June 2023 · Q06.3 · 3 marks · Medium
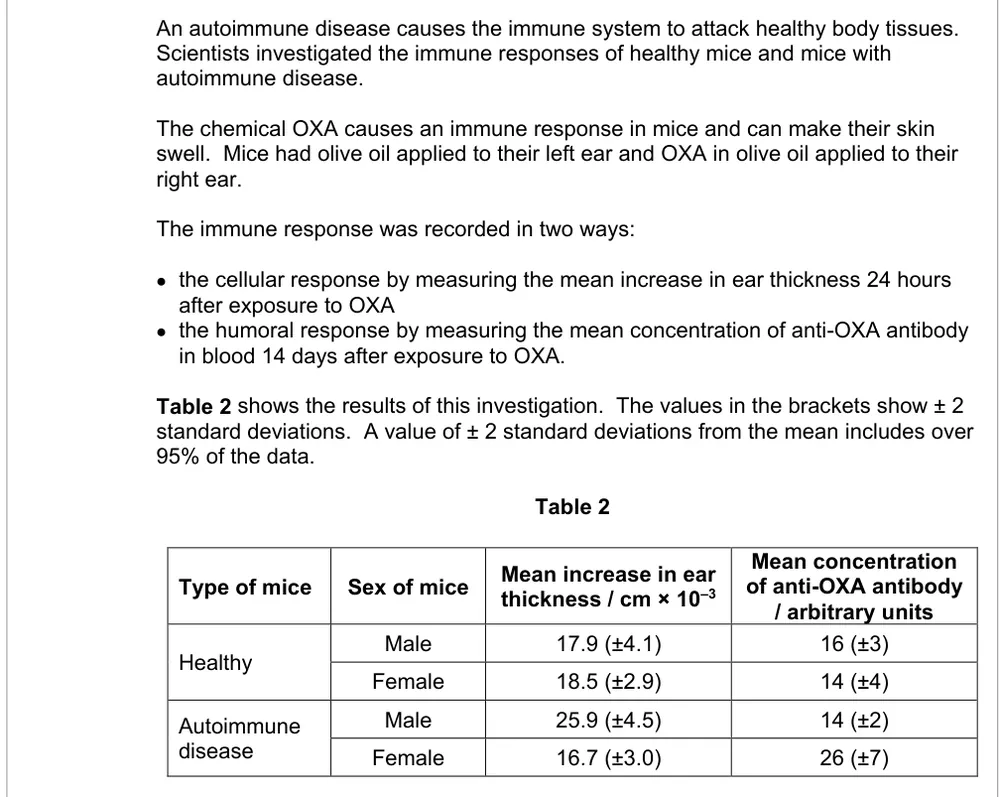
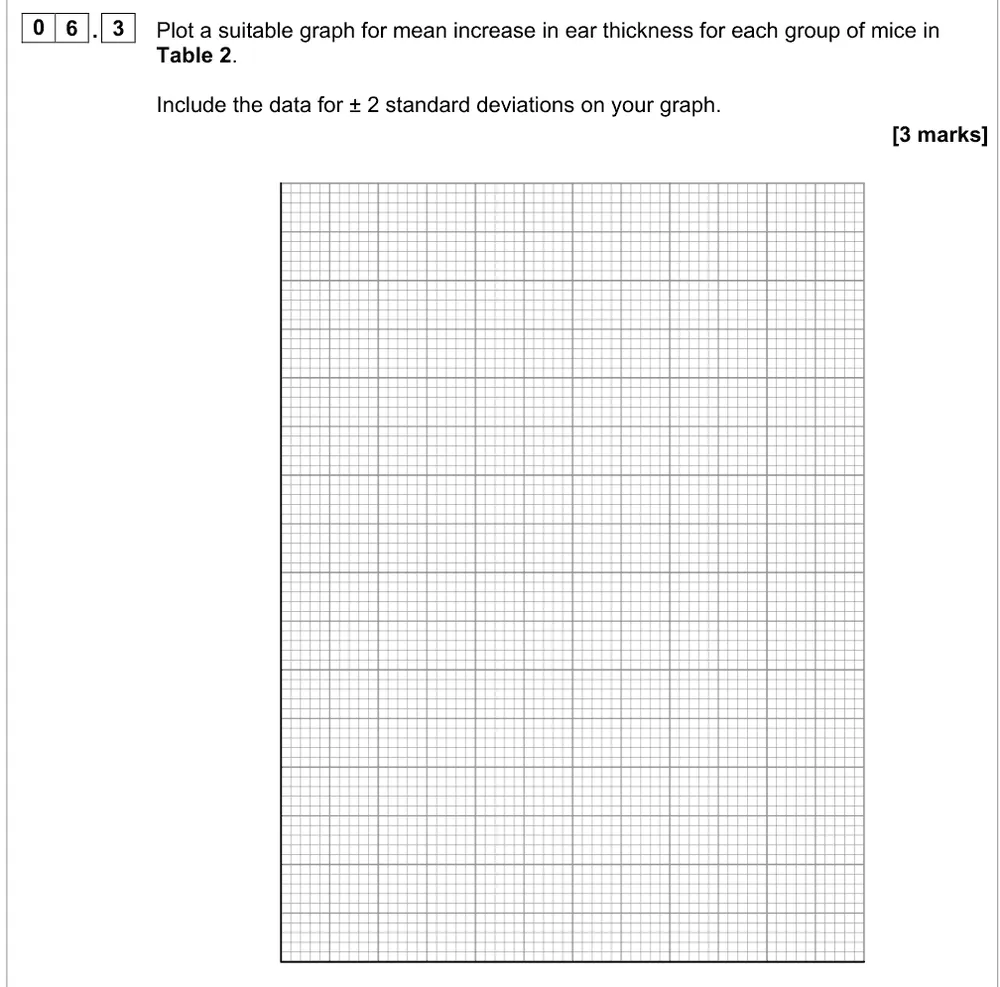
Plot mean ear thickness for four groups of mice with ±2 standard deviations.
Information from earlier in this question:
Show the mark scheme
Tap an image to open it full size.
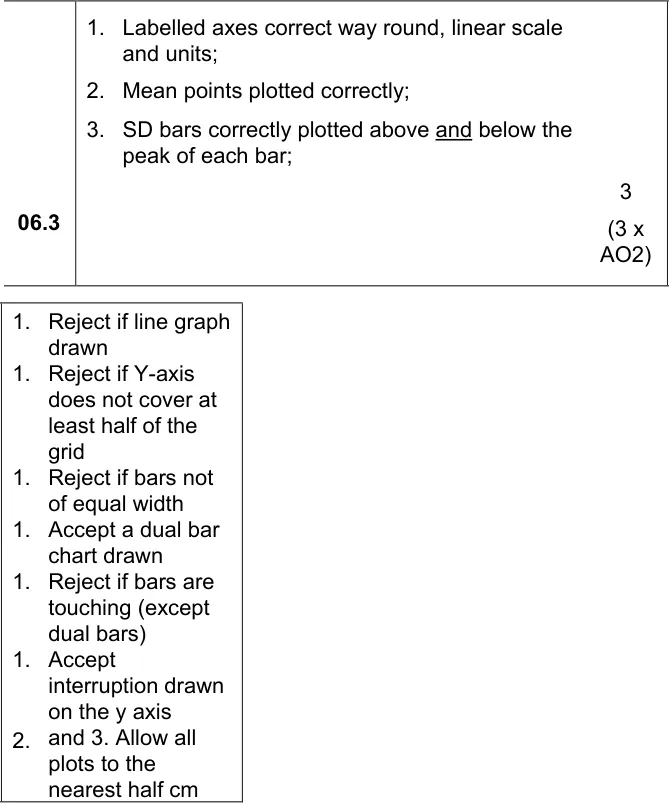
From the examiners' report: Only 30% scored all 3 marks. Students chose awkward scales, drew bars touching or forgot the SD bars. Pick a simple scale that uses at least half the grid.
Straight lines and intercepts (MS 3.3 and MS 3.4)
Question 10
AS Paper 2 · November 2020 · Q06.1 · 2 marks · Easy
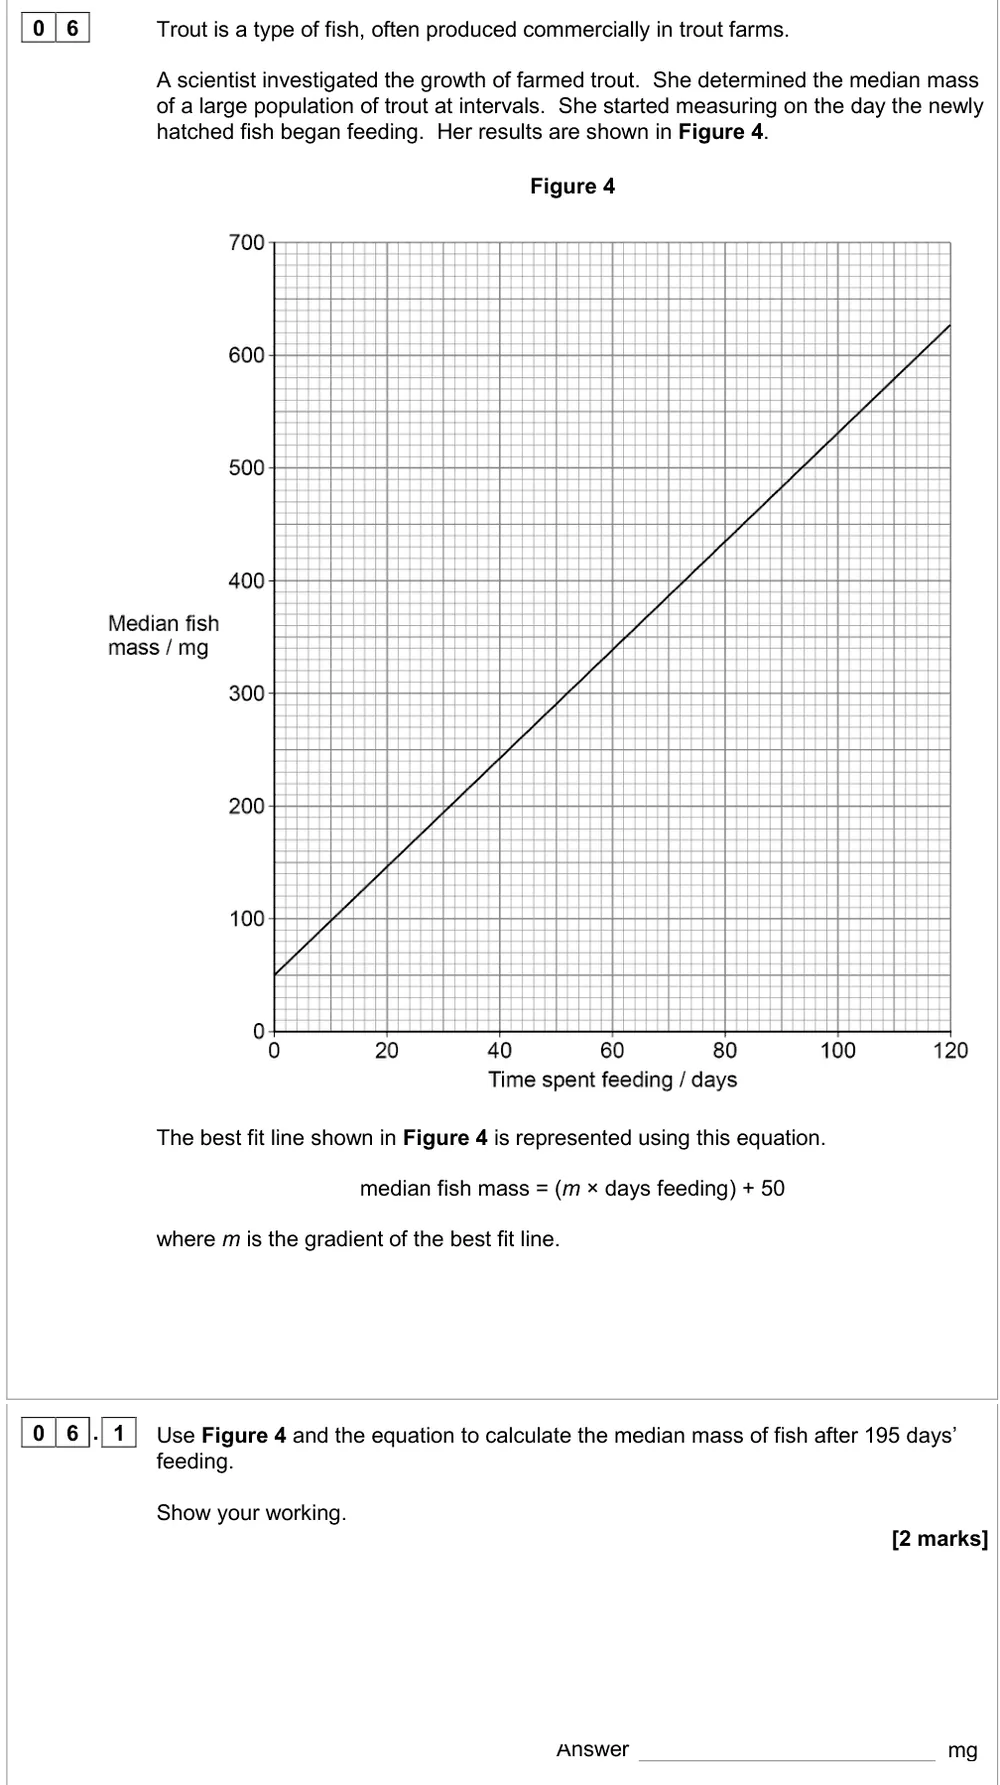
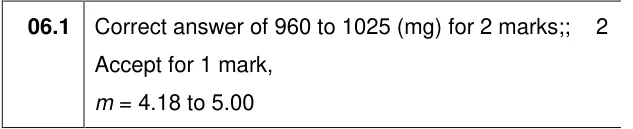
Use a straight-line graph and y = mx + c to predict fish mass after 195 days.
Show the mark scheme
Tap an image to open it full size.
From the examiners' report: Over 75% read the graph, worked out the gradient and put it into y = mx + c correctly.
Question 11
A level Paper 1 · November 2020 · Q06.2 · 2 marks
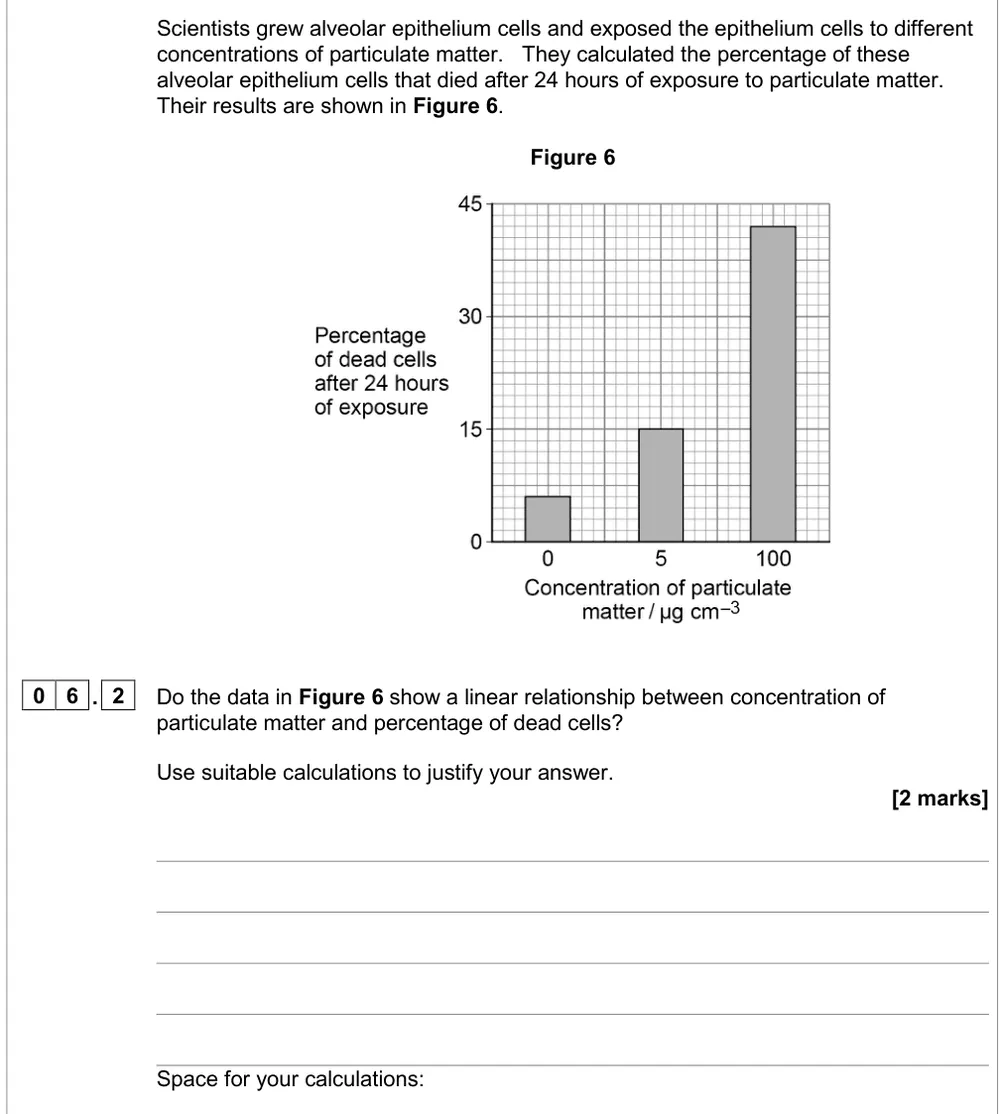
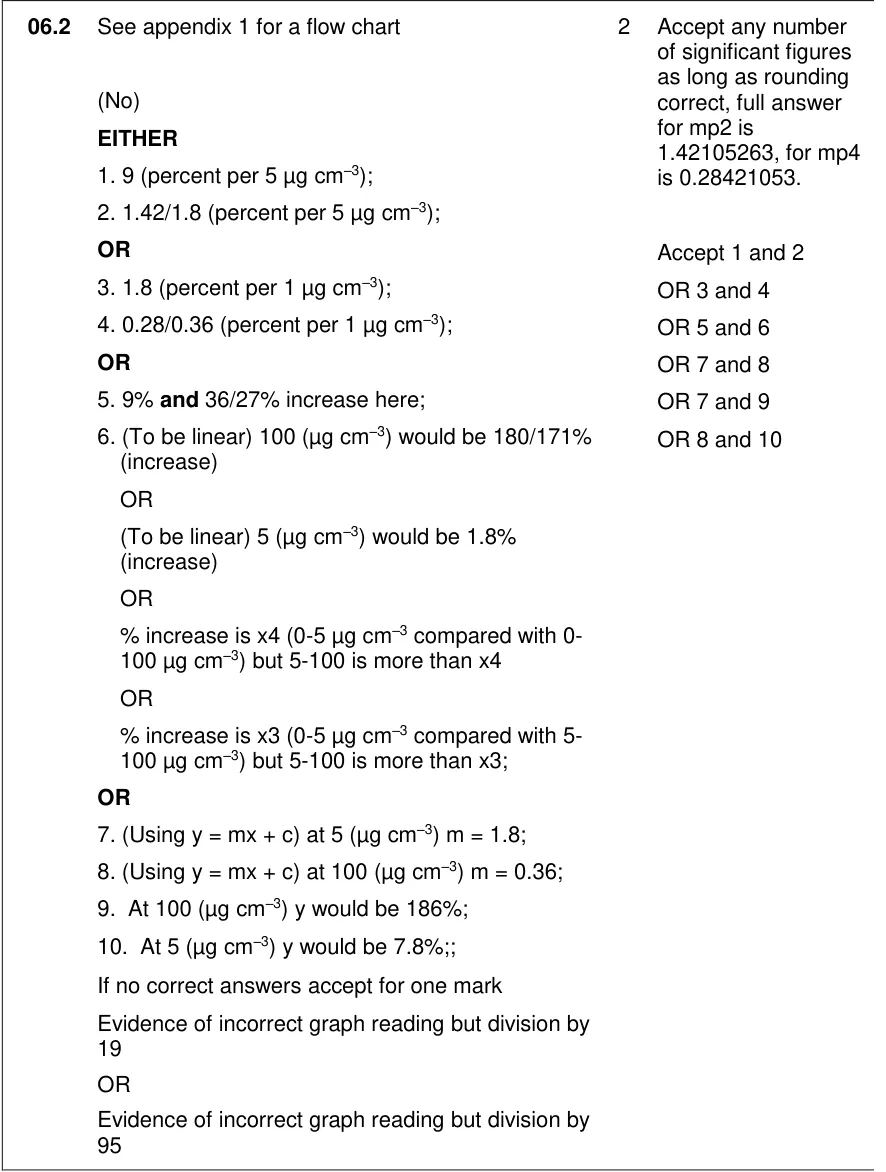
Use calculations to decide whether dead cells and particulate matter show a linear relationship.
Show the mark scheme
Tap an image to open it full size.
From the examiners' report: Many didn't know how to start, and thought a linear relationship had to be directly proportional. Compare the rate of change over each interval.
Question 12
A level Paper 1 · November 2020 · Q09.3 · 2 marks
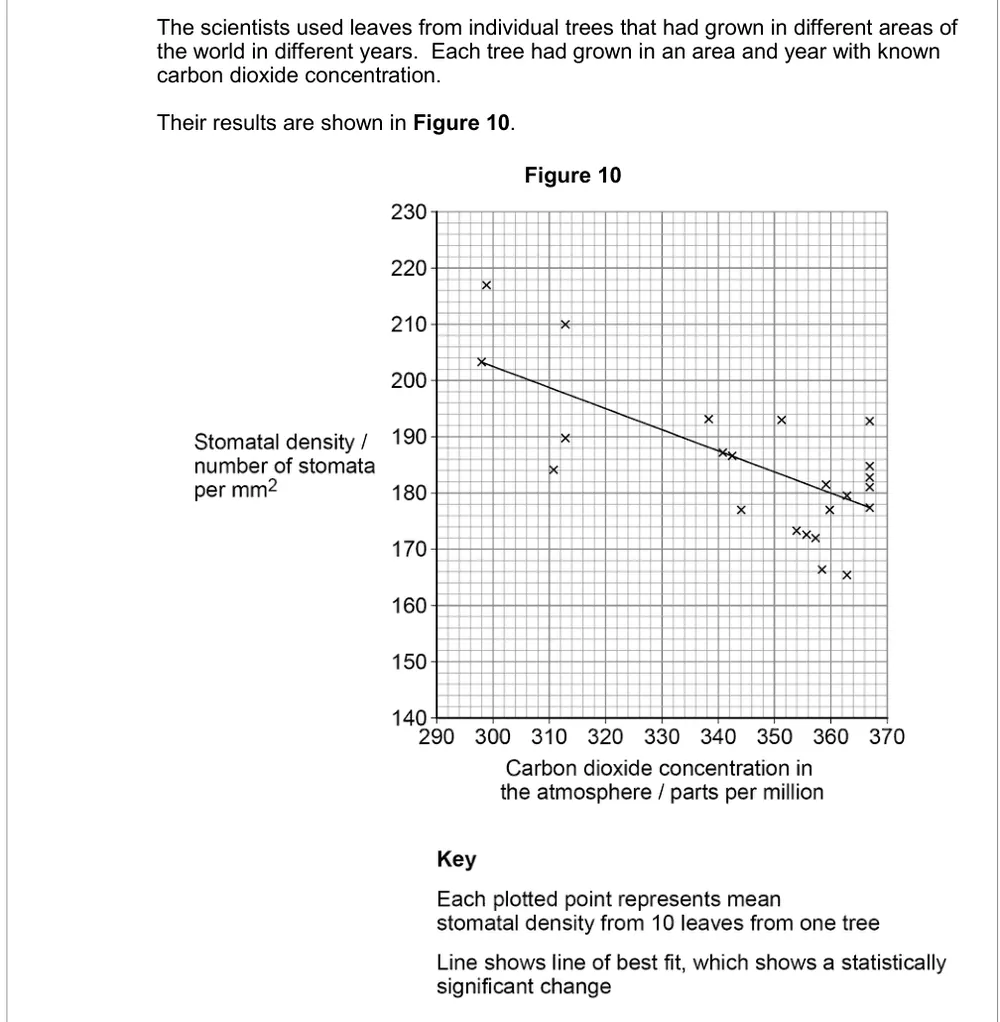
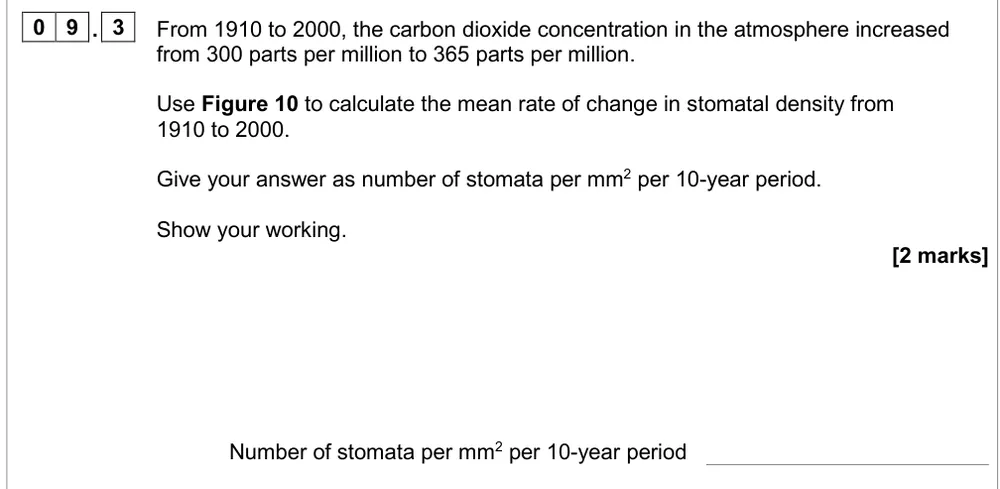
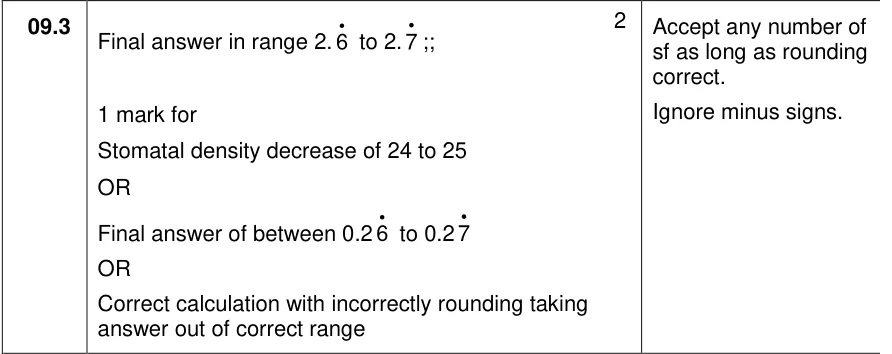
Use a line of best fit to find the mean rate of change in stomatal density per 10 years.
Information from earlier in this question:
Show the mark scheme
Tap an image to open it full size.
From the examiners' report: Many marks were available for working, so show each stage. Round your final answer sensibly rather than leaving a recurring decimal.
Rates from straight lines and tangents (MS 3.5 and MS 3.6)
Question 13
A level Paper 3 · June 2018 · Q06.2 · 2 marks · Hard
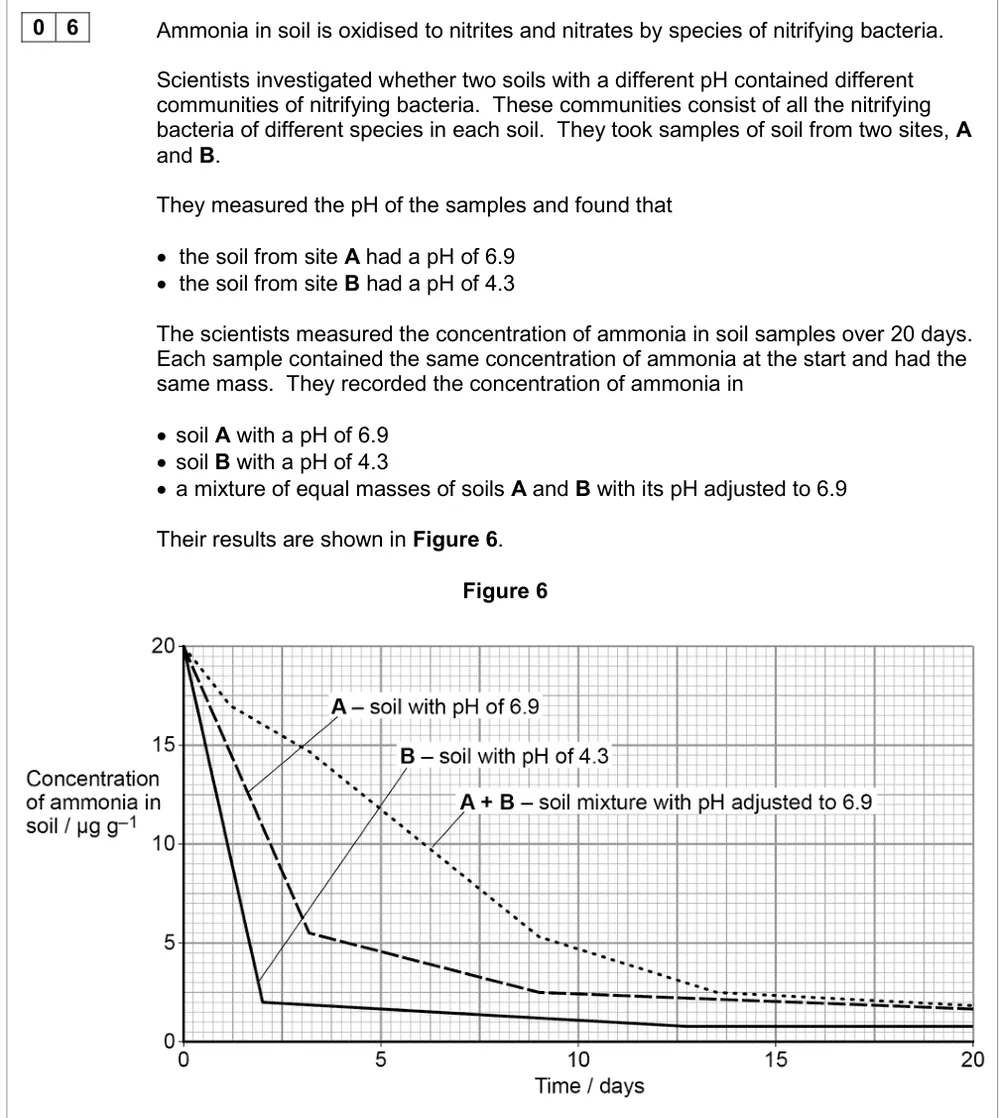
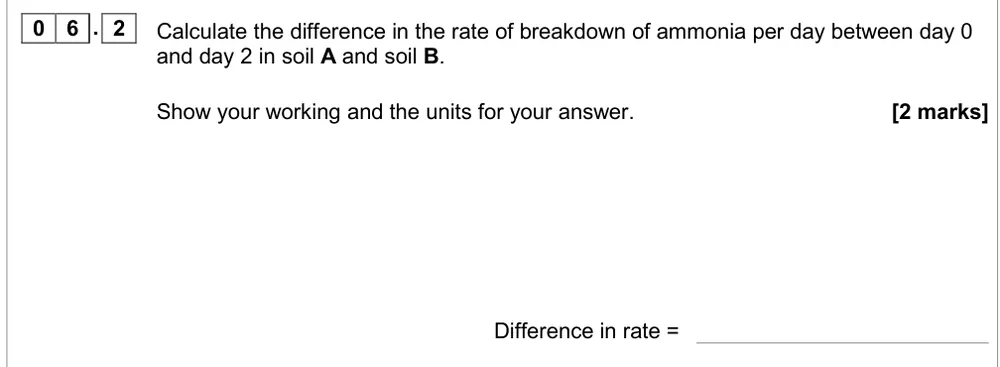
Calculate the difference in the rate of ammonia breakdown in two soils, with units.
Information from earlier in this question:
Show the mark scheme

Tap an image to open it full size.
From the examiners' report: Only 20% got both marks. Many misread the scale, and 13% lost a mark on units: AQA writes day⁻¹, not /day.
Question 14
A level Paper 1 · November 2021 · Q06.1 · 2 marks
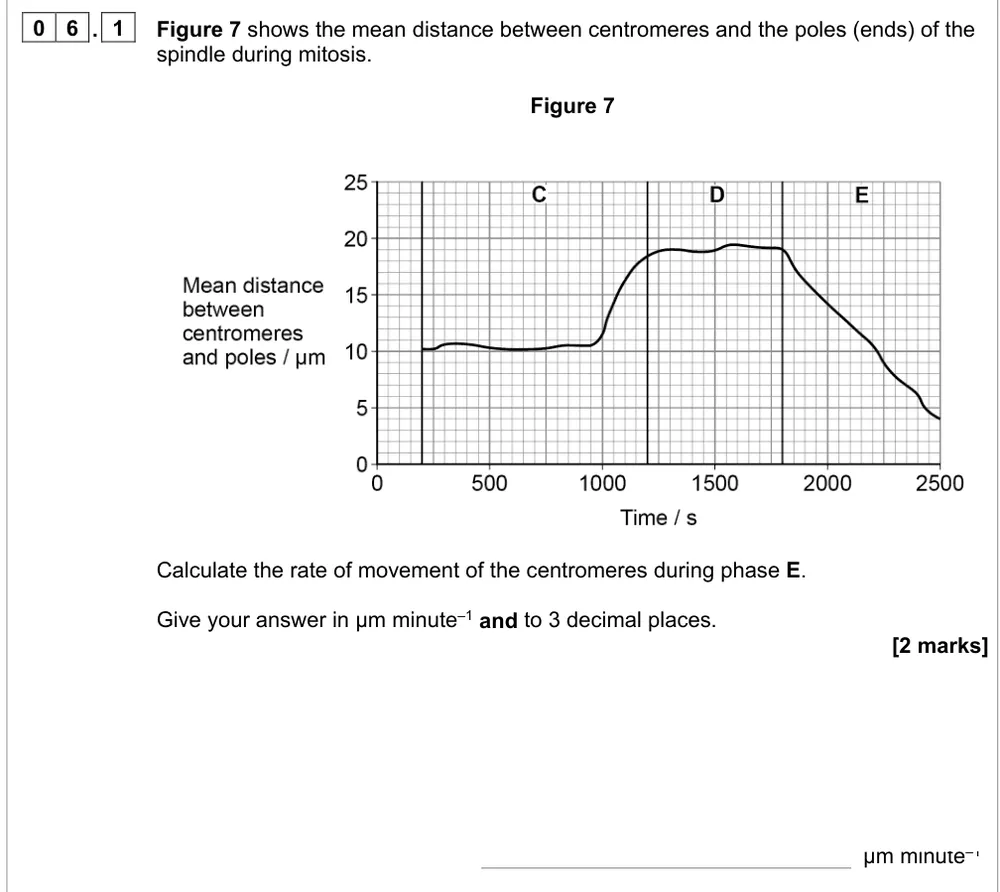
Calculate the rate of movement of centromeres during anaphase from a graph.
Show the mark scheme
Tap an image to open it full size.
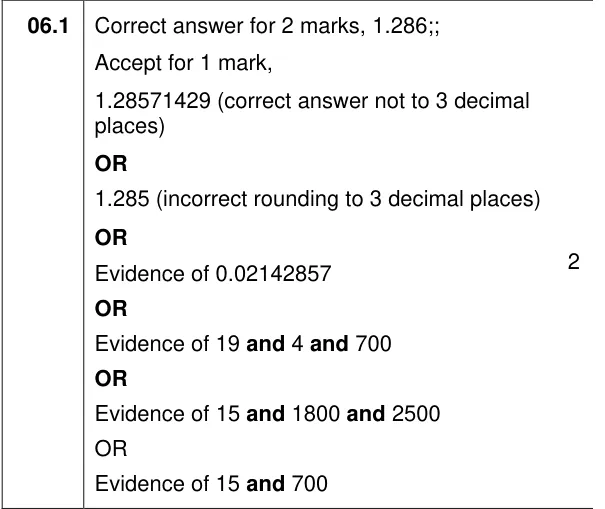
From the examiners' report: Most read the graph well. Convert seconds to minutes and give exactly 3 decimal places, as asked.
Question 15
A level Paper 1 · November 2020 · Q03.4 · 1 mark · Hard
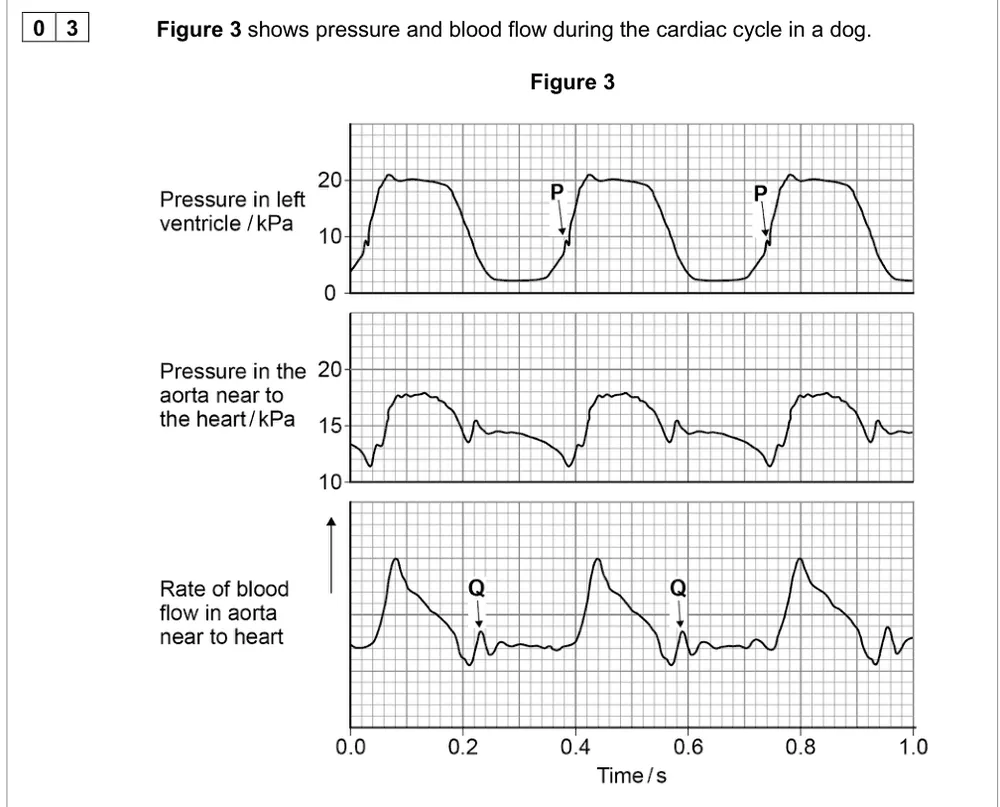
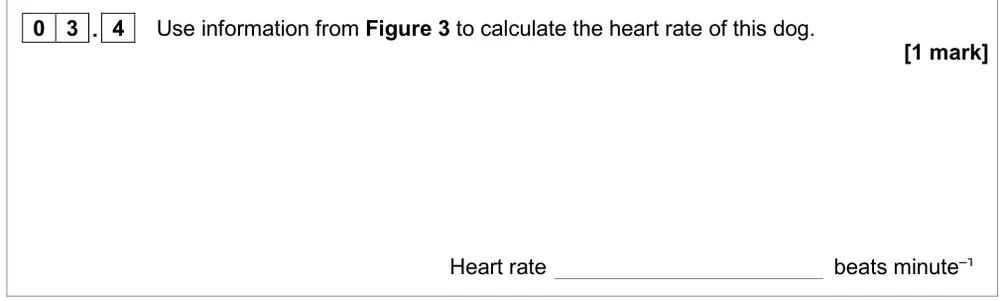
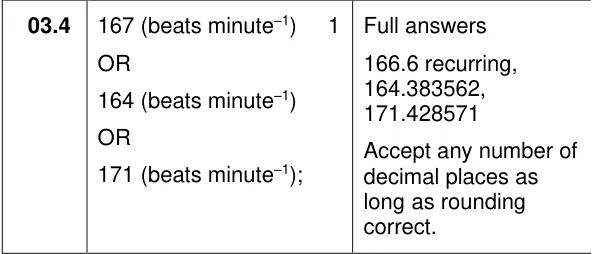
Use a trace of the cardiac cycle to calculate a dog's heart rate.
Information from earlier in this question:
Show the mark scheme
Tap an image to open it full size.
From the examiners' report: Only 34% got this. Answers ranged from a fraction of a beat to thousands per minute; check whether your answer is sensible.
Question 16
AS Paper 1 · June 2025 · Q06.2 · 2 marks · Easy
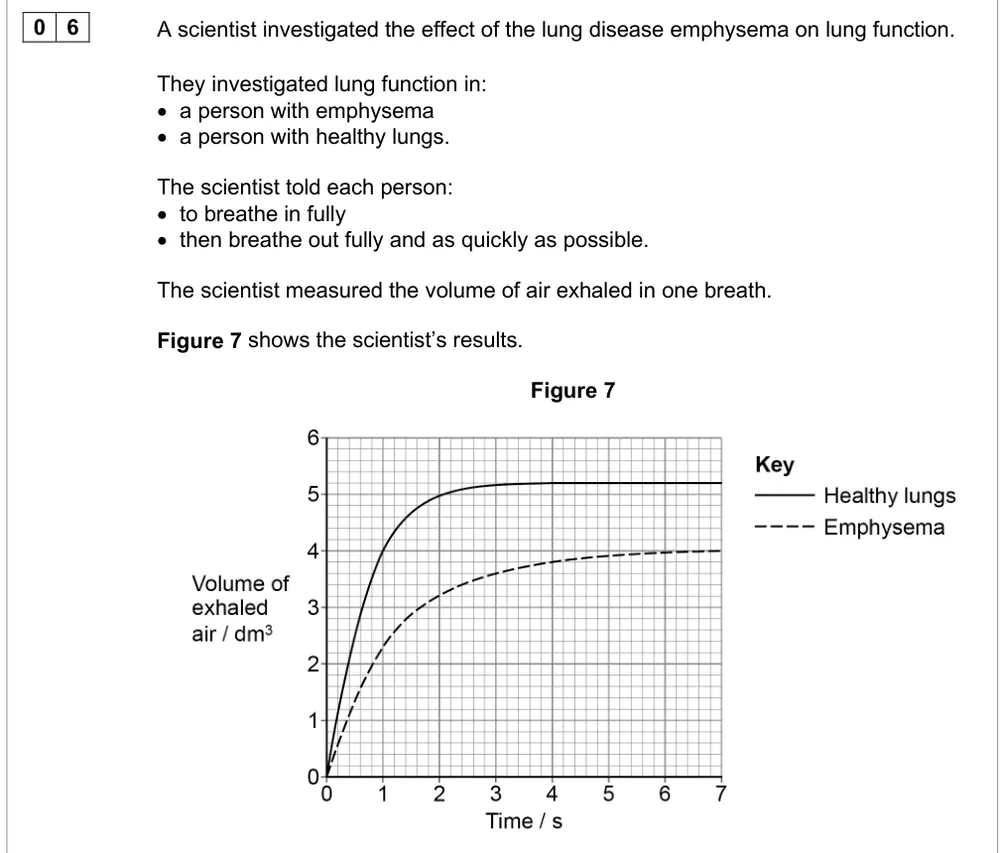
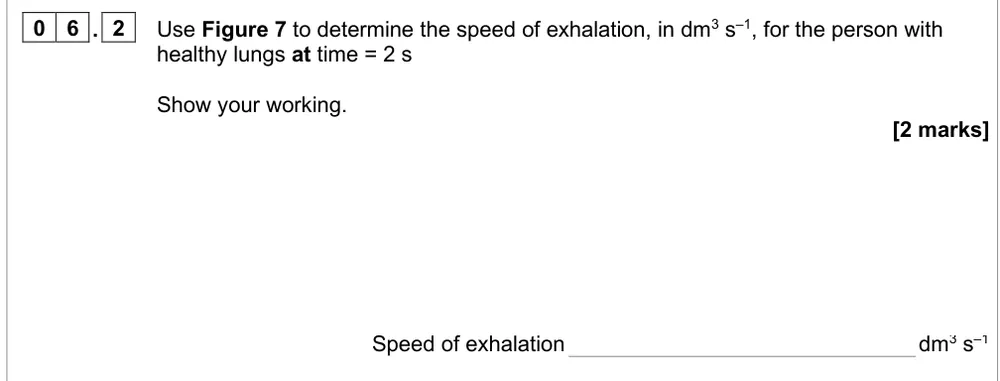
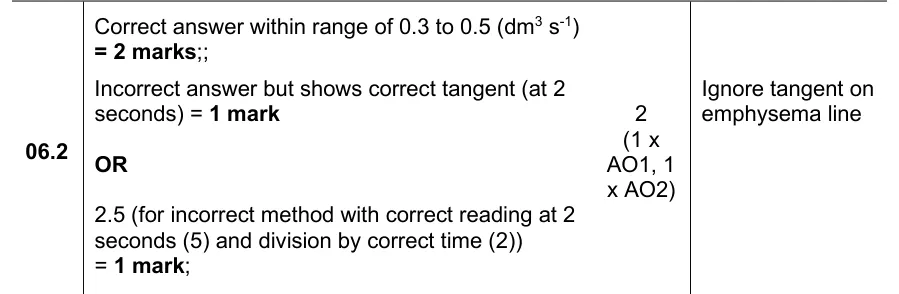
Draw a tangent to find the speed of exhalation at 2 seconds.
Information from earlier in this question:
Show the mark scheme
Tap an image to open it full size.
From the examiners' report: Only about a third drew a tangent. Reading 5 dm³ and dividing by 2 s is the wrong method; draw the tangent at 2 s and find its gradient.
Question 17
AS Paper 1 · June 2016 · Q06.2 · 2 marks
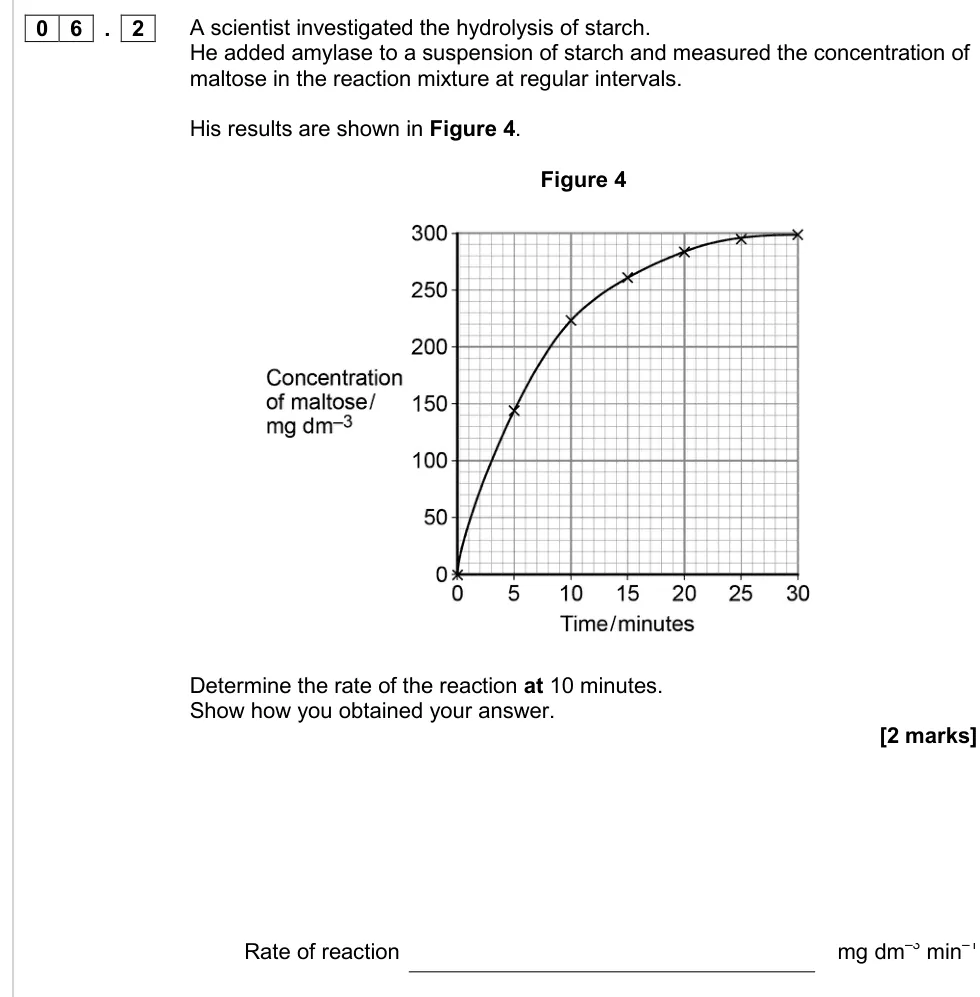
Draw a tangent to find the rate of starch hydrolysis at 10 minutes.
Show the mark scheme

Tap an image to open it full size.
From the examiners' report: There's no examiners' report for this paper. The mark scheme gives a mark for the tangent itself, so draw it clearly at 10 minutes.
Where students lose marks (from AQA examiners' reports and mark schemes)
Each point below is followed by wording that gained marks.
Check what each small square is worth: On the cyclist's fitness test only about a quarter scored 2 marks, and the most common error was misreading the axes. In other questions students misread the scale on a graph of ammonia breakdown or read the wrong part of the graph.
✔ Gains credit: Time at VT = 10 minutes; ratio of pO2 to pCO2 = 1.6875 : 1, using values read accurately from both y axes.
Write per as a negative index: Many students lost a mark because their units used a solidus, such as /day, instead of the AQA convention of negative indices.
✔ Gains credit: "4.5 µg g⁻¹ day⁻¹" (accept "per gram per day").
Draw a tangent at that time: Only about a third drew a tangent to find the speed of exhalation at 2 s. Many read 5 dm³ off the graph and divided by 2 s, which got 1 mark at most.
✔ Gains credit: A tangent drawn to the curve at 2 s, then its gradient: 0.3 to 0.5 dm³ s⁻¹.
Linear doesn't mean proportional: Many students thought that a linear relationship must also be directly proportional, so couldn't test whether the particulate matter data were linear.
✔ Gains credit: "No: 9% more dead cells per 5 µg cm⁻³ at low concentrations, but only 1.42% per 5 µg cm⁻³ between 5 and 100."
Undo the log first: On the tumour growth graph only about a third scored. Students read the graph wrongly or didn't convert between log and normal numbers, even when told which calculator button to use.
✔ Gains credit: 10⁹ ÷ 10¹² × 100 = 0.1%.
Unequal classes need a histogram: For the birth mass data, students who drew bar charts or line graphs could not get full marks. The classes are different widths.
✔ Gains credit: A histogram with linear scales, touching bars and bar widths matching each range of mass.
Pick a scale you can plot: Only 30% scored all 3 marks for plotting mean ear thickness with ±2 SD. Students chose awkward scales, used non-linear scales, drew bars touching, or mismatched the SD bars.
✔ Gains credit: A bar chart with labelled axes and units, a linear scale using at least half the grid, separate bars, and SD bars drawn above and below each mean.
Download the questions
Download the PDF pack (17 questions, mark schemes at the end)
Keep practising
- Carbohydrates: AQA A Level Biology exam questions by topic
- Required practical 1, enzyme rates: AQA A Level Biology exam questions
- Calculations and mathematical content in A level Biology, from AQA papers
- AQA A Level Biology masterclasses
Questions, mark schemes and examiners' report extracts © AQA.