

If your GCSEs average 7 to 8, about 1 in 3 students like you got an A or A* in A-level Biology in 2025, and about 1 in 18 got the A*. Average 8 to 9 and those odds rise to 4 in 5 for an A or A*, and 1 in 3 for the A*. Below a 6 average the top grades are rare — but every year some students prove they are possible.
In nearly 30 years of teaching sixth-form Biology, the question I hear most in September is: "Can I get an A*?" The honest answer starts with your GCSEs. The Department for Education tracks every A-level student in England from their GCSE results to their A-level grades. Below I use its figures for 60,000 Biology students who finished their A-levels in summer 2025 to show what students with GCSEs like yours went on to achieve.
These are odds, not a verdict. Your GCSEs tell you where you start. What you do in the next two years decides where you finish.
Step 1: work out your GCSE average
Add up the grades for all your GCSEs and divide by the number of GCSEs. Use every subject, not just the sciences. This mirrors how the DfE does it: for A-level students, prior attainment is "based on their average attainment in GCSEs only", using your best result in each subject and weighting each qualification by its size, so a double-award Combined Science carries more weight than a single GCSE. Only GCSEs taken by the end of Year 11 count; resits in the sixth form are ignored (DfE 16 to 18 accountability measures technical guidance, February 2026, pp. 24 and 27).
Some examples:
All 7s → average 7.0
Half 7s, half 8s (e.g. five 7s and five 8s) → average 7.5
Mostly 6s with a few 7s (e.g. seven 6s and three 7s) → average 6.3
All 8s and 9s (e.g. five 8s and five 9s) → average 8.5
Mostly 5s and 6s (e.g. five 5s and five 6s) → average 5.5
Then find your band. The DfE groups students in whole-number bands: an average of 7.0 up to 7.9 is the "7 to 8" band, and so on. If you sit near the bottom of a band, your odds are a little lower than the band figure; near the top, a little higher.
The picture at a glance
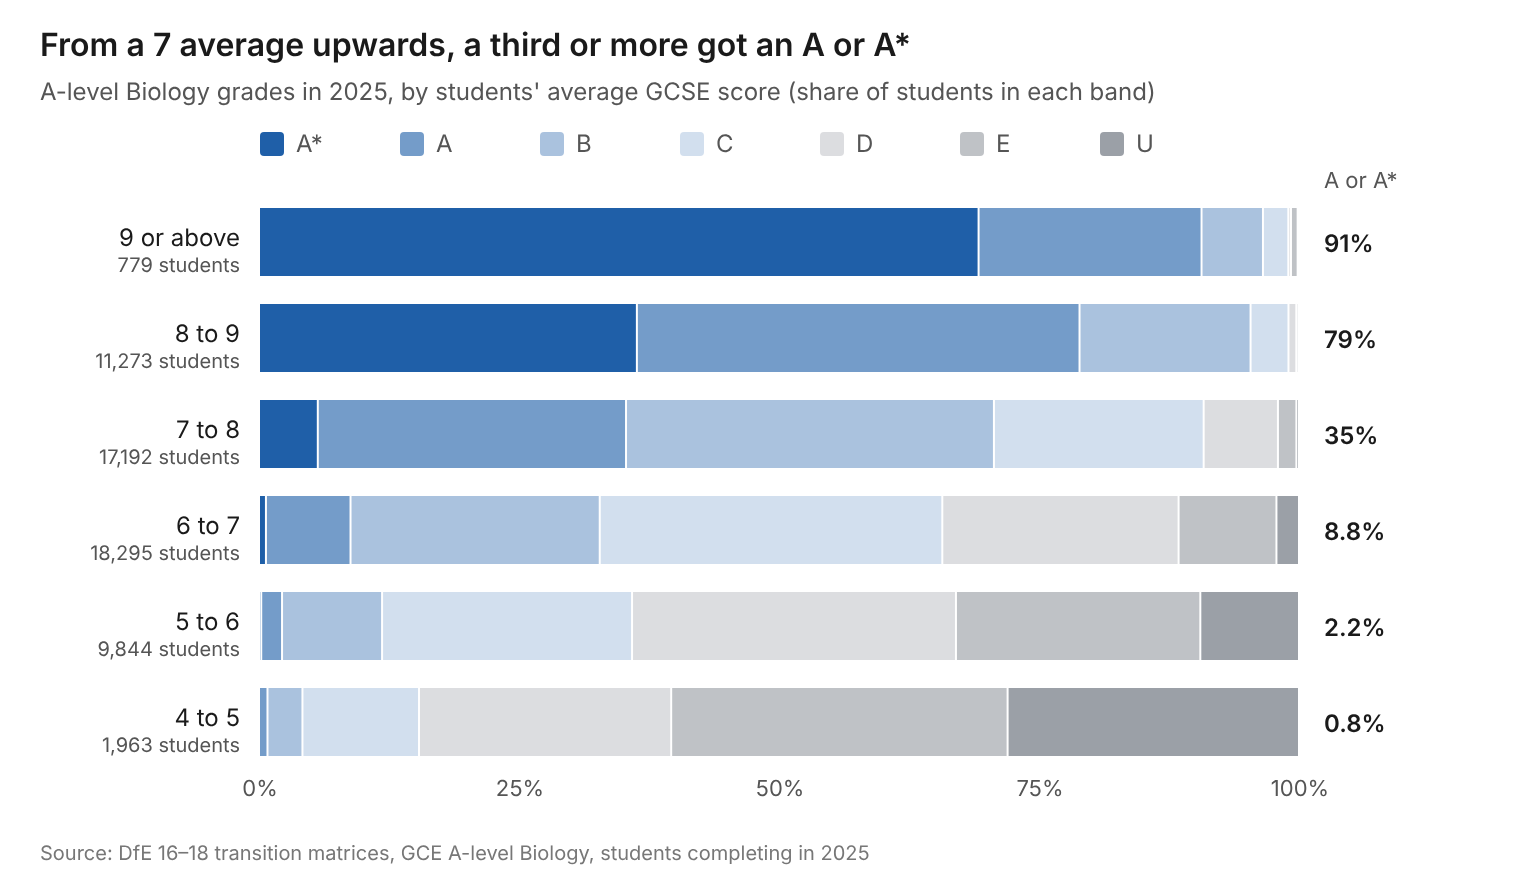
Each bar is a group of students with similar GCSEs. The darker the blue, the higher the grade. The figure at the end of each bar is the share of that group who got an A or A*.
Step 2: your odds in plain numbers
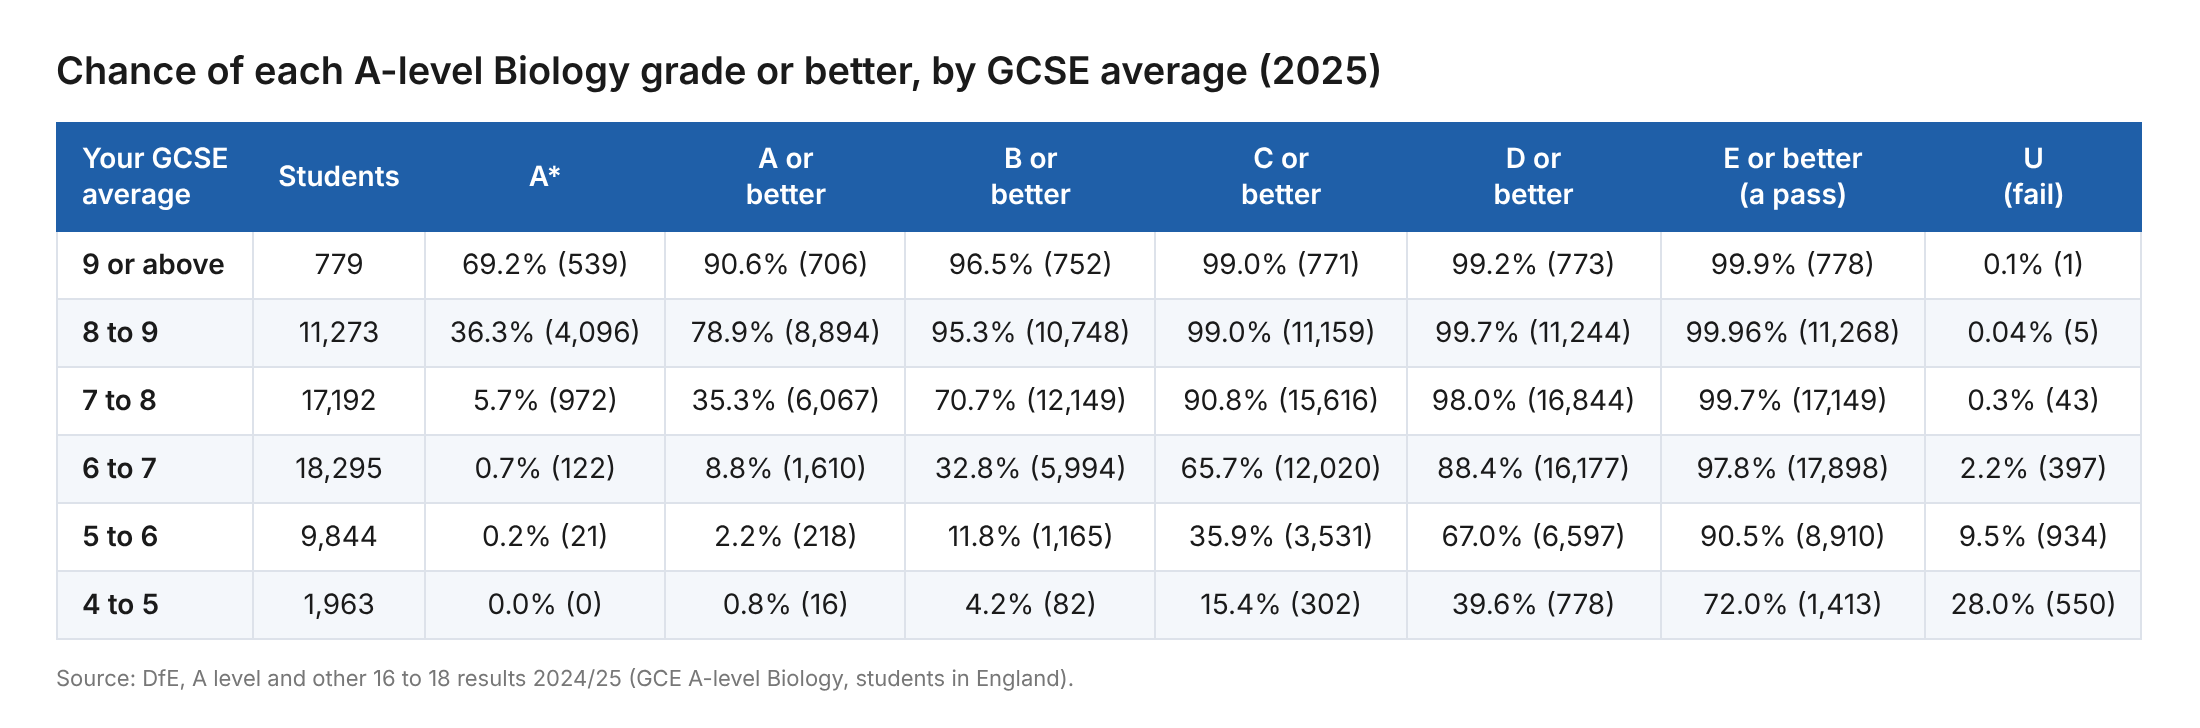
For each GCSE band, this is how many A-level Biology students in summer 2025 reached each grade.
Each cell shows the percentage, then the number of students in brackets.
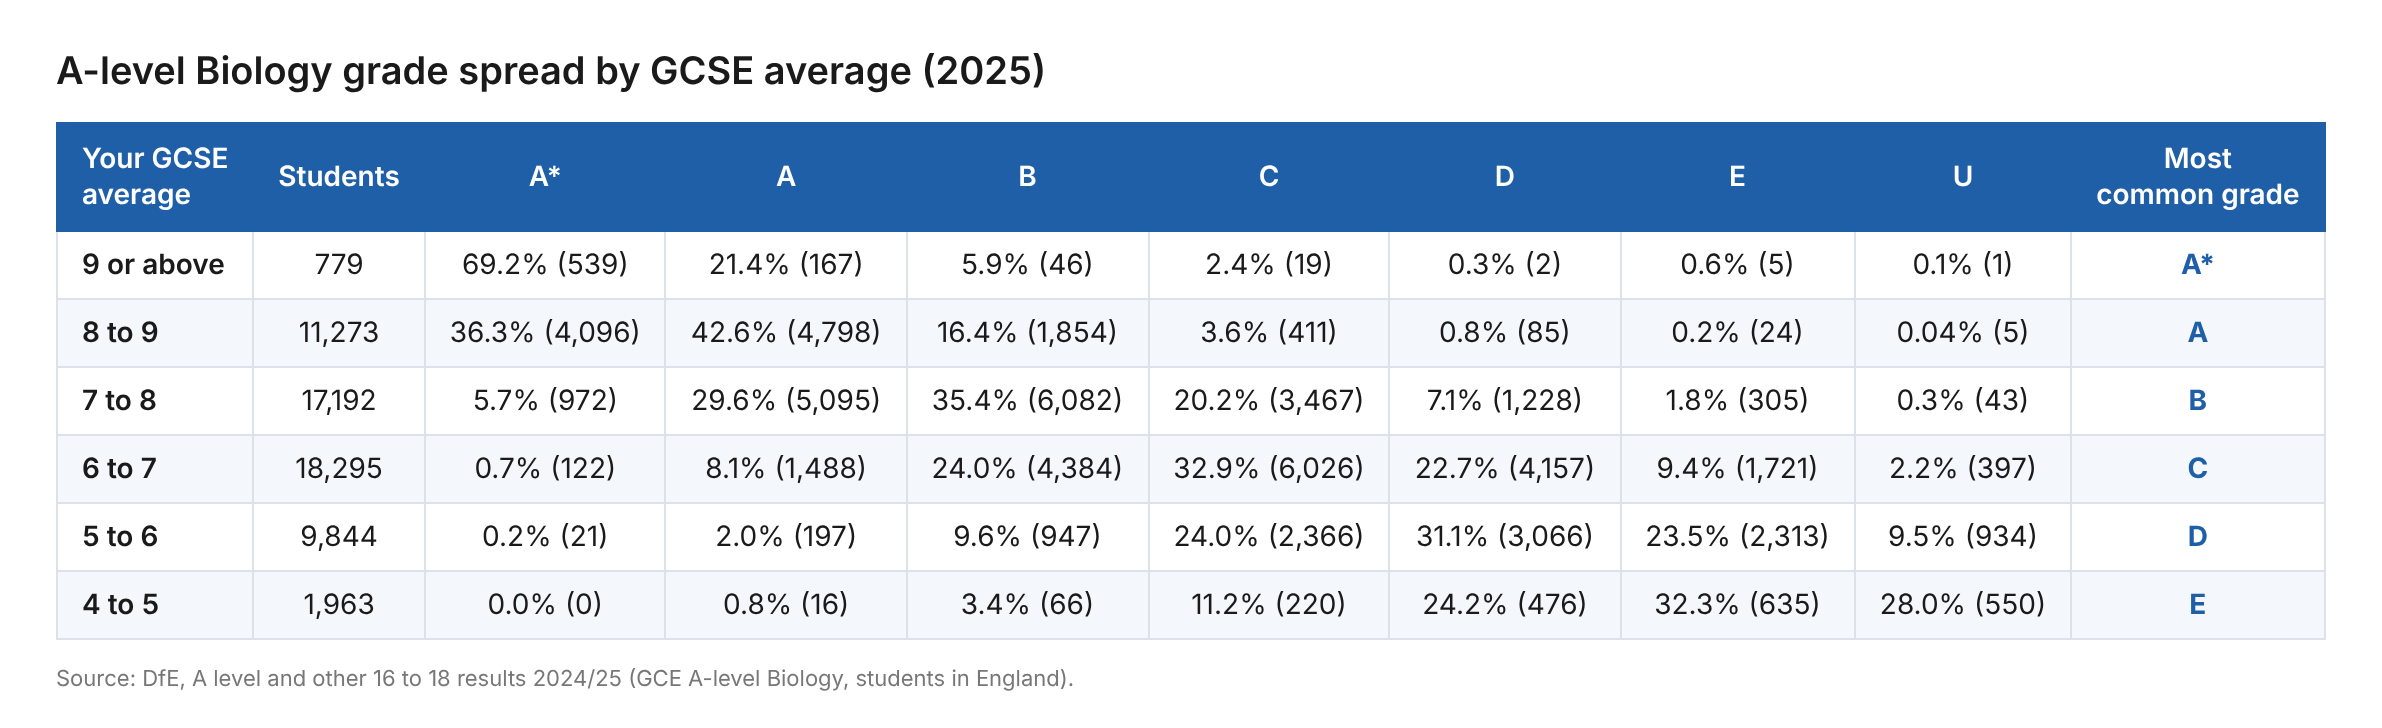
And here is the full spread: the share of students in each band who finished on each grade.
Source: DfE, A level and other 16 to 18 results 2024/25, supporting file tm_numbers_percentages_2025A.csv, rows for GCE A level (code 111), Biology (subject code 1010), size 1. Student numbers are DfE's counts. Percentages are calculated from those counts and match DfE's own published percentages after rounding.
The biggest jumps happen between bands. Moving from a 6–7 average to 7–8 multiplies your chance of an A or A* by four. Moving from 7–8 to 8–9 more than doubles it again. At the other end, the risk of a U falls sharply: from more than 1 in 4 students in the 4–5 band to about 1 in 11 in the 5–6 band, and almost none from a 7 average upwards.
How to use the table
Work out your GCSE average (Step 1). Write it down to one decimal place, for example 7.4.
Find your row. Take the whole number in front of the decimal point: 7.4 goes in the "7 to 8" row, 6.9 in "6 to 7", 8.0 in "8 to 9". An average of exactly 9 goes in "9 or above".
Read across to the grade you want. Each figure answers one question: out of every 100 students with GCSEs like yours, how many reached at least that grade? For a 7.4 average, 35 in 100 got an A or A*, 71 in 100 got a B or better, 91 in 100 got a C or better and 98 in 100 got a D or better. Only 3 in 1,000 got a U. The second table shows the same students grade by grade, with the most common grade in the last column.
Adjust for where you sit in the band. The figures are an average for everyone in the row. If you are near the bottom (7.0–7.3), your odds are a little lower; near the top (7.7–7.9), a little higher. Glance at the row above and below to see which way you lean.
Look one row up. That row shows the odds of students who started a step ahead of you. Working as though you are in that row is a realistic stretch target.
Use it to set a target, not a ceiling. If the table says a B is most likely, aim for an A and plan the work it will take. Revisit your target after each set of mocks.
Three things the table cannot tell you:
Your effort from here. It records what students like you achieved, not what you will achieve.
Your Biology GCSE grade on its own. It uses your average across all GCSEs, not your science grade.
Your exam board or school. It covers every A-level Biology student in England, across all boards.
What this means for students like you
"I got all 8s and 9s" (average 8.5). You are in the strongest position. Four in five students like you got an A or A*, and more than a third got the A*. The risk at this level is complacency: one in five still finished on a B or below.
"I got a mix of 7s and 8s" (average 7.5). You sit in the middle of the 7–8 band. About a third of students like you got an A or A*: 30% got an A and 6% the A*. The most common grade was a B (35%). An A is very much within reach; an A* needs you to finish in the top few per cent of your group.
"I got all 7s" (average 7.0). You are at the bottom edge of the 7–8 band, so your true odds are a little below the band figures: somewhere between 1 in 10 and 1 in 3 for an A or A*. The most likely outcome is a B or C. An A* is unusual from here but not unheard of.
"Mostly 6s with a few 7s" (average 6.3). The most common grade was a C (33%), with a B next (24%). About 1 in 11 got an A or A*. In 2025, 1,488 students in this band got an A and 122 got an A*. They are proof it can be done.
"Mostly 5s and 6s" (average 5.5). The most common grade was a D (31%). Around 1 in 45 got an A or A* — that is 218 real students in 2025, including 21 who got the A*. If that is your goal, you need to work differently from the start, not harder in the last term.
Odds are not destiny
Every band contains students who beat the odds, and the gap they close is made in the classroom and at the desk. GCSE results measure how you worked at 15 and 16. A-level Biology rewards habits you can build now. In my experience, the students who outperform their GCSEs share five habits:
They start in Year 12, not Year 13. Content builds on itself. Gaps left in the first term show up in every paper.
They practise past-paper questions every week. Biology mark schemes reward precise wording. Students who see hundreds of questions learn what examiners want.
They mark their own work against the mark scheme. Spotting why a mark was lost is worth more than reading notes again.
They take the maths and practical skills seriously. Statistics, calculations and required practicals are reliable marks that many students leave on the table.
They act on feedback quickly. Mocks are information, not a judgement. The students who improve most change what they do after each one.
One more reason for optimism: the odds are not fixed from year to year. In 2024, students with a 7–8 average had a 25% chance of an A or A*; in 2025 it was 35%. Grading, papers and cohorts all shift. What stays constant is that effort moves you up the distribution.
So be realistic, but not discouraged. If your GCSEs average 6, an A* is unlikely — but unlikely is not impossible. Hundreds of students in your position reached an A last year. With the right work, you can be one of them.
About the data
Every figure in this article comes from the Department for Education's 16–18 transition matrices, and was checked against the published file on 14 October 2026.
2025 figures: A level and other 16 to 18 results, academic year 2024/25. Use "Download all data (ZIP)" and open supporting-files/tm_numbers_percentages_2025A.csv. Filter to qualification_name "GCE A level", subject_name "Biology", size 1. This covers 61,340 Biology A-level results from students in England who finished 16–18 study in 2025.
2024 comparison: A level and other 16 to 18 results, academic year 2023/24, file supporting-files/tm_numbers_percentages_2024A.csv, same filter. In the 7–8 band, 3.30% got an A* and 21.57% an A (24.9% combined).
How the GCSE average is calculated: DfE 16 to 18 accountability measures technical guidance (February 2026).
How to read the matrices: ks5_transition_matrices_notes.docx, in the same download. DfE also publishes an interactive version.
The "students like you" figures for an all-7s average (between 1 in 10 and 1 in 3) are my estimate: DfE reports only whole-number bands, so a 7.0 average sits at the bottom of the 7–8 band. Students without GCSE results, and the 148 students below a 4 average, are left out of the tables.
The bands are averages across every GCSE, not your grade in GCSE Biology or Combined Science. They describe what happened to students like you, not what will happen to you.
Sources
DfE – A level and other 16 to 18 results, 2024/25 (supporting file tm_numbers_percentages_2025A.csv)
DfE – A level and other 16 to 18 results, 2023/24 (supporting file tm_numbers_percentages_2024A.csv)