
DO NOT LOOK at the question and then look at the data to answer the question.
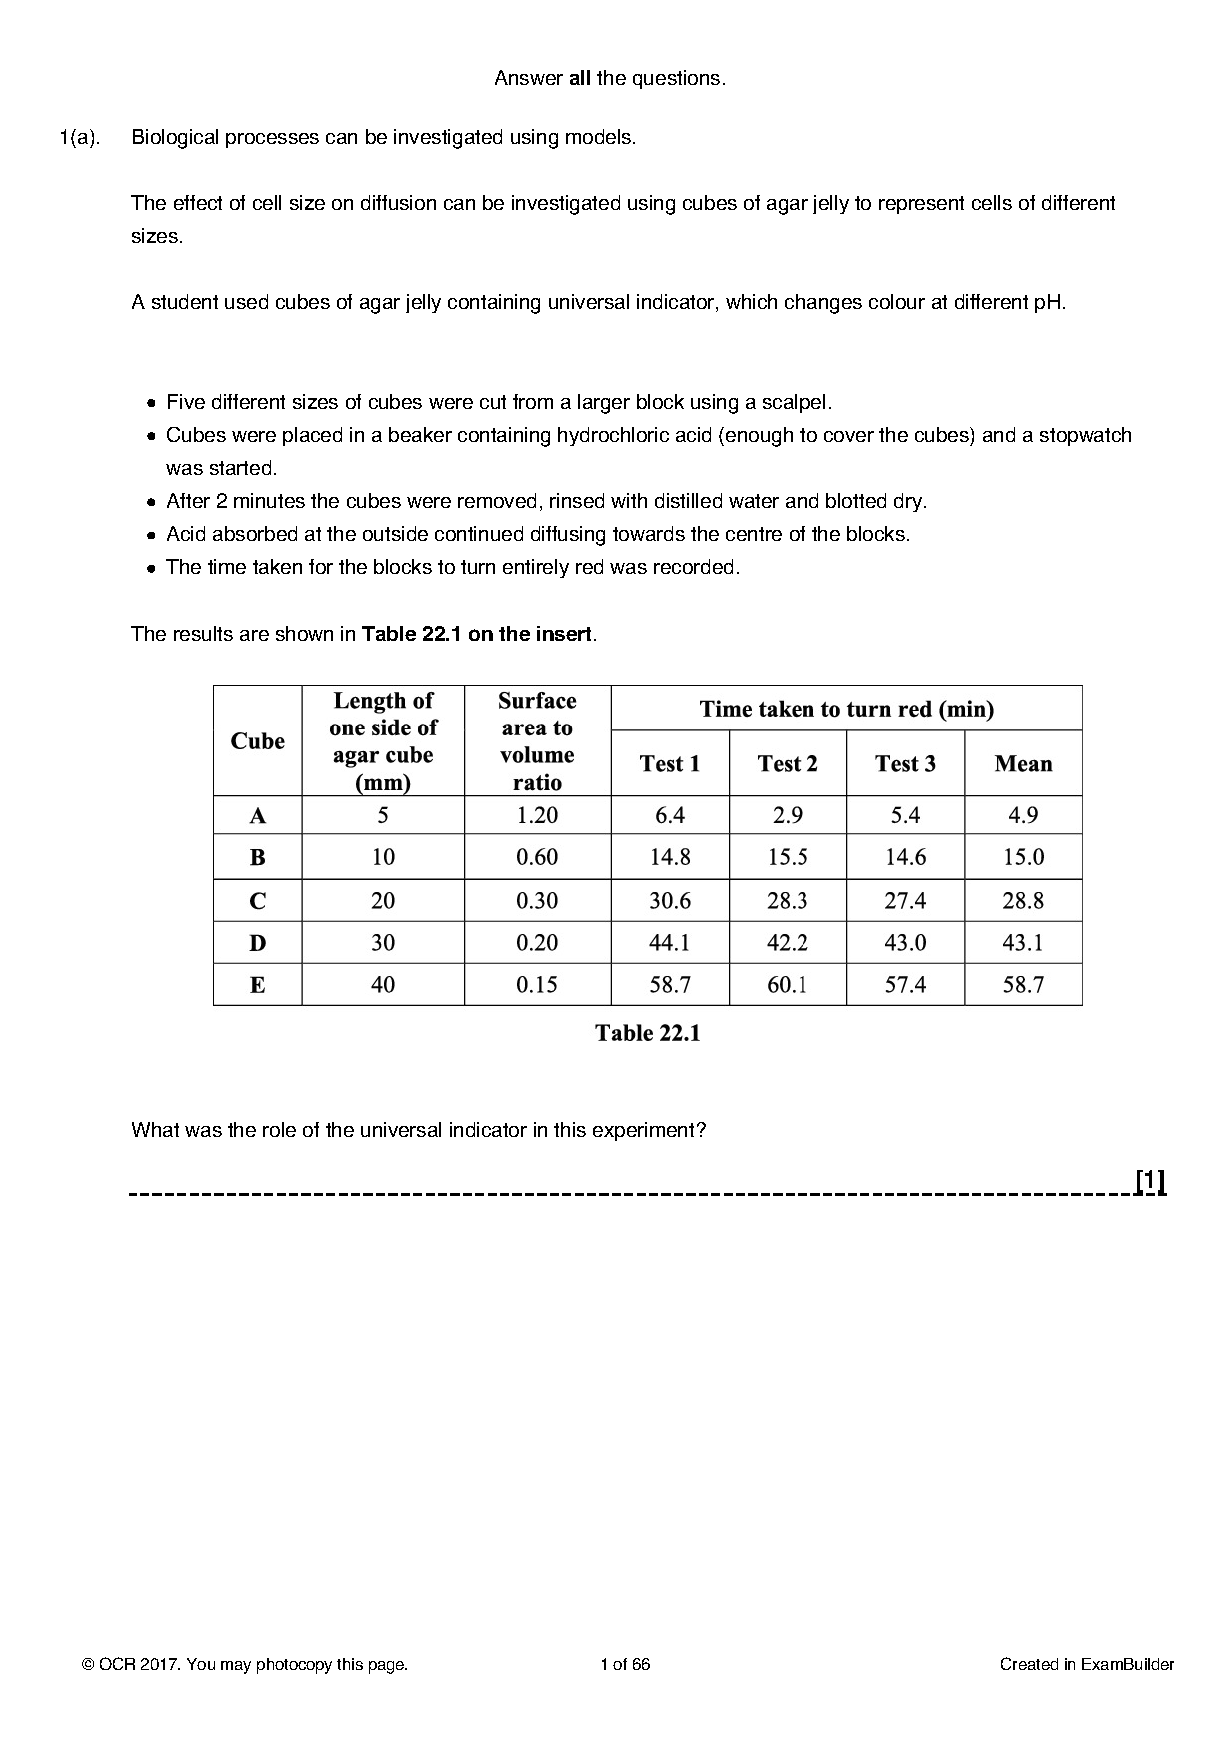
ALWAYS LOOK AT THE DATA FIRST
Look closely at the graph or table
Graph look very carefully at the axes - have they plotted rate or time, mass/volume or concentration ? Often students assume enzyme graphs have rate on the y axis - sometimes they don’t !
Table - is the IV in the first column ? What are the units of the DV ? Has a mean been calculated ? Is the data in each row consistent ?
are there range/SD bars on the graph ? remember this indicates the variation in the data that was used to calculate the mean
do the range bars or standard deviation bars overlap ?
In a table what range is in the replicates when you compare to the mean ?
what trends can you observe ? then think about what principle of biology is being shown by the the trends.
How would you explain the highest value, the lowest value, the point at which the line crosses the x axis, how would you explain the largest range, how would you change the method to reduce the spread in the data ?
Once you have a coherent understanding of the trends - only then look at the question.
try this - about 20 questions with data and analysis
If you found it useful then please ❤️ (at the bottom of the page) and share, you can follow me on instagram - alevelbiologytutor
Tuesday night group tutoring topics and Y13 & Y12 OCR A and AQA small group weekly class information